| Param | Original file | Final file |
|---|---|---|
| Filename | modeM0/AS1A02_118T01_9000000826cztM0_level2.fits | modeM0/AS1A02_118T01_9000000826cztM0_level2_quad_clean.evt |
| Size (bytes) | 818,729,280 | 1,013,448,960 |
| Size | 780.8 MB | 966.5 MB |
| Events in quadrant A | 4,919,052 | 6,553,958 |
| Events in quadrant B | 4,706,558 | 6,353,946 |
| Events in quadrant C | 4,912,806 | 6,317,790 |
| Events in quadrant D | 3,974,842 | 5,194,670 |
| Mode M9 | |||
|---|---|---|---|
| Quadrant | BADHDUFLAG | Total packets | Discarded packets |
| A | 0 | 143 | 0 |
| B | 0 | 143 | 0 |
| C | 0 | 143 | 0 |
| D | 0 | 143 | 0 |
| Mode SS | |||
|---|---|---|---|
| Quadrant | BADHDUFLAG | Total packets | Discarded packets |
| A | 0 | 1870 | 0 |
| B | 0 | 1870 | 0 |
| C | 0 | 1870 | 0 |
| D | 0 | 1870 | 0 |
| Mode M0 | |||
|---|---|---|---|
| Quadrant | BADHDUFLAG | Total packets | Discarded packets |
| A | 0 | 221725 | 0 |
| B | 0 | 225972 | 0 |
| C | 0 | 186826 | 0 |
| D | 0 | 335216 | 0 |
| Quadrant | Total seconds | Saturated seconds | Saturation percentage |
|---|---|---|---|
| A | 91513 | 1407 | 1.537486% |
| B | 91513 | 4731 | 5.169757% |
| C | 91513 | 810 | 0.885120% |
| D | 91513 | 11808 | 12.903085% |
Noise dominated data is calculated using 1-second bins in cleaned event files. If a bin has >2000 counts, and if more than 50% of those come from <1% of pixels, then it is considered to be noise-dominated and hence unusable.
| Quadrant | # 1 sec bins | Bins with >0 counts | Bins with >2000 counts | High rate bins dominated by noise | Noise dominated (total time) | Noise dominated (detector-on time) | Marked lightcurve |
|---|---|---|---|---|---|---|---|
| A | 106044 | 91500 | 0 | 0 | 0.00% | 0.00% | 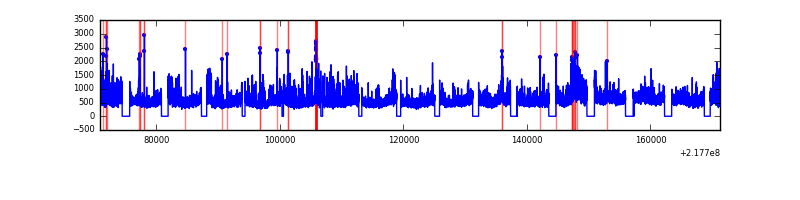 |
| B | 106045 | 91453 | 0 | 0 | 0.00% | 0.00% | 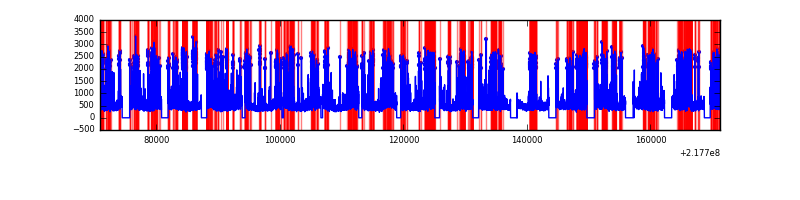 |
| C | 106045 | 91501 | 0 | 0 | 0.00% | 0.00% | 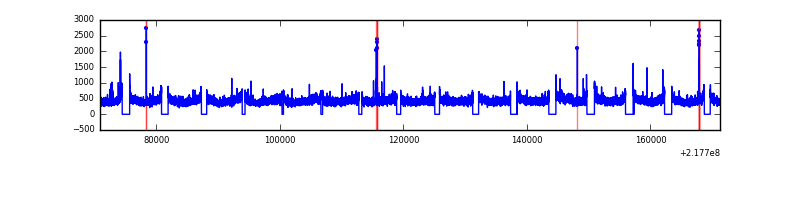 |
| D | 106044 | 91455 | 0 | 0 | 0.00% | 0.00% | 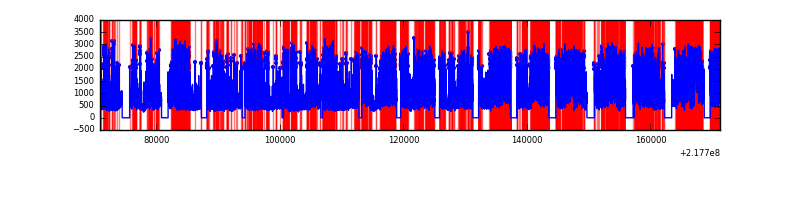 |
Top three noisy pixels from each quadrant. If the there are fewer than three noisy pixels in the level2.evt file, extra rows are filled as -1
| Pixel properties | Quadrant properties | ||||||
|---|---|---|---|---|---|---|---|
| Quadrant | DetID | PixID | Counts | Sigma | Mean | Median | Sigma |
| A | 14 | 188 | 5072 | 12.13 | 1279 | 1201 | 319.2 |
| A | 0 | 29 | 4577 | 10.58 | 1279 | 1201 | 319.2 |
| A | 14 | 204 | 4338 | 9.83 | 1279 | 1201 | 319.2 |
| B | 2 | 9 | 4096 | 12.15 | 1244 | 1191 | 239.1 |
| B | 12 | 226 | 3331 | 8.95 | 1244 | 1191 | 239.1 |
| B | 14 | 254 | 3244 | 8.58 | 1244 | 1191 | 239.1 |
| C | 1 | 80 | 3616 | 7.04 | 1296 | 1204 | 342.5 |
| C | 1 | 81 | 3573 | 6.92 | 1296 | 1204 | 342.5 |
| C | 12 | 241 | 3506 | 6.72 | 1296 | 1204 | 342.5 |
| D | 11 | 82 | 2962 | 6.33 | 1132 | 1024 | 306.1 |
| D | 3 | 14 | 2961 | 6.33 | 1132 | 1024 | 306.1 |
| D | 4 | 160 | 2942 | 6.27 | 1132 | 1024 | 306.1 |
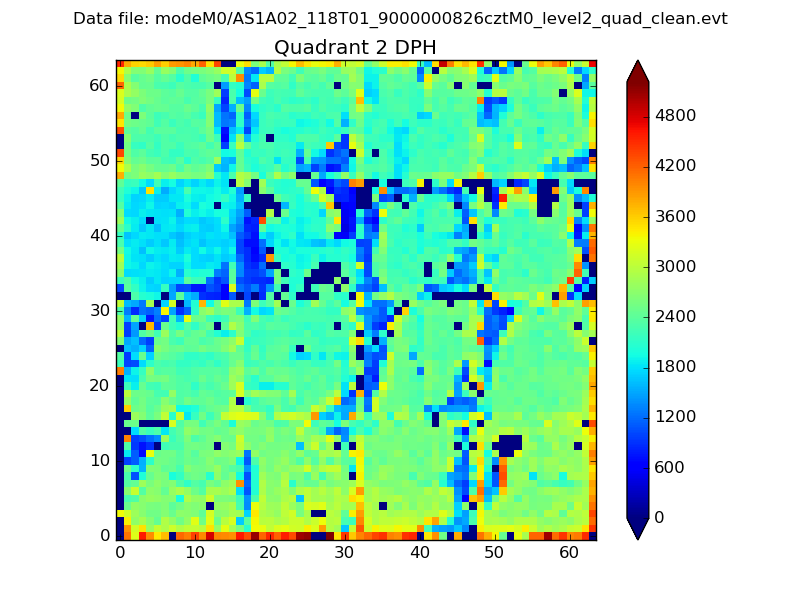
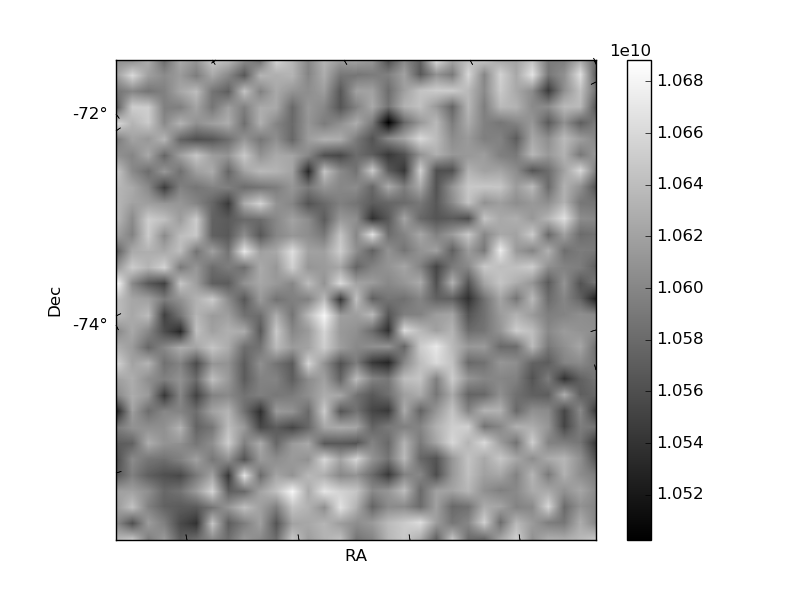
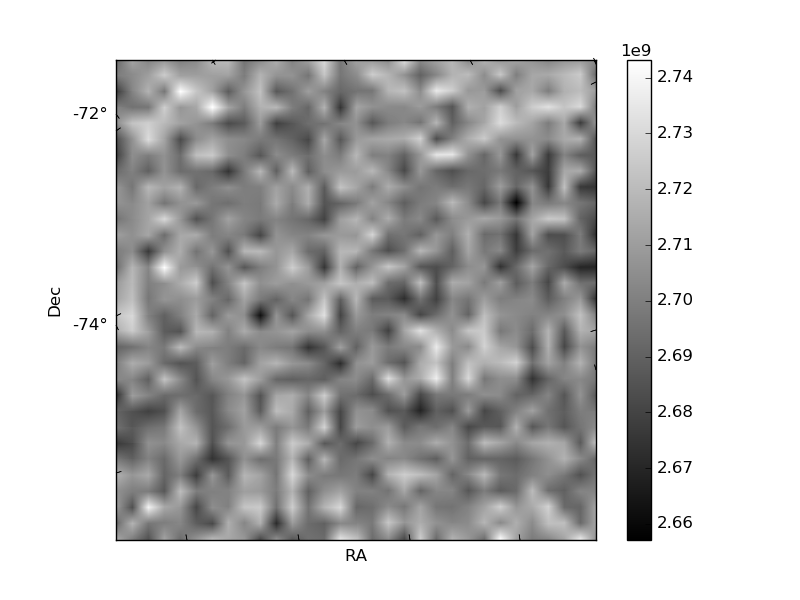
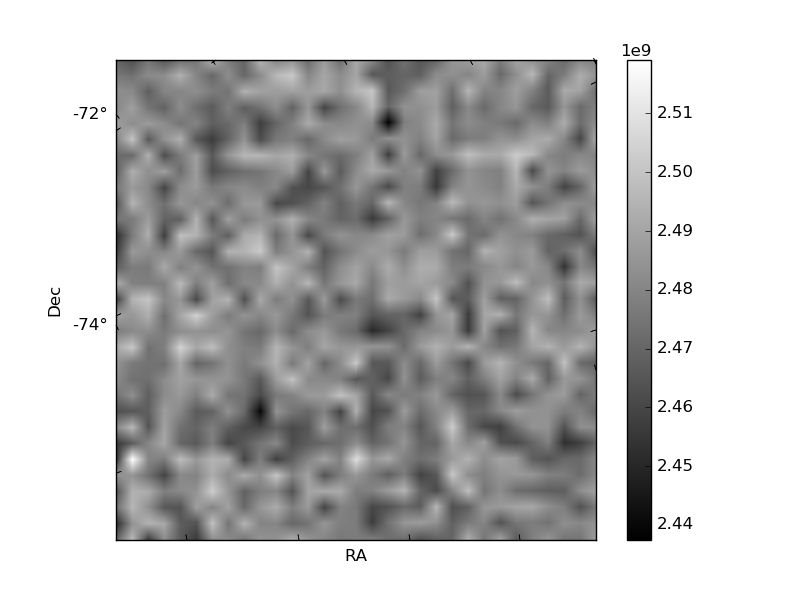
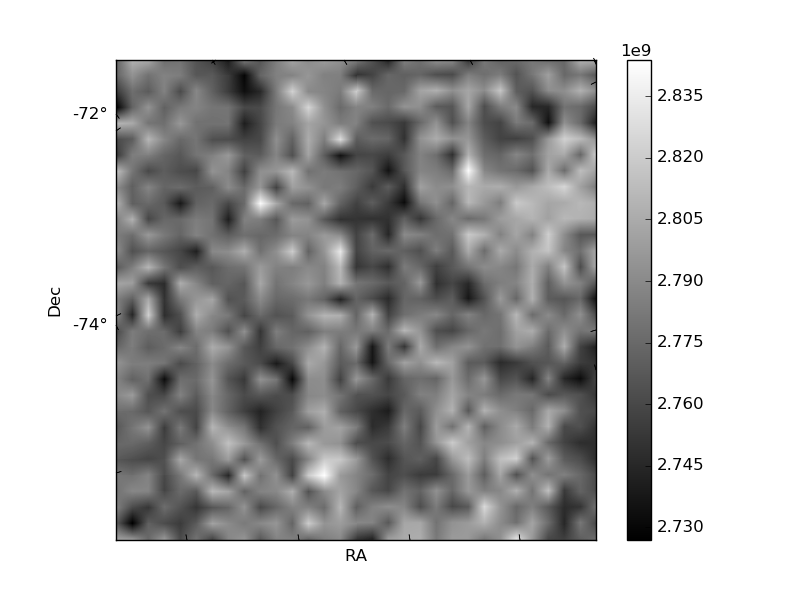
Histogram calculated using DETX and DETY for each event in the final _common_clean file
| Quadrant A | 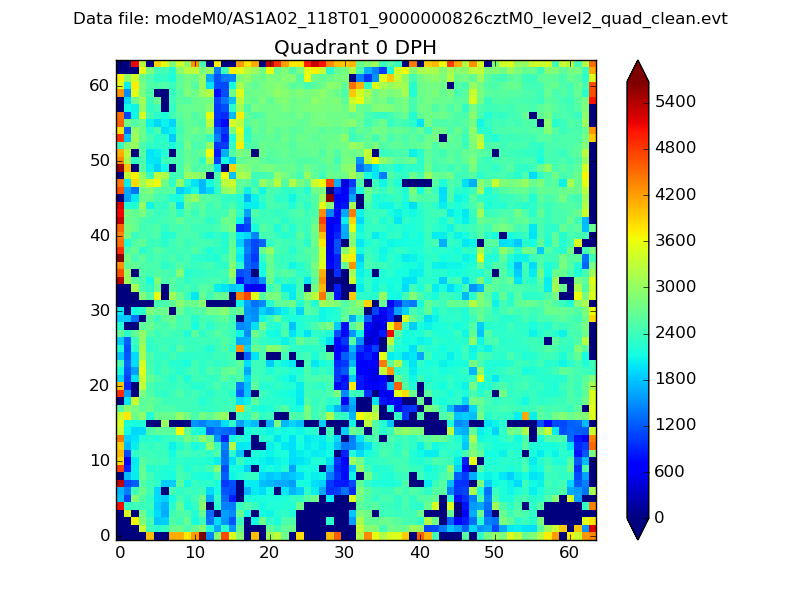 |
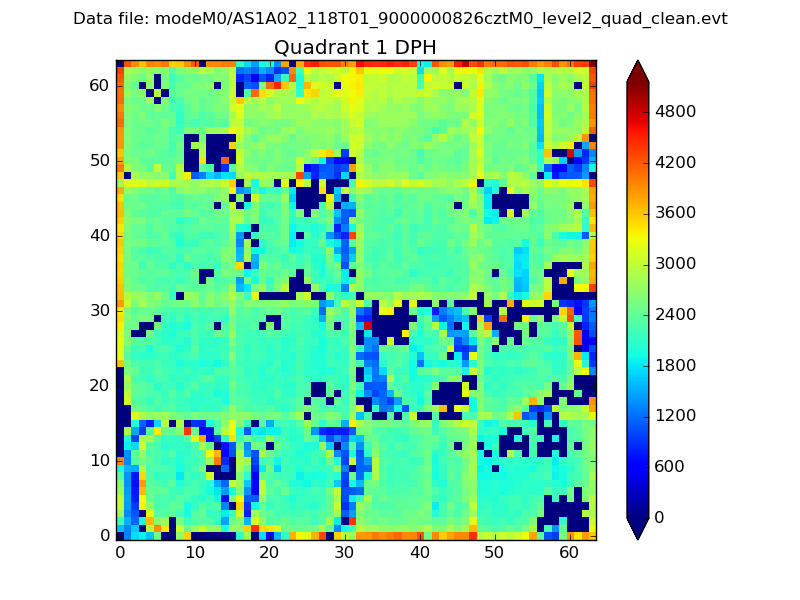 |
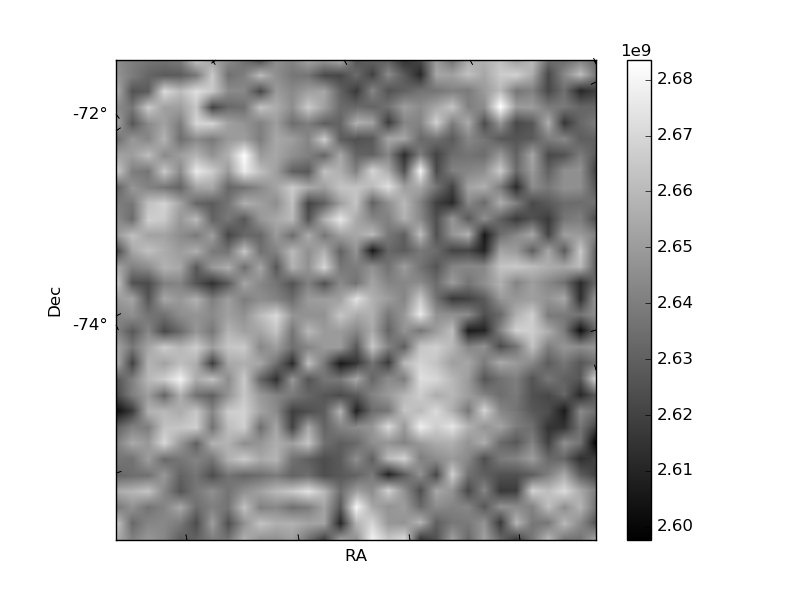
Quadrant B |
|---|---|---|---|
| Quadrant D | 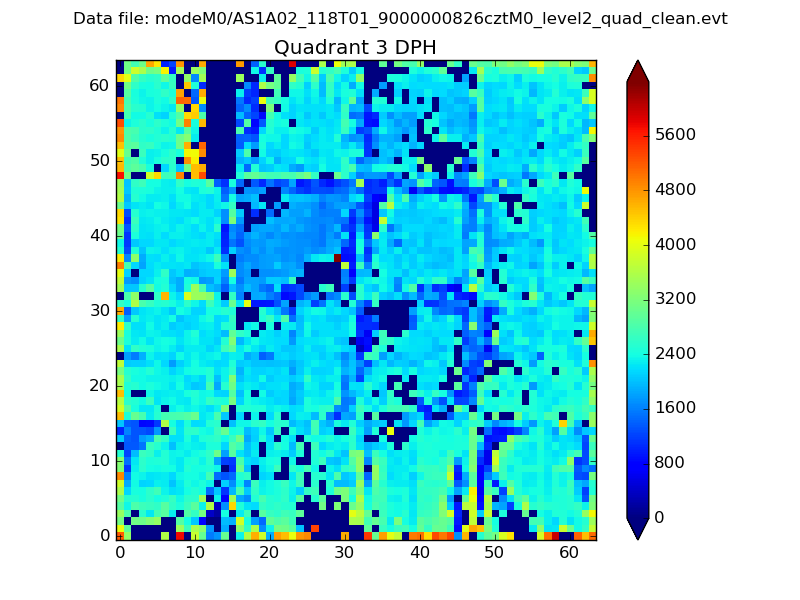 |
 |
Quadrant C |
| Plot type | Count rate plots | Images |
|---|---|---|
| Comparison with Poisson distribution Blue bars denote a histogram of data divided into 1 sec bins. Red curve is a Poisson curve with rate = median count rate of data. |
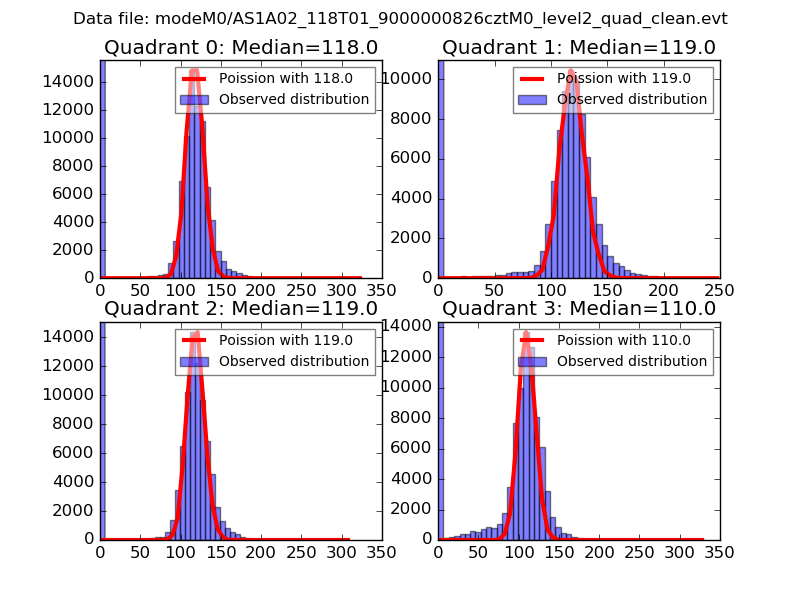 |
 |
| Quadrant-wise count rates Data is divided into 100 sec bins |
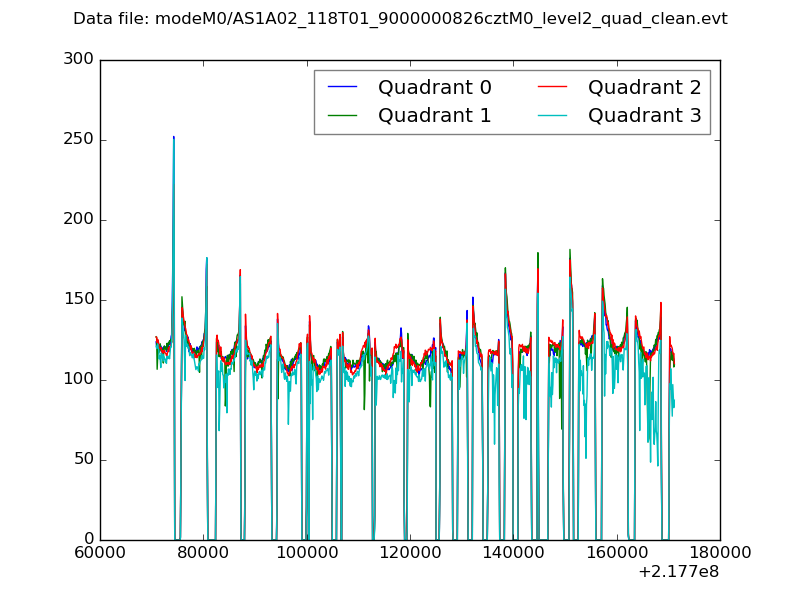 |
|
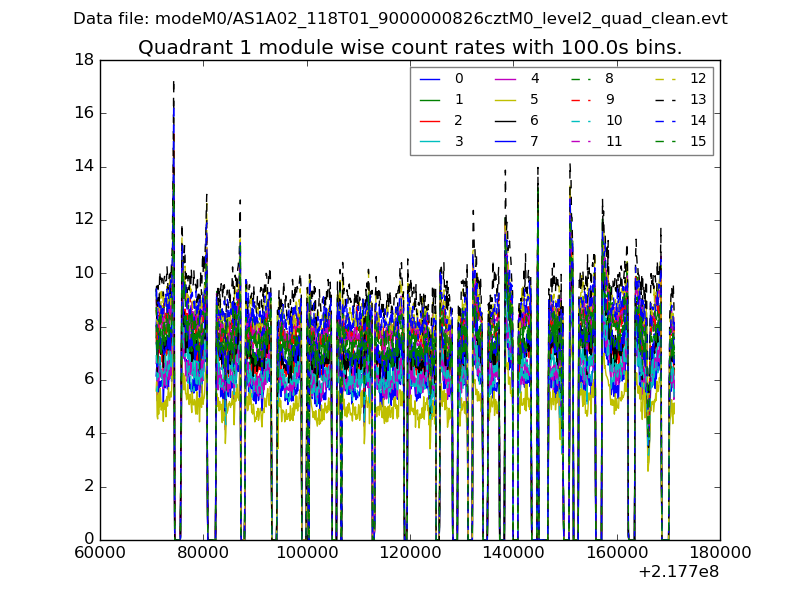
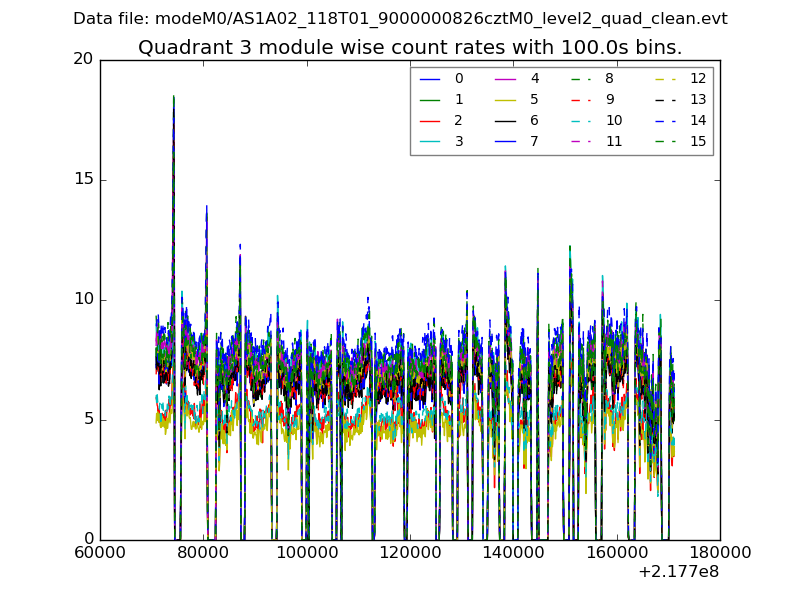
| Module-wise count rates for Quadrant A Data is divided into 100 sec bins |
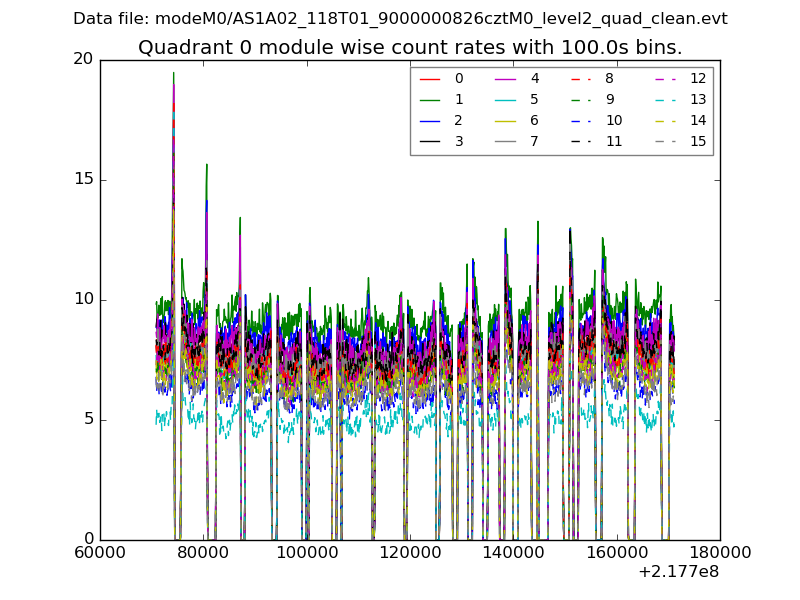 |
 |
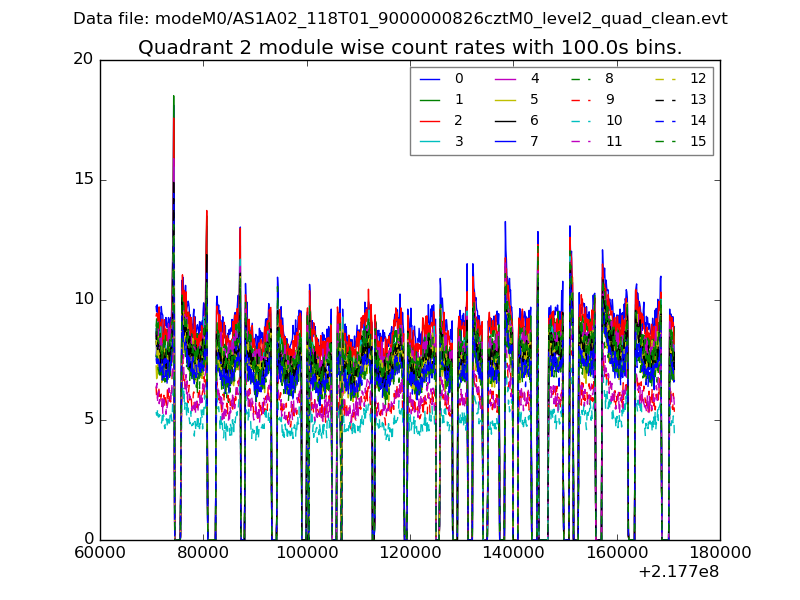
| Module-wise count rates for Quadrant B Data is divided into 100 sec bins |
 |
 |
| Module-wise count rates for Quadrant C Data is divided into 100 sec bins |
 |
 |
| Module-wise count rates for Quadrant D Data is divided into 100 sec bins |
 |
 |
| Parameter | Plot |
|---|---|
| CZT HV Monitor | 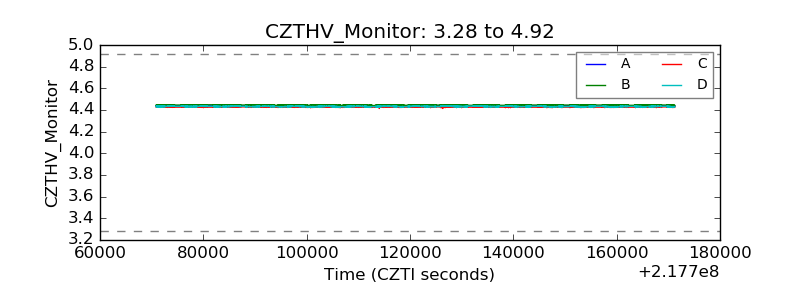 |
| D_VDD | 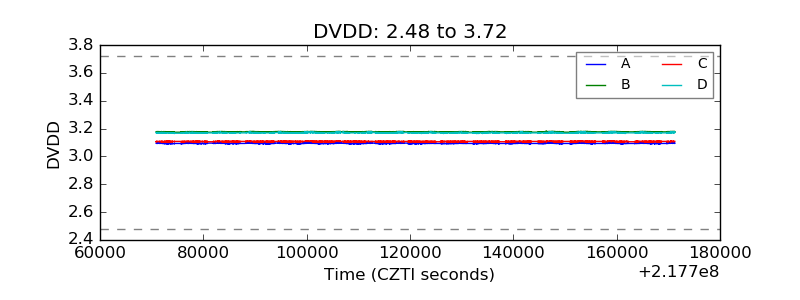 |
| Temperature 1 | 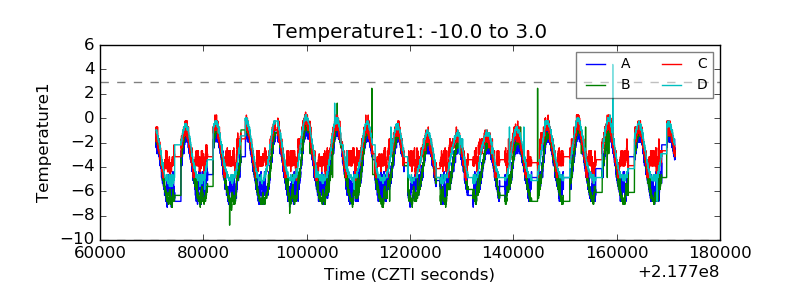 |
| Veto HV Monitor | 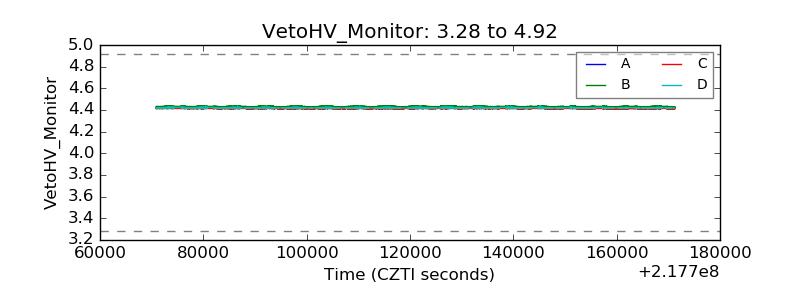 |
| Veto LLD | 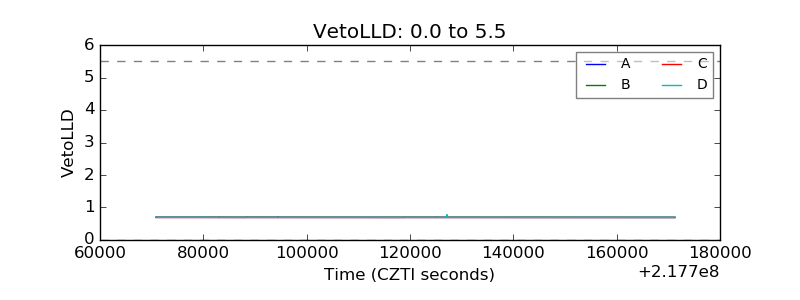 |
| Alpha Counter | 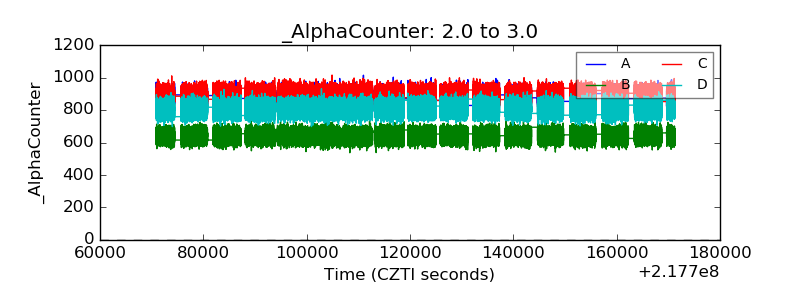 |
| _CPM_Rate | 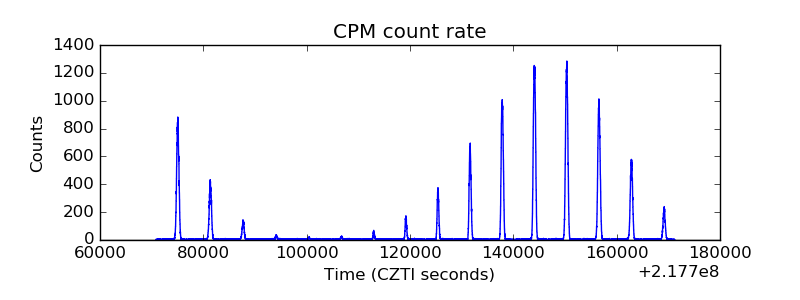 |
| CZT Counter | 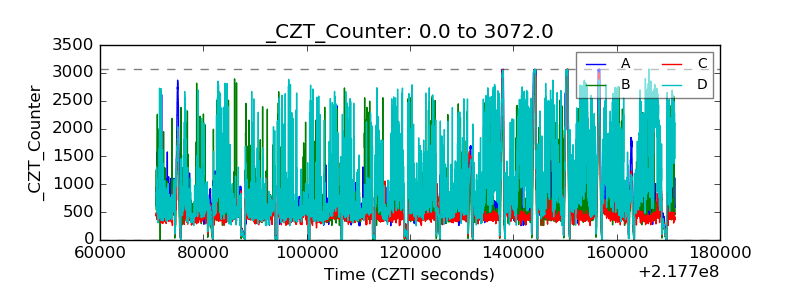 |
| +2.5 Volts monitor | 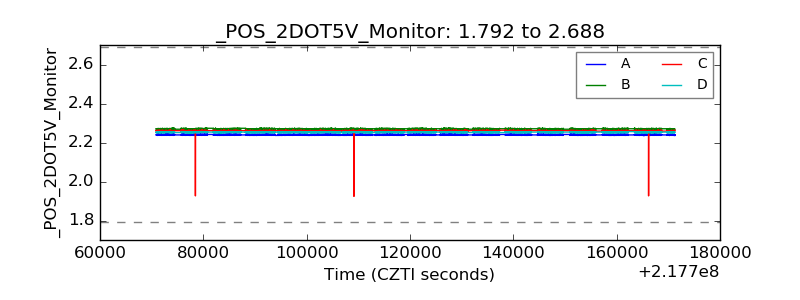 |
| +5 Volts monitor | 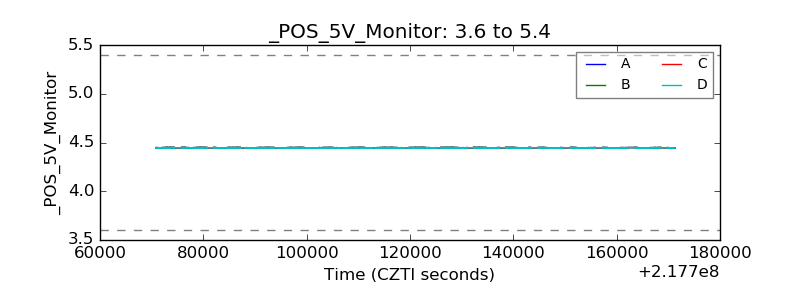 |
| _ROLL_ROT | 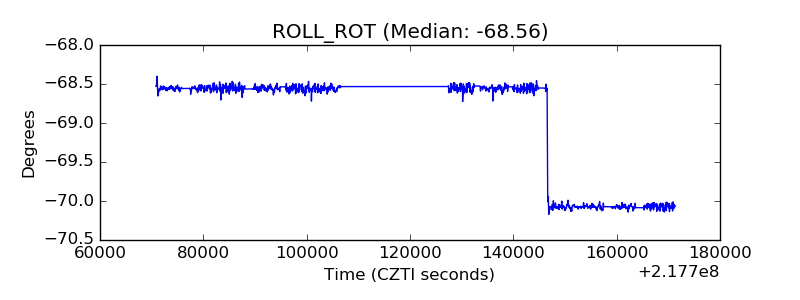 |
| _Roll_DEC | 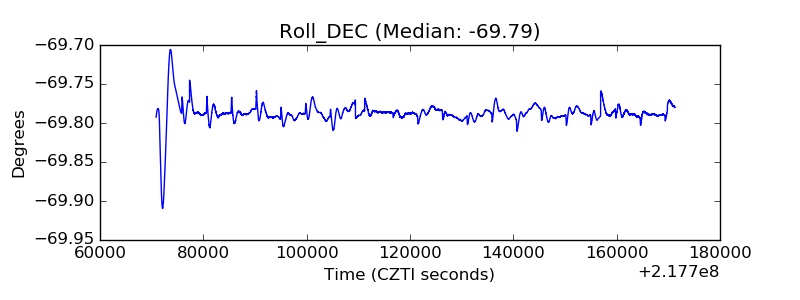 |
| _Roll_RA | 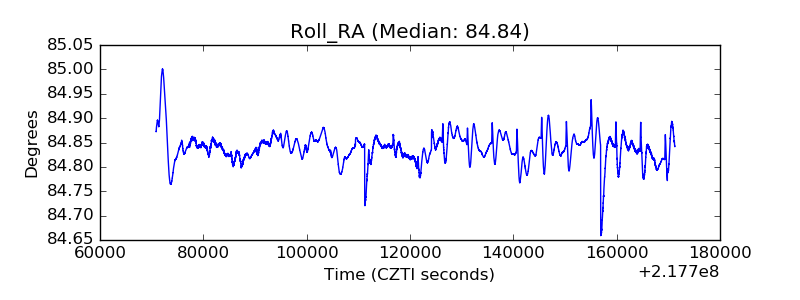 |
| Veto Counter | 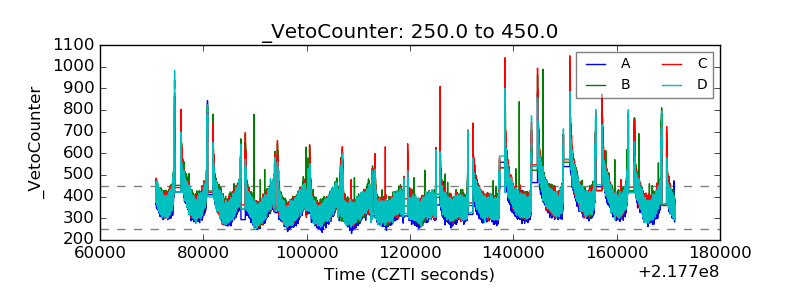 |