| Param | Original file | Final file |
|---|---|---|
| Filename | modeM0/AS1A02_118T01_9000000826_06281cztM0_level2.evt | modeM0/AS1A02_118T01_9000000826_06281cztM0_level2_quad_clean.evt |
| Size (bytes) | 16,626,240 | 3,882,240 |
| Size | 15.9 MB | 3.7 MB |
| Events in quadrant A | 146,320 | 23,348 |
| Events in quadrant B | 110,719 | 24,292 |
| Events in quadrant C | 82,999 | 24,274 |
| Events in quadrant D | 146,577 | 23,071 |
| Mode SS | |||
|---|---|---|---|
| Quadrant | BADHDUFLAG | Total packets | Discarded packets |
| A | 0 | 4 | 0 |
| B | 0 | 4 | 0 |
| C | 0 | 4 | 0 |
| D | 0 | 4 | 0 |
| Mode M0 | |||
|---|---|---|---|
| Quadrant | BADHDUFLAG | Total packets | Discarded packets |
| A | 0 | 592 | 1 |
| B | 0 | 456 | 0 |
| C | 0 | 386 | 0 |
| D | 0 | 573 | 0 |
| Quadrant | Total seconds | Saturated seconds | Saturation percentage |
|---|---|---|---|
| A | 193 | 1 | 0.518135% |
| B | 193 | 2 | 1.036269% |
| C | 193 | 0 | 0.000000% |
| D | 193 | 4 | 2.072539% |
Noise dominated data is calculated using 1-second bins in cleaned event files. If a bin has >2000 counts, and if more than 50% of those come from <1% of pixels, then it is considered to be noise-dominated and hence unusable.
| Quadrant | # 1 sec bins | Bins with >0 counts | Bins with >2000 counts | High rate bins dominated by noise | Noise dominated (total time) | Noise dominated (detector-on time) | Marked lightcurve |
|---|---|---|---|---|---|---|---|
| A | 193 | 193 | 0 | 0 | 0.00% | 0.00% |  |
| B | 193 | 193 | 0 | 0 | 0.00% | 0.00% | 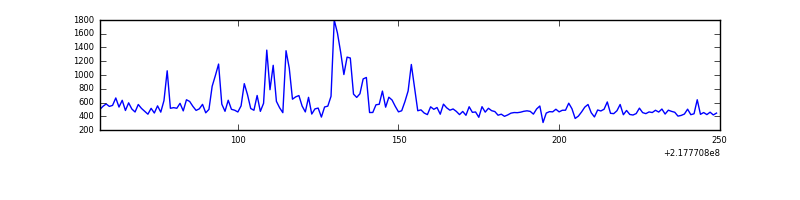 |
| C | 193 | 193 | 0 | 0 | 0.00% | 0.00% | 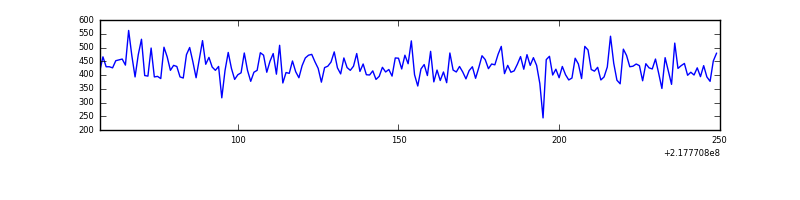 |
| D | 193 | 193 | 4 | 4 | 2.07% | 2.07% | 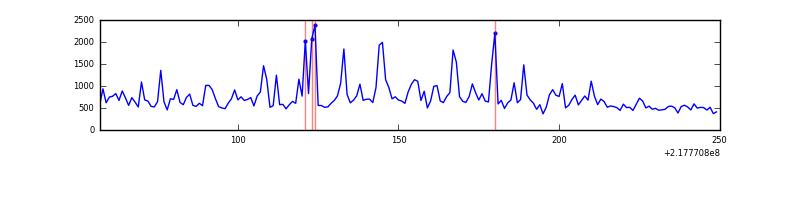 |
Top three noisy pixels from each quadrant. If the there are fewer than three noisy pixels in the level2.evt file, extra rows are filled as -1
| Pixel properties | Quadrant properties | ||||||
|---|---|---|---|---|---|---|---|
| Quadrant | DetID | PixID | Counts | Sigma | Mean | Median | Sigma |
| A | 8 | 15 | 59313 | 9079.75 | 22 | 21 | 6.5 |
| A | 13 | 251 | 1698 | 256.81 | 22 | 21 | 6.5 |
| A | 12 | 194 | 242 | 33.84 | 22 | 21 | 6.5 |
| B | 3 | 64 | 20000 | 3107.95 | 22 | 21 | 6.4 |
| B | 15 | 204 | 3093 | 477.88 | 22 | 21 | 6.4 |
| B | 0 | 219 | 359 | 52.58 | 22 | 21 | 6.4 |
| C | 13 | 61 | 180 | 23.89 | 21 | 21 | 6.7 |
| C | 1 | 16 | 93 | 10.82 | 21 | 21 | 6.7 |
| C | 3 | 202 | 58 | 5.56 | 21 | 21 | 6.7 |
| D | 2 | 152 | 33137 | 4769.43 | 21 | 20 | 6.9 |
| D | 2 | 63 | 19693 | 2833.26 | 21 | 20 | 6.9 |
| D | 12 | 220 | 7946 | 1141.48 | 21 | 20 | 6.9 |
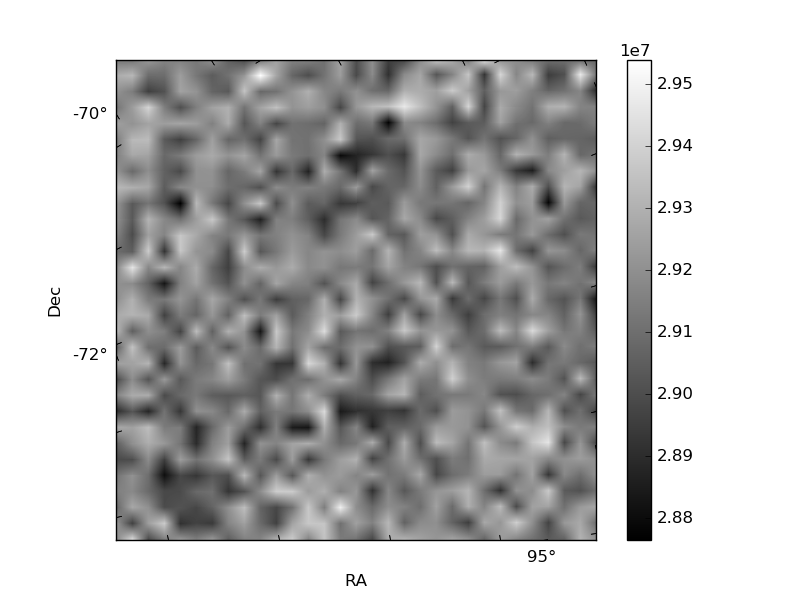
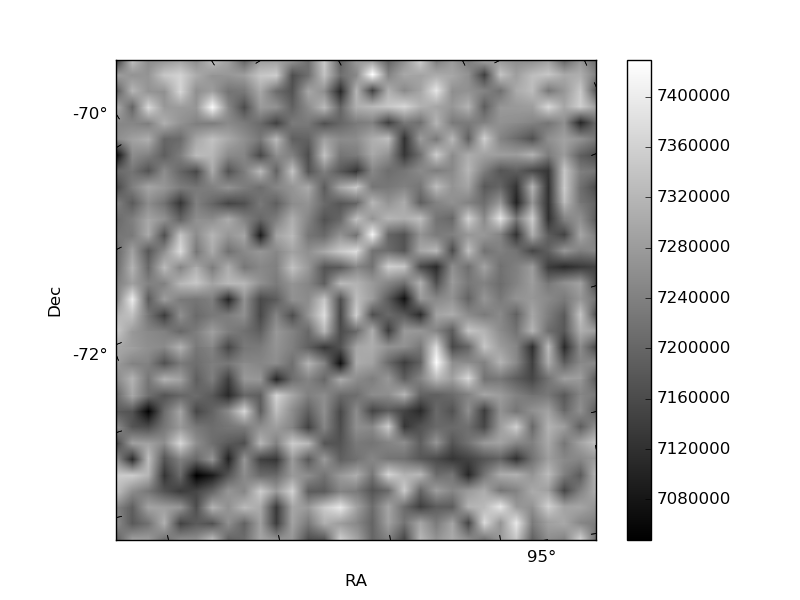
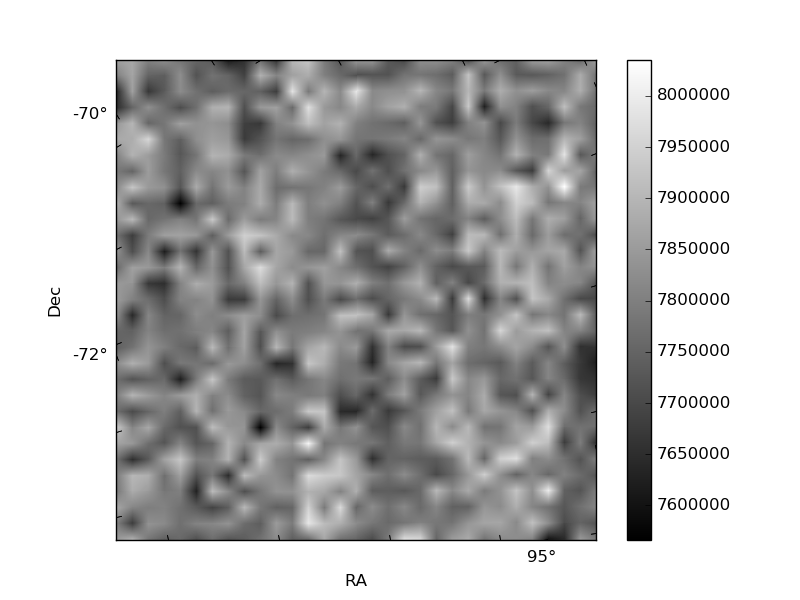
Histogram calculated using DETX and DETY for each event in the final _common_clean file
| Quadrant A | 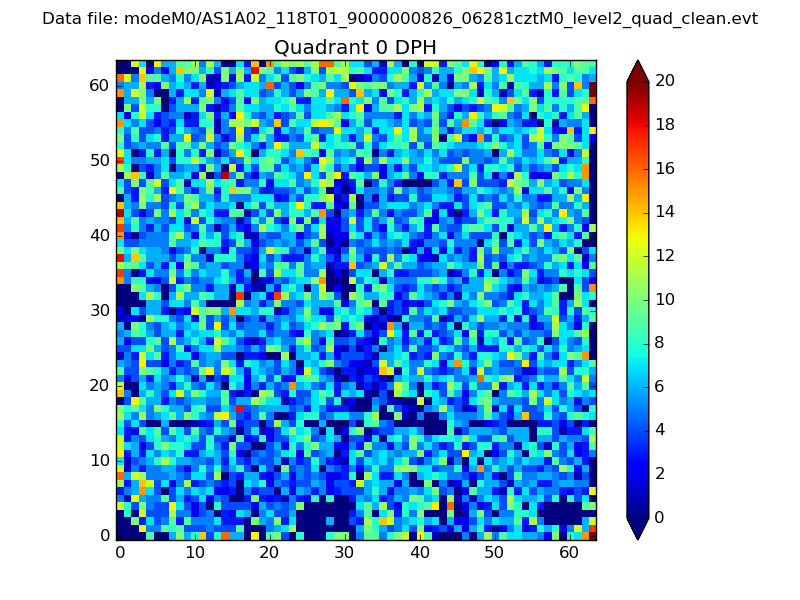 |
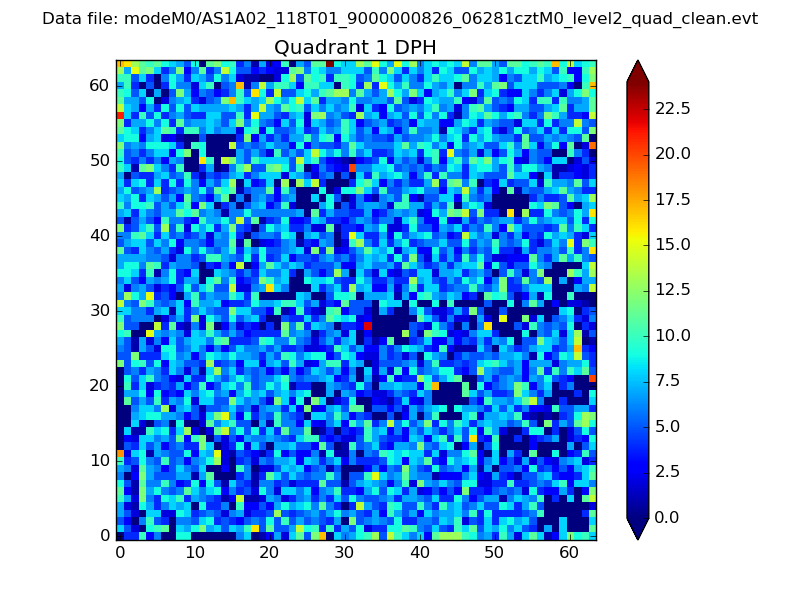 |
Quadrant B |
|---|---|---|---|
| Quadrant D | 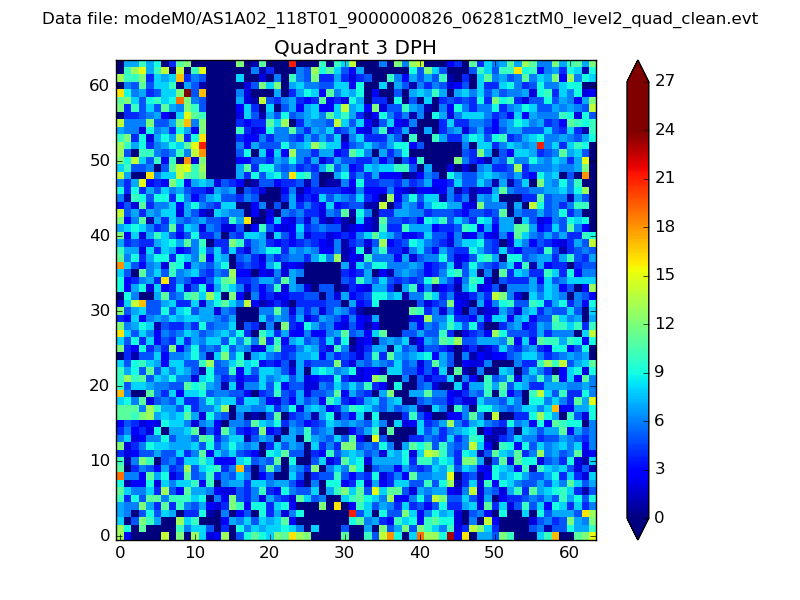 |
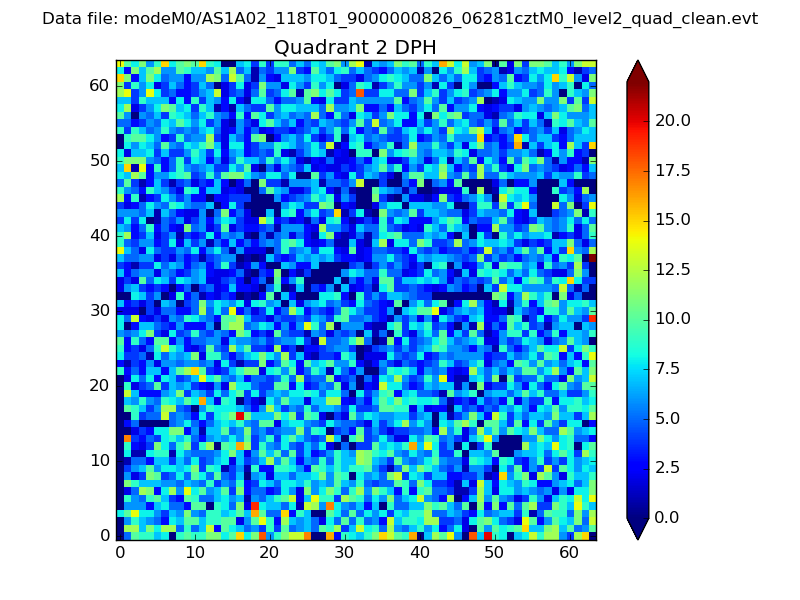 |
Quadrant C |
| Plot type | Count rate plots | Images |
|---|---|---|
| Comparison with Poisson distribution Blue bars denote a histogram of data divided into 1 sec bins. Red curve is a Poisson curve with rate = median count rate of data. |
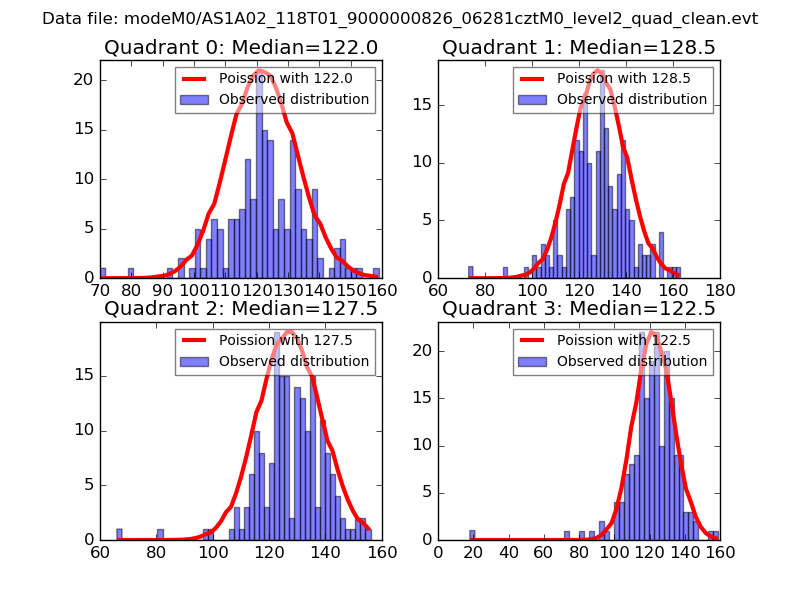 |
 |
| Quadrant-wise count rates Data is divided into 100 sec bins |
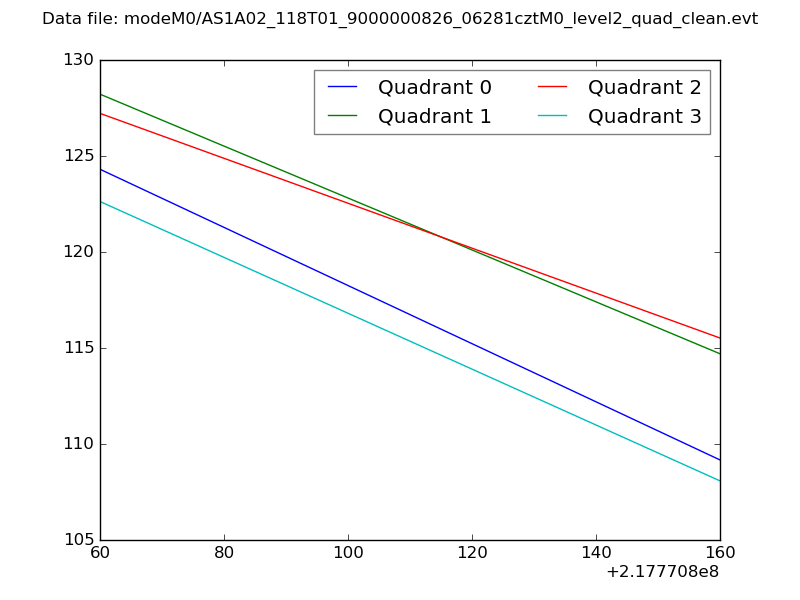 |
|
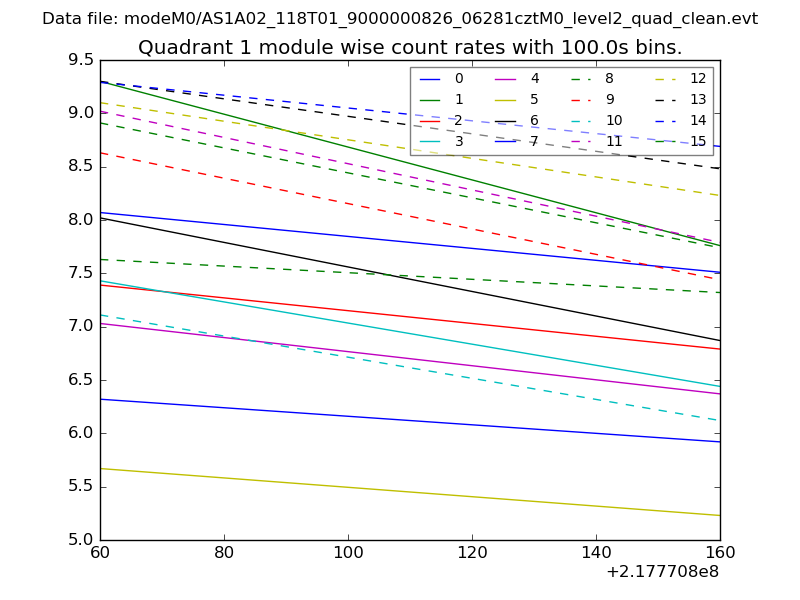
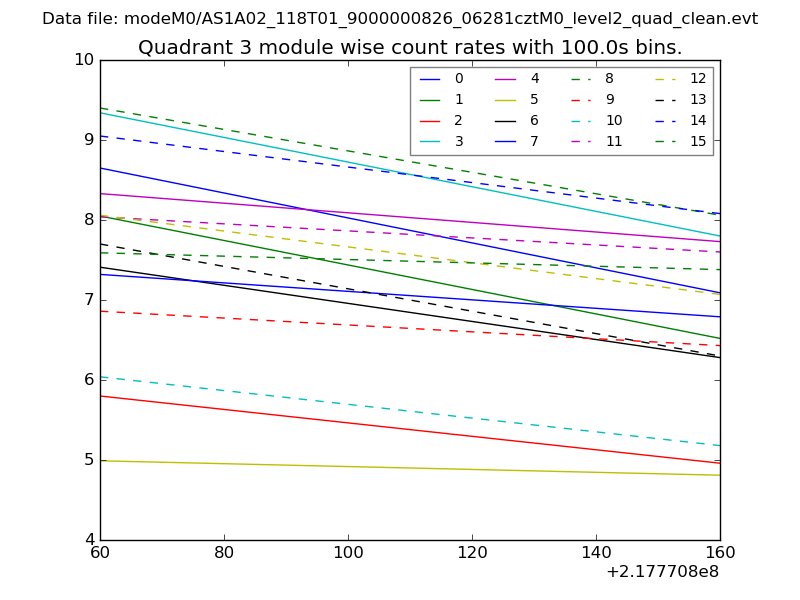
| Module-wise count rates for Quadrant A Data is divided into 100 sec bins |
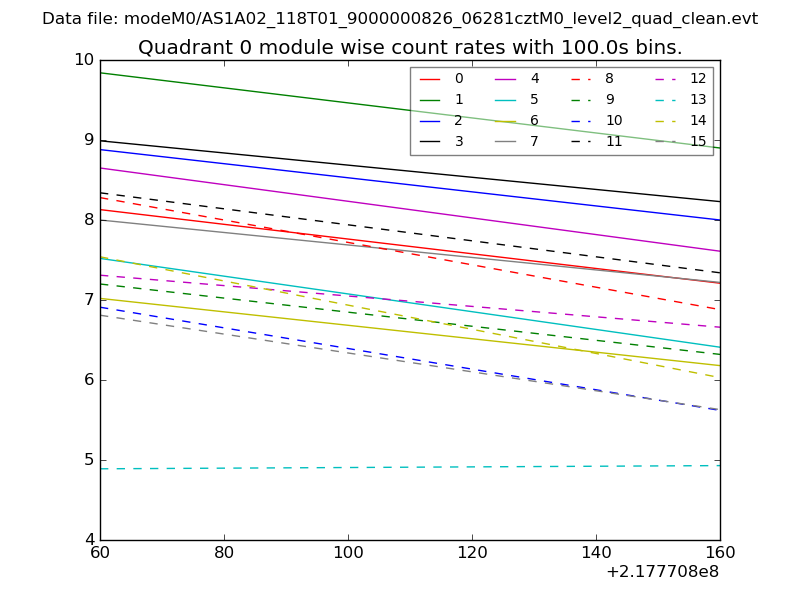 |
 |
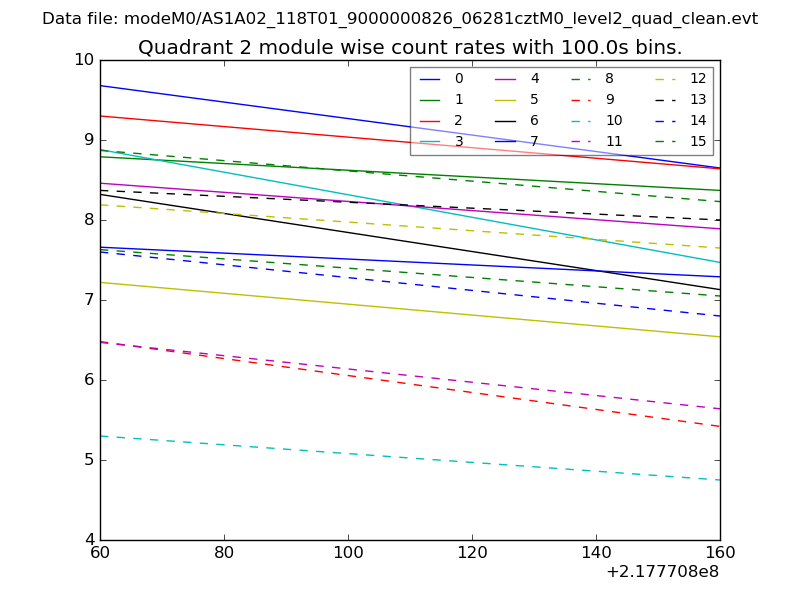
| Module-wise count rates for Quadrant B Data is divided into 100 sec bins |
 |
 |
| Module-wise count rates for Quadrant C Data is divided into 100 sec bins |
 |
 |
| Module-wise count rates for Quadrant D Data is divided into 100 sec bins |
 |
 |
| Parameter | Plot |
|---|---|
| CZT HV Monitor | 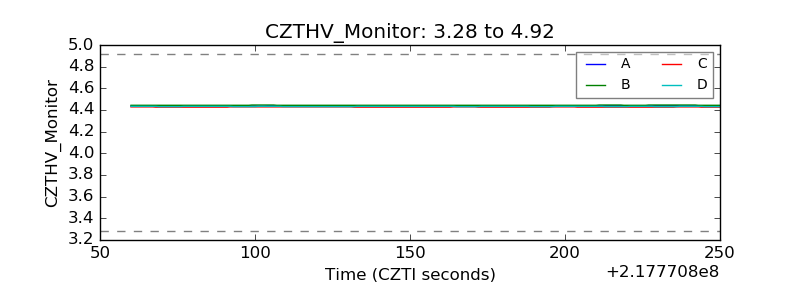 |
| D_VDD | 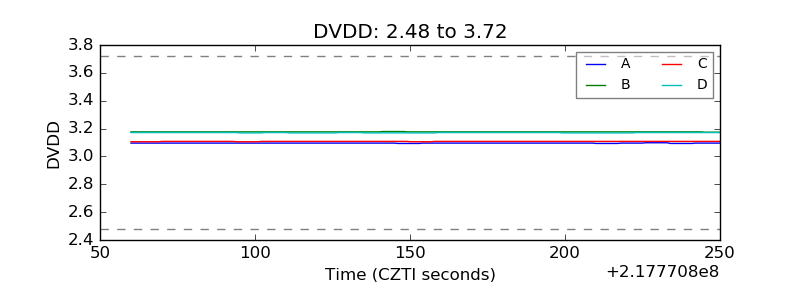 |
| Temperature 1 | 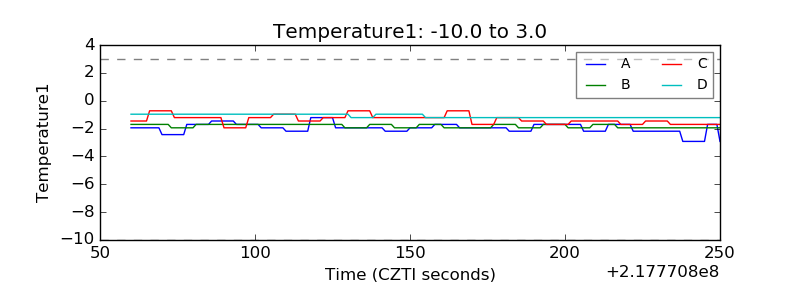 |
| Veto HV Monitor | 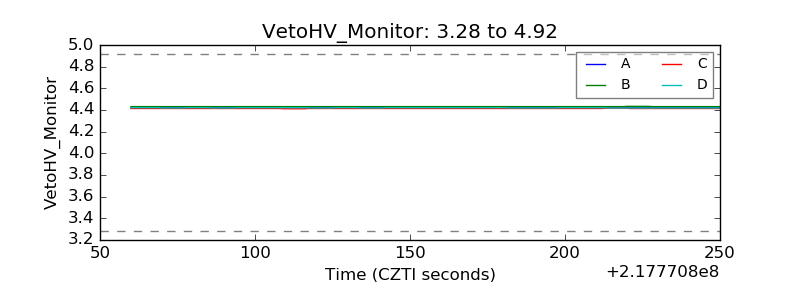 |
| Veto LLD | 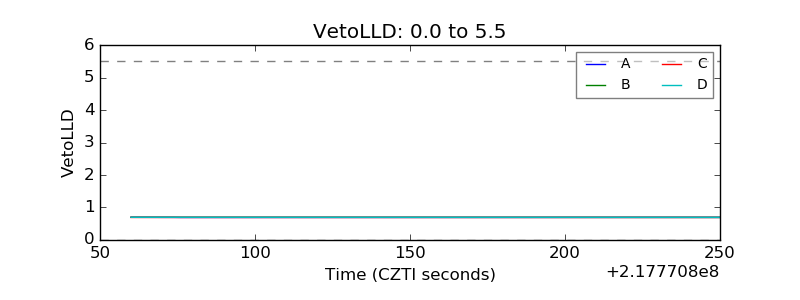 |
| Alpha Counter | 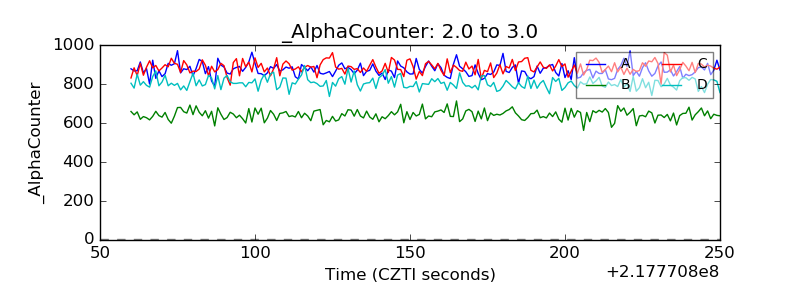 |
| _CPM_Rate | 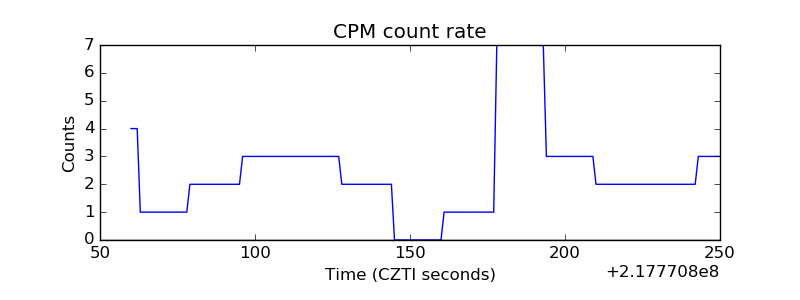 |
| CZT Counter | 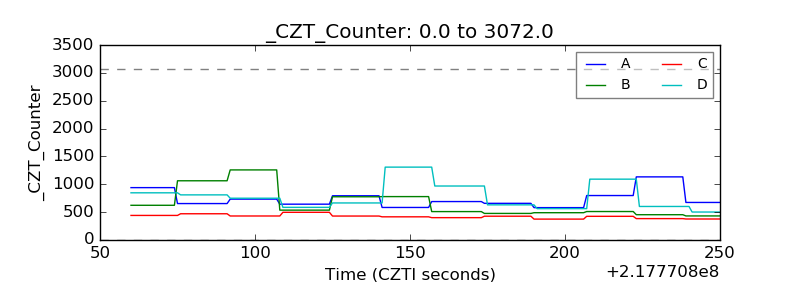 |
| +2.5 Volts monitor | 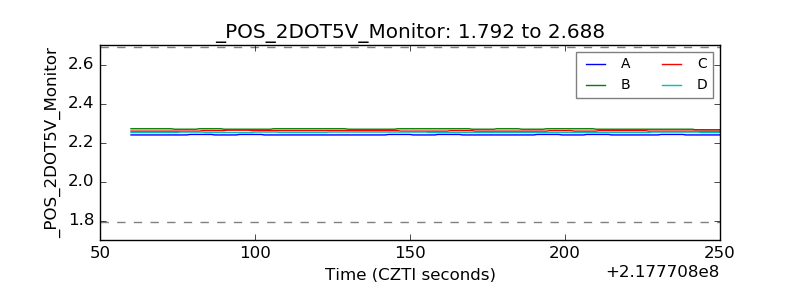 |
| +5 Volts monitor |  |
| _ROLL_ROT |  |
| _Roll_DEC |  |
| _Roll_RA | 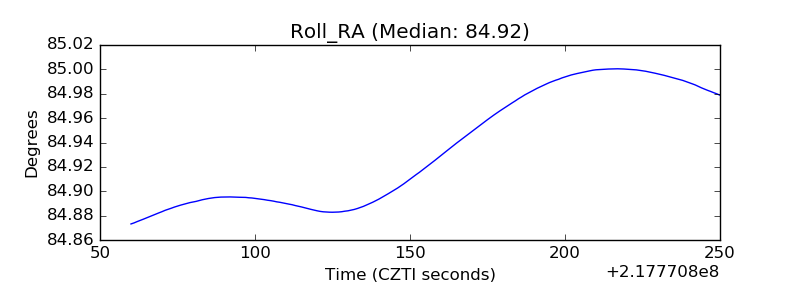 |
| Veto Counter | 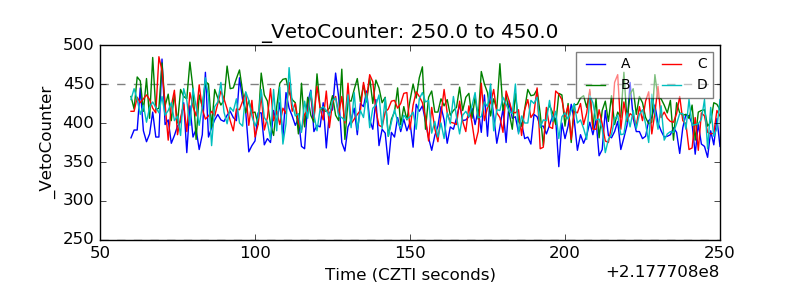 |