| Param | Original file | Final file |
|---|---|---|
| Filename | modeM0/AS1A02_118T01_9000000826_06283cztM0_level2.evt | modeM0/AS1A02_118T01_9000000826_06283cztM0_level2_quad_clean.evt |
| Size (bytes) | 540,120,960 | 95,538,240 |
| Size | 515.1 MB | 91.1 MB |
| Events in quadrant A | 3,686,513 | 623,956 |
| Events in quadrant B | 3,816,464 | 618,908 |
| Events in quadrant C | 2,898,807 | 619,066 |
| Events in quadrant D | 5,513,481 | 576,269 |
| Mode M9 | |||
|---|---|---|---|
| Quadrant | BADHDUFLAG | Total packets | Discarded packets |
| A | 0 | 10 | 0 |
| B | 0 | 10 | 0 |
| C | 0 | 10 | 0 |
| D | 0 | 10 | 0 |
| Mode SS | |||
|---|---|---|---|
| Quadrant | BADHDUFLAG | Total packets | Discarded packets |
| A | 0 | 134 | 0 |
| B | 0 | 134 | 0 |
| C | 0 | 134 | 0 |
| D | 0 | 134 | 0 |
| Mode M0 | |||
|---|---|---|---|
| Quadrant | BADHDUFLAG | Total packets | Discarded packets |
| A | 0 | 15085 | 2 |
| B | 0 | 15636 | 1 |
| C | 0 | 13350 | 1 |
| D | 0 | 20945 | 1 |
| Quadrant | Total seconds | Saturated seconds | Saturation percentage |
|---|---|---|---|
| A | 6516 | 167 | 2.562922% |
| B | 6516 | 276 | 4.235727% |
| C | 6516 | 97 | 1.488643% |
| D | 6516 | 542 | 8.317986% |
Noise dominated data is calculated using 1-second bins in cleaned event files. If a bin has >2000 counts, and if more than 50% of those come from <1% of pixels, then it is considered to be noise-dominated and hence unusable.
| Quadrant | # 1 sec bins | Bins with >0 counts | Bins with >2000 counts | High rate bins dominated by noise | Noise dominated (total time) | Noise dominated (detector-on time) | Marked lightcurve |
|---|---|---|---|---|---|---|---|
| A | 7591 | 6516 | 5 | 5 | 0.07% | 0.08% |  |
| B | 7591 | 6516 | 105 | 105 | 1.38% | 1.61% | 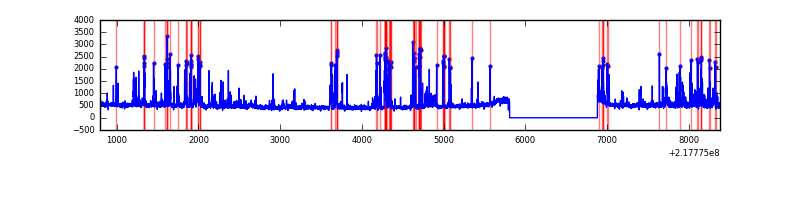 |
| C | 7591 | 6516 | 2 | 2 | 0.03% | 0.03% | 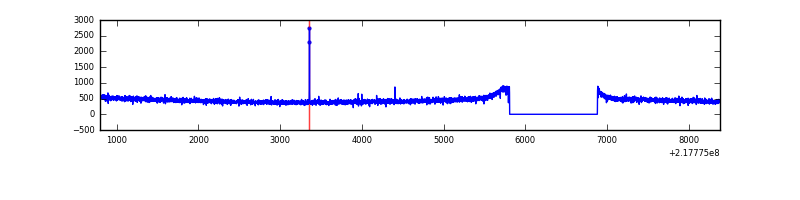 |
| D | 7591 | 6516 | 420 | 420 | 5.53% | 6.45% | 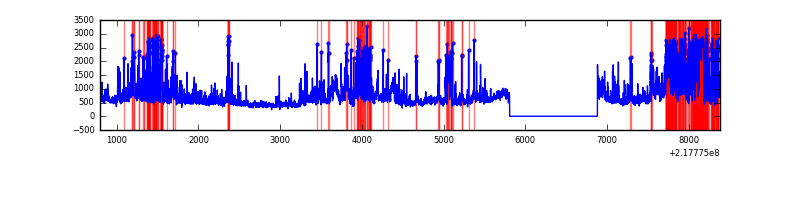 |
Top three noisy pixels from each quadrant. If the there are fewer than three noisy pixels in the level2.evt file, extra rows are filled as -1
| Pixel properties | Quadrant properties | ||||||
|---|---|---|---|---|---|---|---|
| Quadrant | DetID | PixID | Counts | Sigma | Mean | Median | Sigma |
| A | 8 | 15 | 624090 | 4048.49 | 764 | 748 | 154.0 |
| A | 15 | 174 | 87504 | 563.46 | 764 | 748 | 154.0 |
| A | 13 | 251 | 27023 | 170.65 | 764 | 748 | 154.0 |
| B | 0 | 219 | 384472 | 2677.09 | 761 | 744 | 143.3 |
| B | 3 | 64 | 368960 | 2568.87 | 761 | 744 | 143.3 |
| B | 15 | 204 | 49794 | 342.2 | 761 | 744 | 143.3 |
| C | 9 | 54 | 10132 | 55.59 | 739 | 742 | 168.9 |
| C | 13 | 61 | 6051 | 31.43 | 739 | 742 | 168.9 |
| C | 1 | 16 | 3462 | 16.1 | 739 | 742 | 168.9 |
| D | 12 | 220 | 1790458 | 10249.46 | 722 | 700 | 174.6 |
| D | 12 | 227 | 310215 | 1772.51 | 722 | 700 | 174.6 |
| D | 12 | 110 | 232224 | 1325.88 | 722 | 700 | 174.6 |
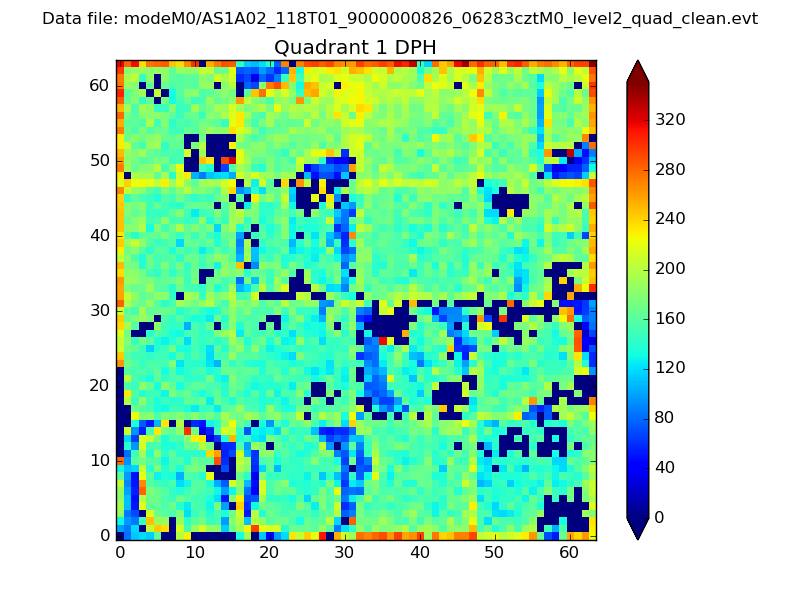
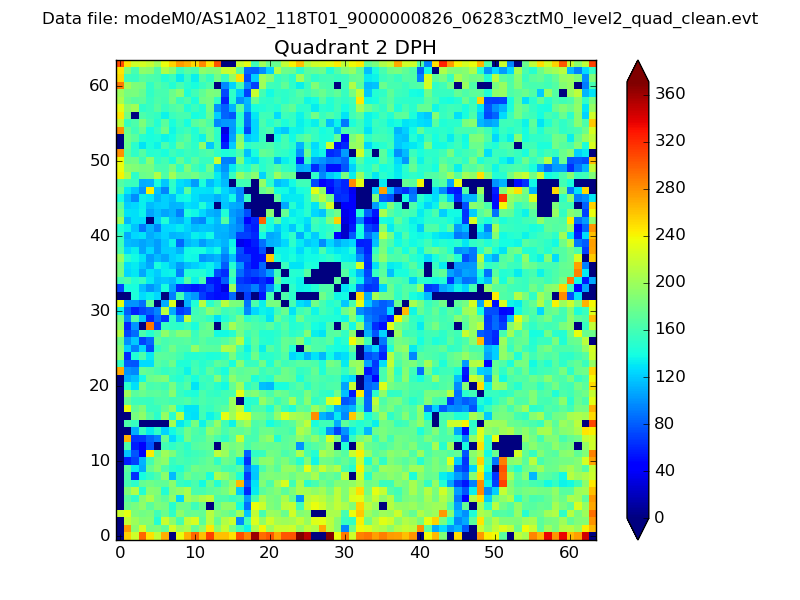
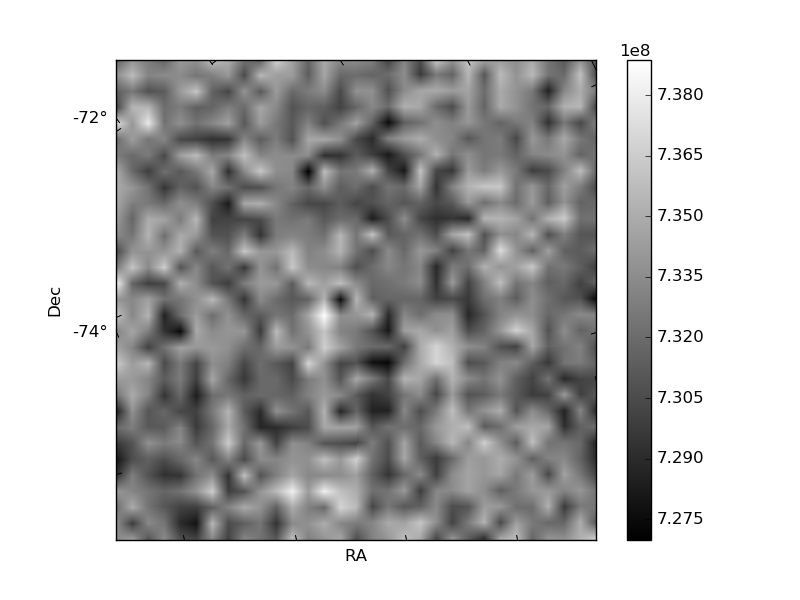
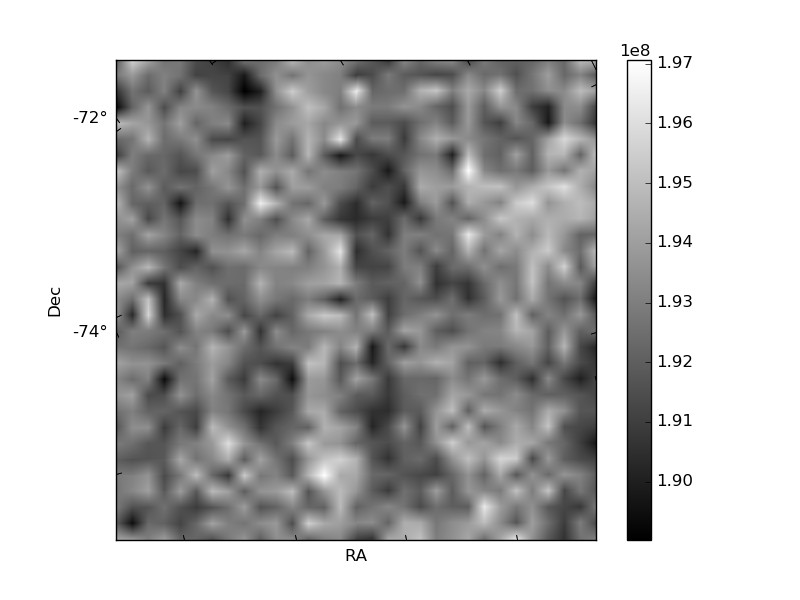
Histogram calculated using DETX and DETY for each event in the final _common_clean file
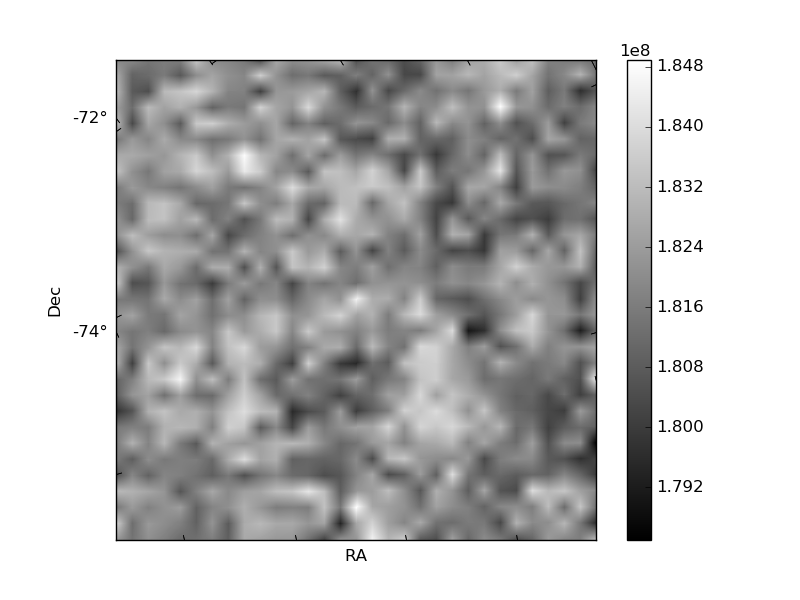
| Quadrant A | 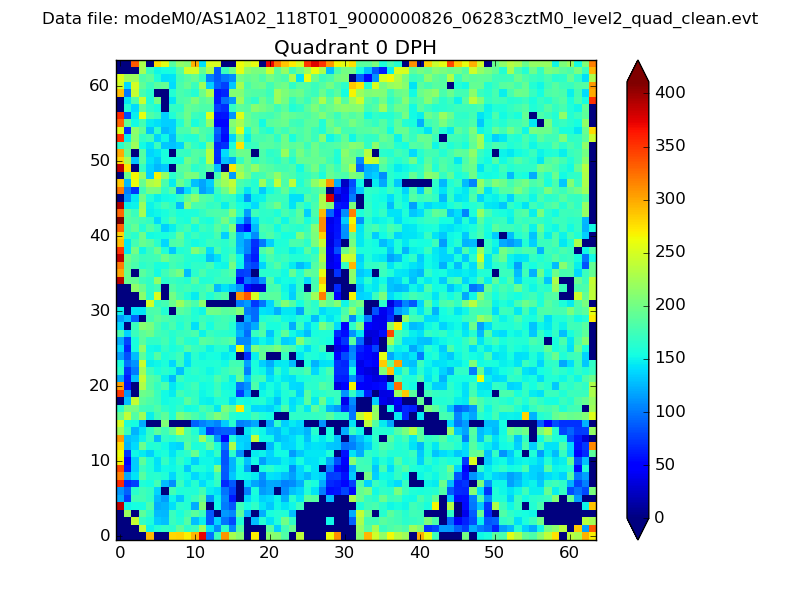 |
 |
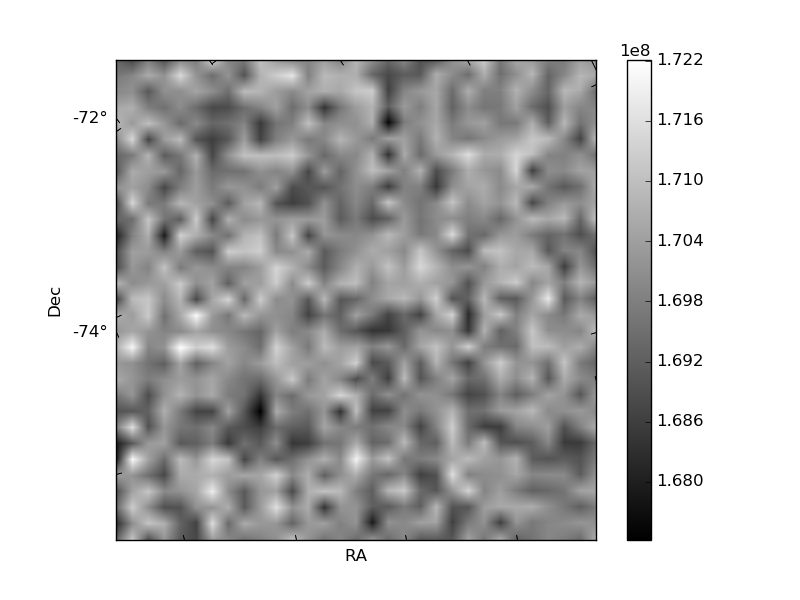
Quadrant B |
|---|---|---|---|
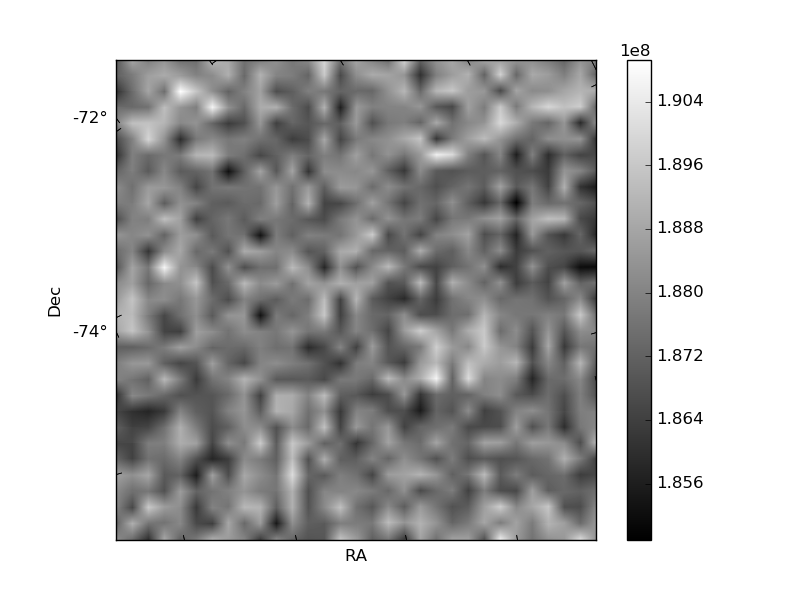
| Quadrant D | 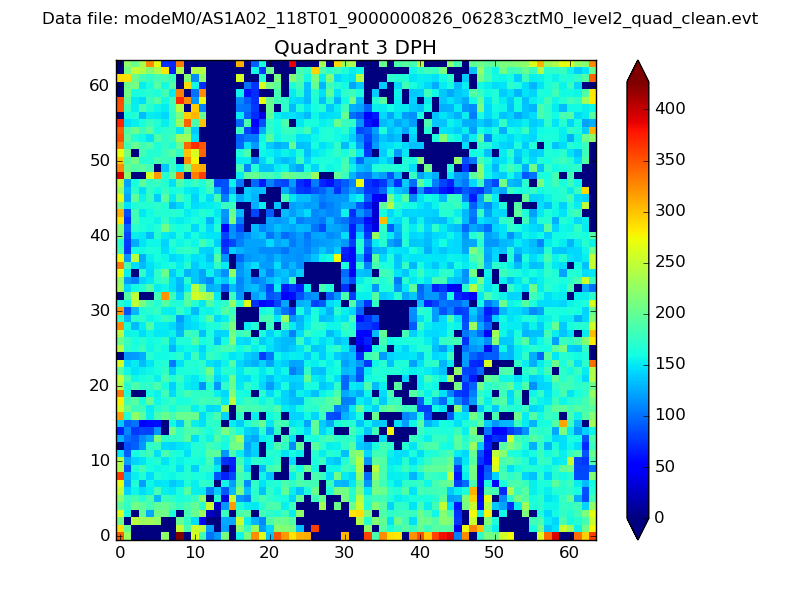 |
 |
Quadrant C |
| Plot type | Count rate plots | Images |
|---|---|---|
| Comparison with Poisson distribution Blue bars denote a histogram of data divided into 1 sec bins. Red curve is a Poisson curve with rate = median count rate of data. |
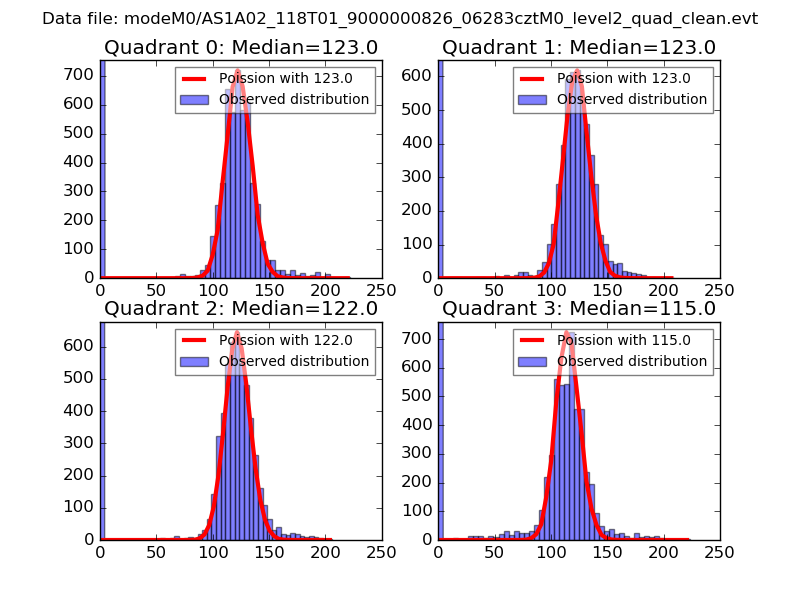 |
 |
| Quadrant-wise count rates Data is divided into 100 sec bins |
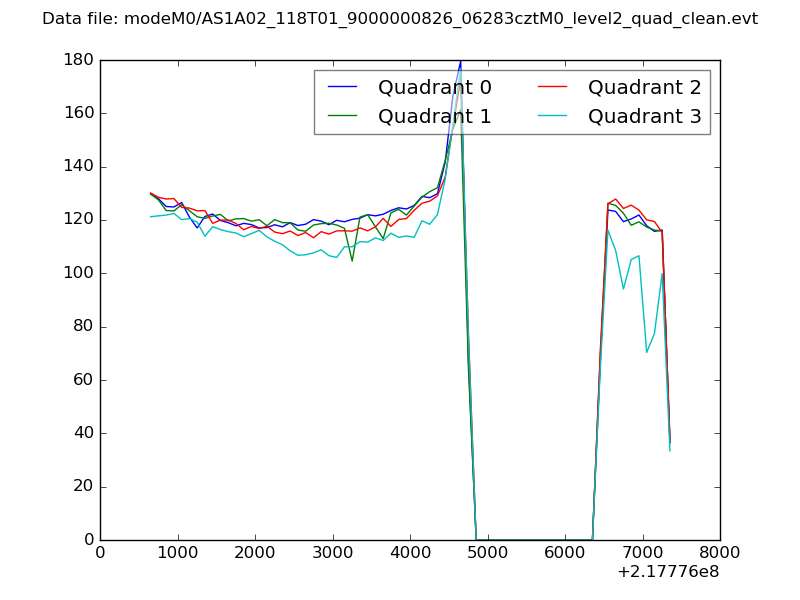 |
|
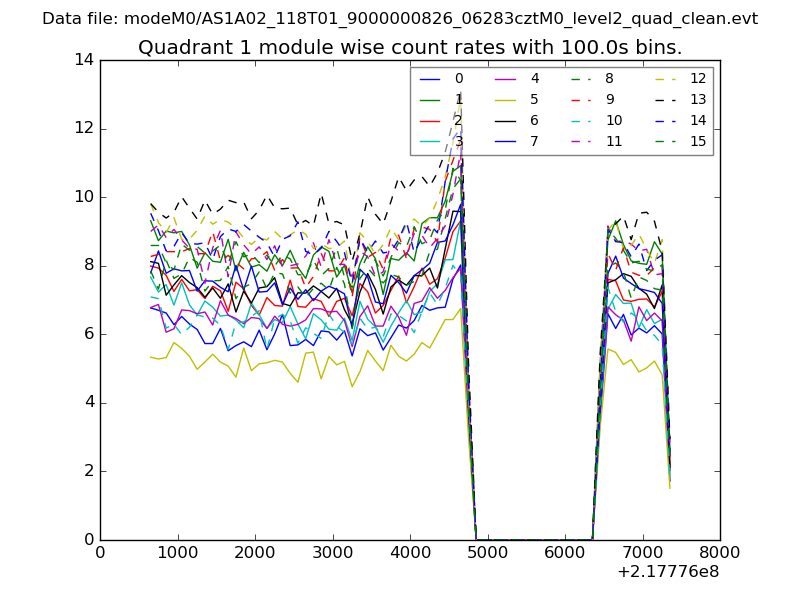
| Module-wise count rates for Quadrant A Data is divided into 100 sec bins |
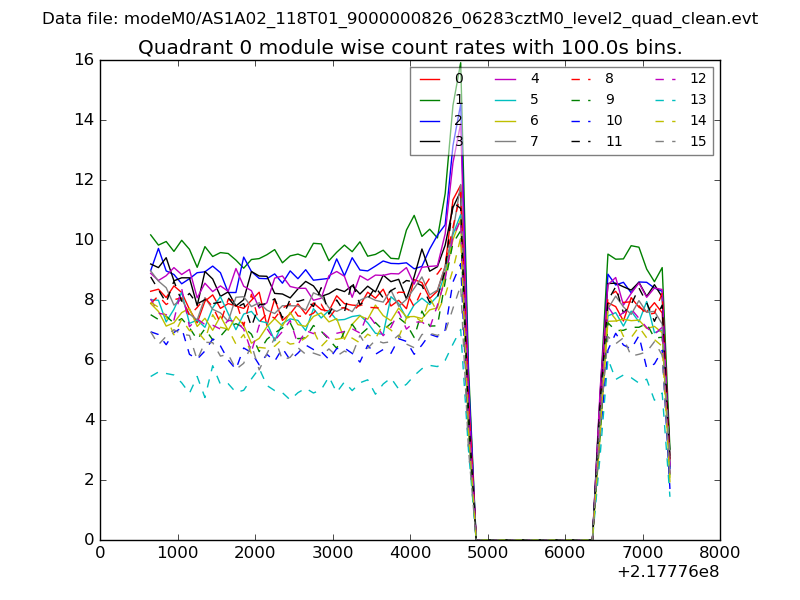 |
 |
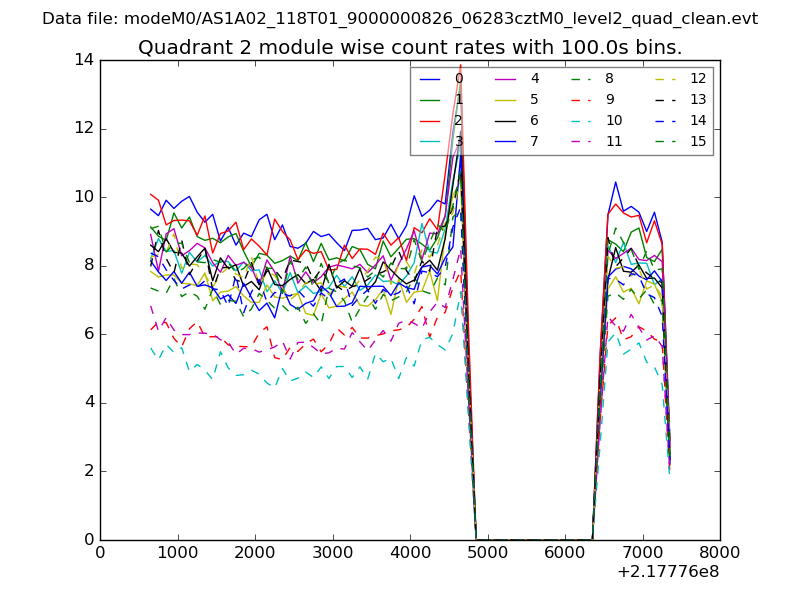
| Module-wise count rates for Quadrant B Data is divided into 100 sec bins |
 |
 |
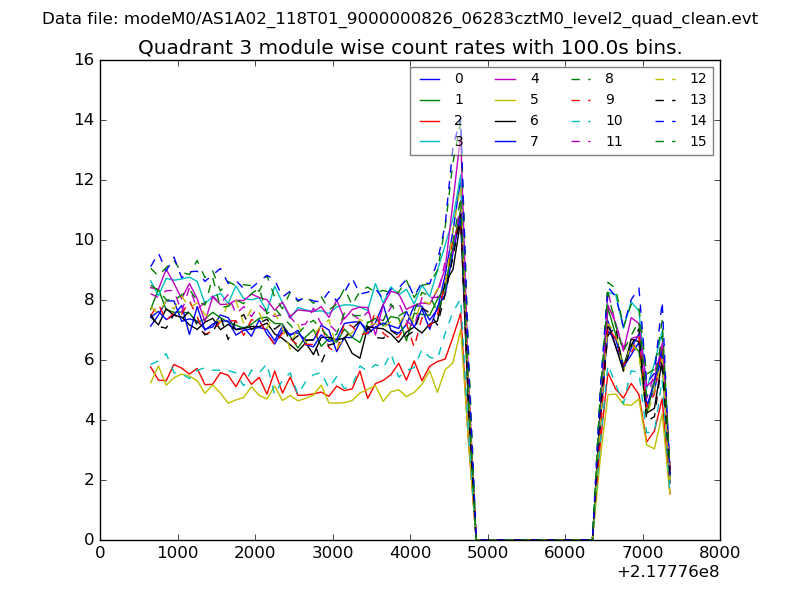
| Module-wise count rates for Quadrant C Data is divided into 100 sec bins |
 |
 |
| Module-wise count rates for Quadrant D Data is divided into 100 sec bins |
 |
 |
| Parameter | Plot |
|---|---|
| CZT HV Monitor | 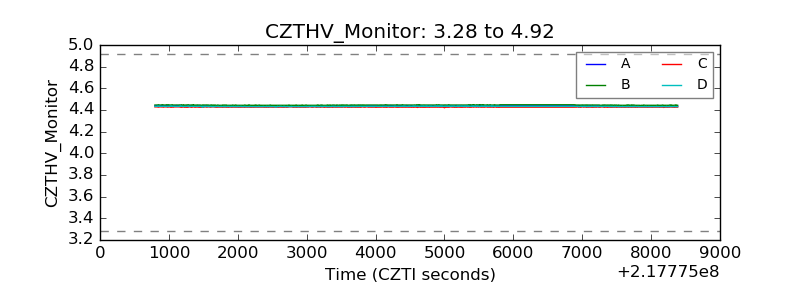 |
| D_VDD | 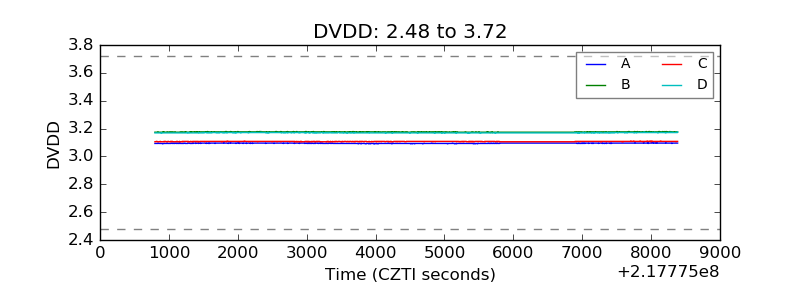 |
| Temperature 1 | 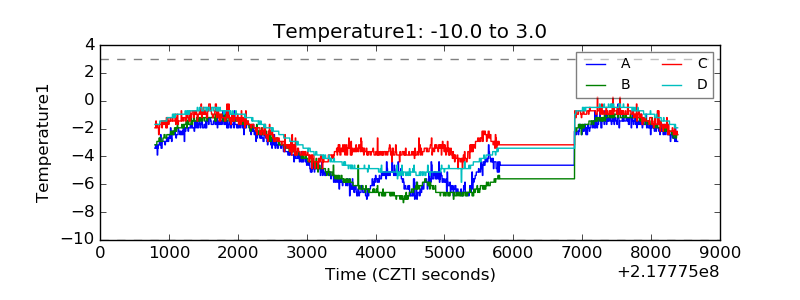 |
| Veto HV Monitor | 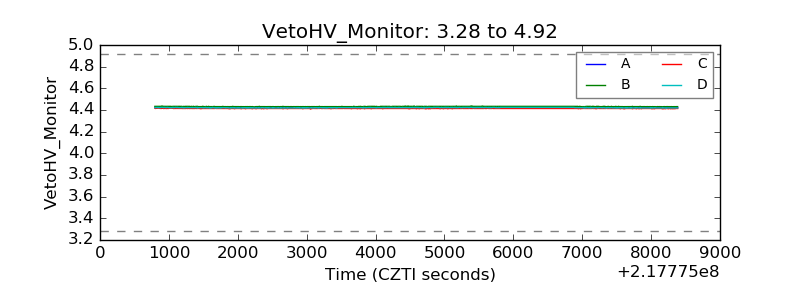 |
| Veto LLD | 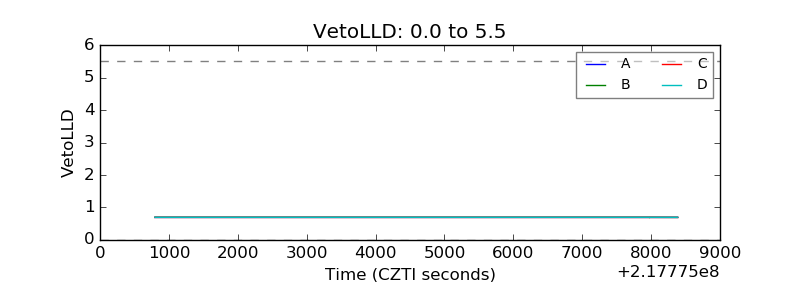 |
| Alpha Counter | 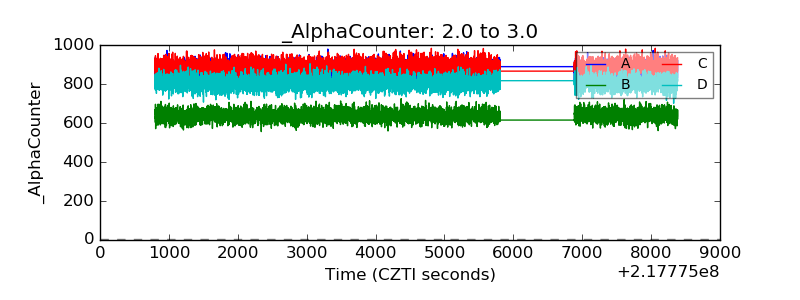 |
| _CPM_Rate | 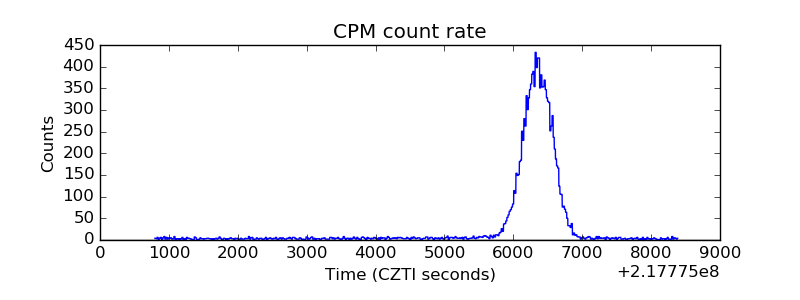 |
| CZT Counter | 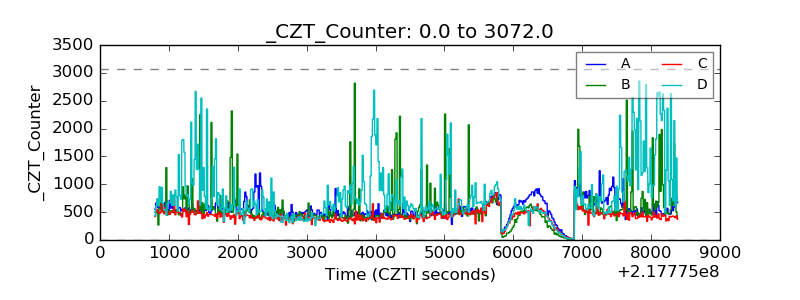 |
| +2.5 Volts monitor |  |
| +5 Volts monitor |  |
| _ROLL_ROT | 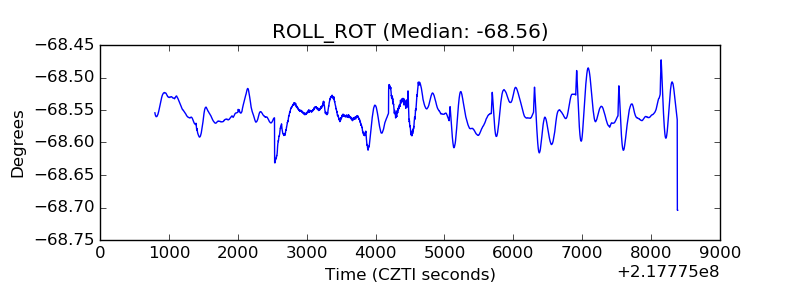 |
| _Roll_DEC | 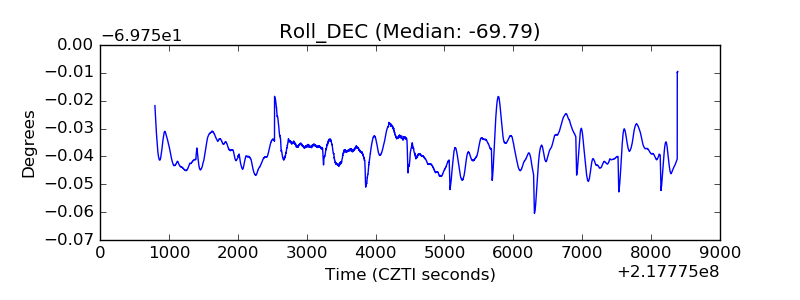 |
| _Roll_RA | 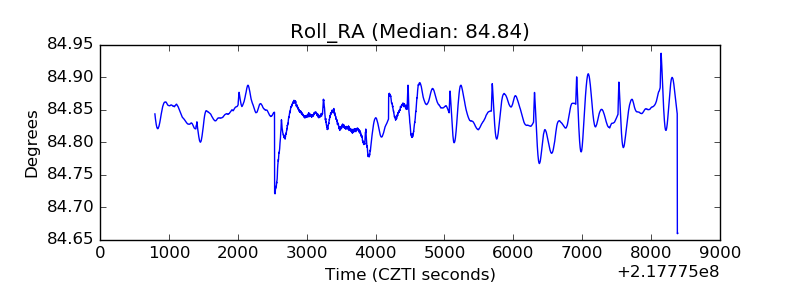 |
| Veto Counter | 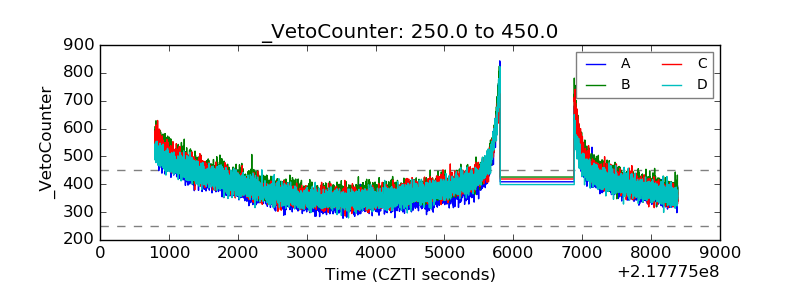 |