| Param | Original file | Final file |
|---|---|---|
| Filename | modeM0/AS1A02_118T01_9000000826_06284cztM0_level2.evt | modeM0/AS1A02_118T01_9000000826_06284cztM0_level2_quad_clean.evt |
| Size (bytes) | 569,980,800 | 108,063,360 |
| Size | 543.6 MB | 103.1 MB |
| Events in quadrant A | 4,027,793 | 714,233 |
| Events in quadrant B | 4,268,139 | 712,132 |
| Events in quadrant C | 2,896,835 | 716,312 |
| Events in quadrant D | 5,612,933 | 660,572 |
| Mode M9 | |||
|---|---|---|---|
| Quadrant | BADHDUFLAG | Total packets | Discarded packets |
| A | 0 | 9 | 0 |
| B | 0 | 9 | 0 |
| C | 0 | 9 | 0 |
| D | 0 | 9 | 0 |
| Mode SS | |||
|---|---|---|---|
| Quadrant | BADHDUFLAG | Total packets | Discarded packets |
| A | 0 | 136 | 0 |
| B | 0 | 136 | 0 |
| C | 0 | 136 | 0 |
| D | 0 | 136 | 0 |
| Mode M0 | |||
|---|---|---|---|
| Quadrant | BADHDUFLAG | Total packets | Discarded packets |
| A | 0 | 16347 | 2 |
| B | 0 | 17188 | 1 |
| C | 0 | 13680 | 1 |
| D | 0 | 21233 | 1 |
| Quadrant | Total seconds | Saturated seconds | Saturation percentage |
|---|---|---|---|
| A | 6735 | 102 | 1.514477% |
| B | 6735 | 360 | 5.345212% |
| C | 6735 | 20 | 0.296956% |
| D | 6735 | 558 | 8.285078% |
Noise dominated data is calculated using 1-second bins in cleaned event files. If a bin has >2000 counts, and if more than 50% of those come from <1% of pixels, then it is considered to be noise-dominated and hence unusable.
| Quadrant | # 1 sec bins | Bins with >0 counts | Bins with >2000 counts | High rate bins dominated by noise | Noise dominated (total time) | Noise dominated (detector-on time) | Marked lightcurve |
|---|---|---|---|---|---|---|---|
| A | 7600 | 6735 | 1 | 1 | 0.01% | 0.01% |  |
| B | 7600 | 6735 | 217 | 217 | 2.86% | 3.22% | 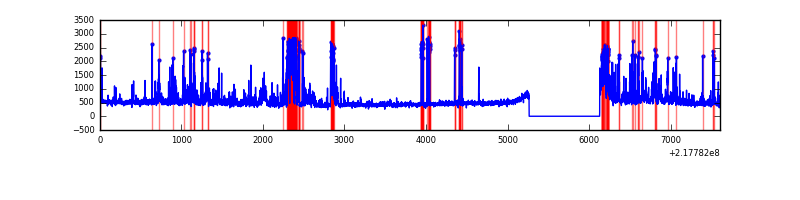 |
| C | 7600 | 6735 | 0 | 0 | 0.00% | 0.00% | 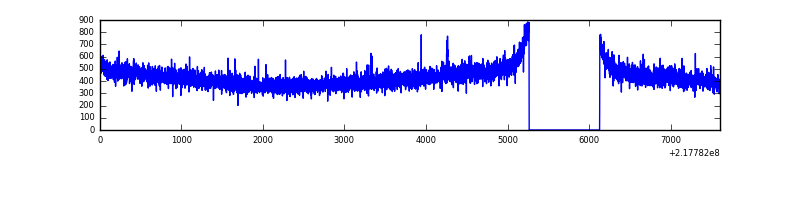 |
| D | 7600 | 6735 | 585 | 585 | 7.70% | 8.69% | 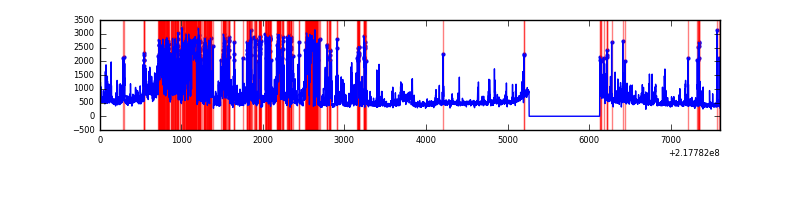 |
Top three noisy pixels from each quadrant. If the there are fewer than three noisy pixels in the level2.evt file, extra rows are filled as -1
| Pixel properties | Quadrant properties | ||||||
|---|---|---|---|---|---|---|---|
| Quadrant | DetID | PixID | Counts | Sigma | Mean | Median | Sigma |
| A | 8 | 15 | 924371 | 5938.38 | 763 | 746 | 155.5 |
| A | 15 | 236 | 109961 | 702.19 | 763 | 746 | 155.5 |
| A | 15 | 174 | 26639 | 166.48 | 763 | 746 | 155.5 |
| B | 3 | 64 | 777533 | 5424.43 | 756 | 737 | 143.2 |
| B | 0 | 219 | 334904 | 2333.51 | 756 | 737 | 143.2 |
| B | 15 | 204 | 99590 | 690.3 | 756 | 737 | 143.2 |
| C | 1 | 16 | 8358 | 44.79 | 738 | 739 | 170.1 |
| C | 9 | 54 | 7435 | 39.37 | 738 | 739 | 170.1 |
| C | 13 | 61 | 5941 | 30.58 | 738 | 739 | 170.1 |
| D | 12 | 220 | 2255429 | 12880.76 | 718 | 696 | 175.0 |
| D | 12 | 110 | 229272 | 1305.8 | 718 | 696 | 175.0 |
| D | 2 | 152 | 149585 | 850.57 | 718 | 696 | 175.0 |
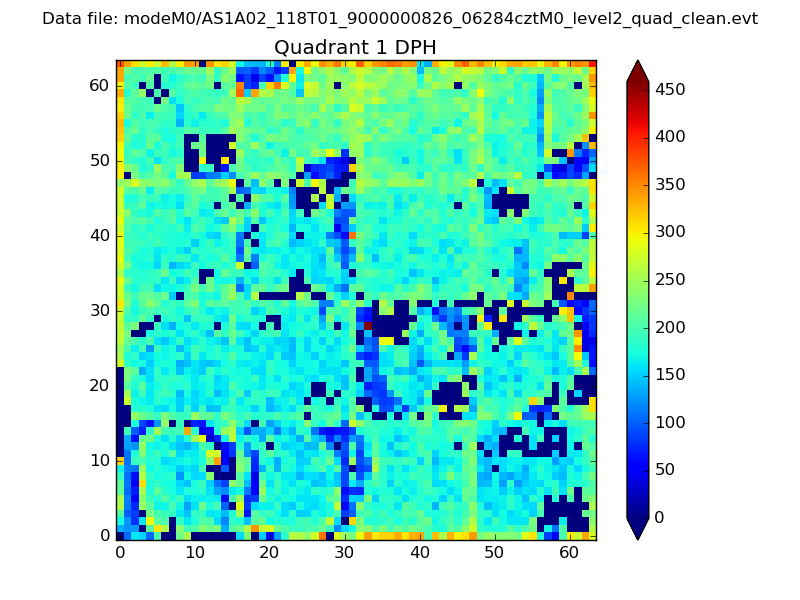
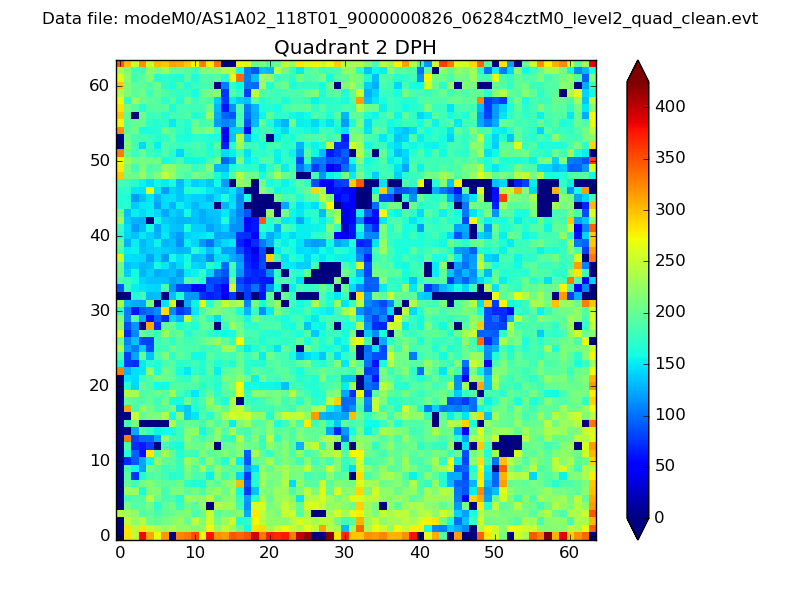
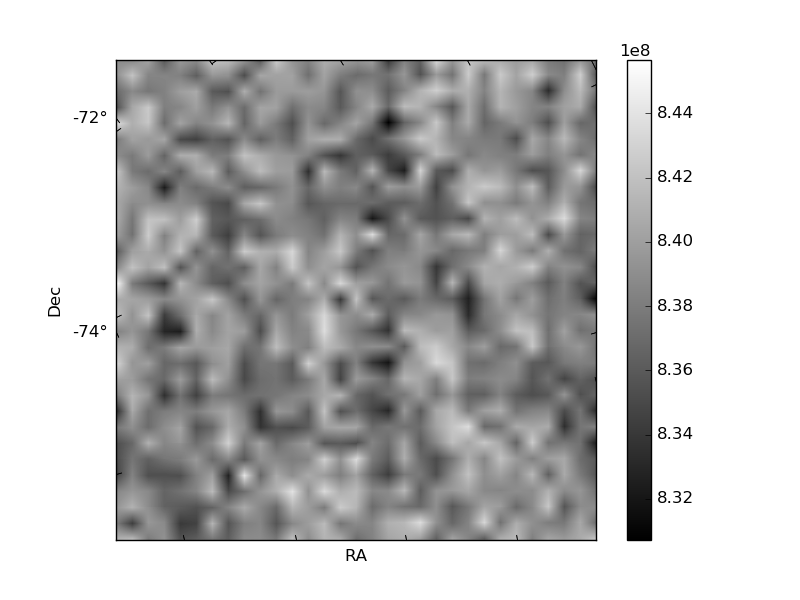
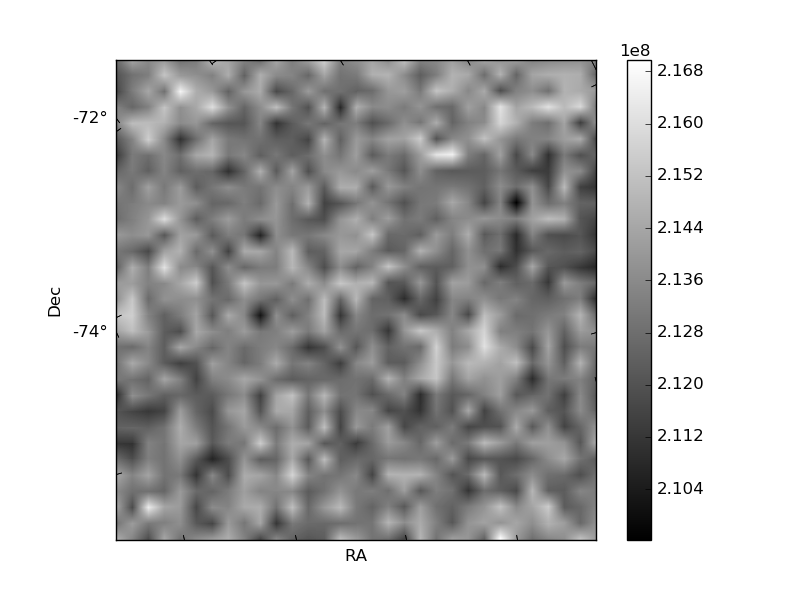
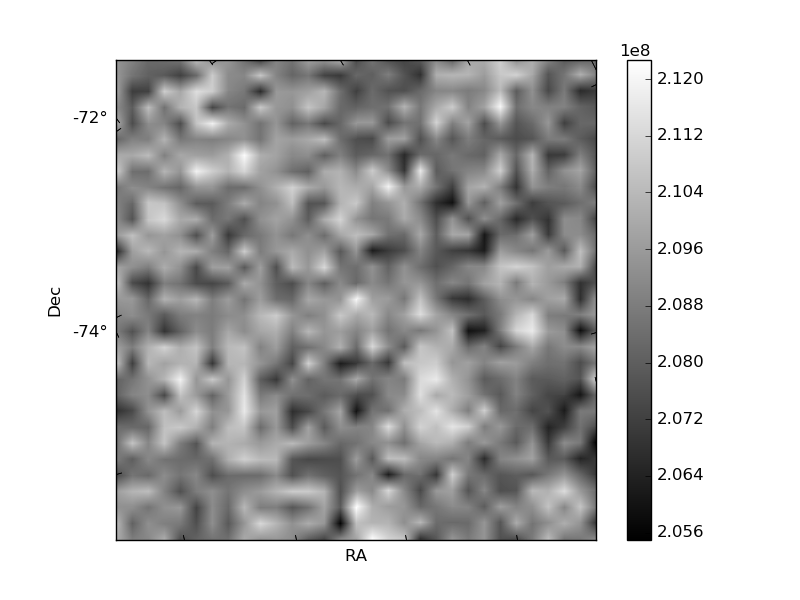
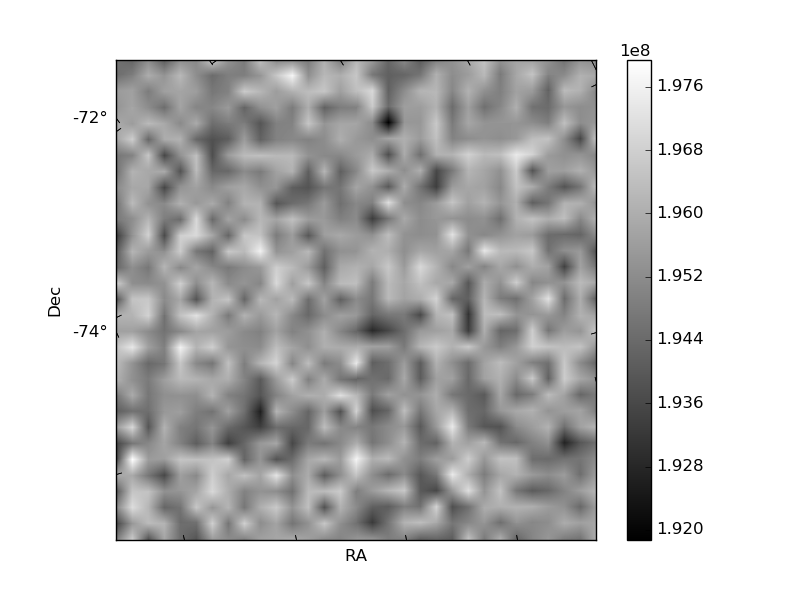
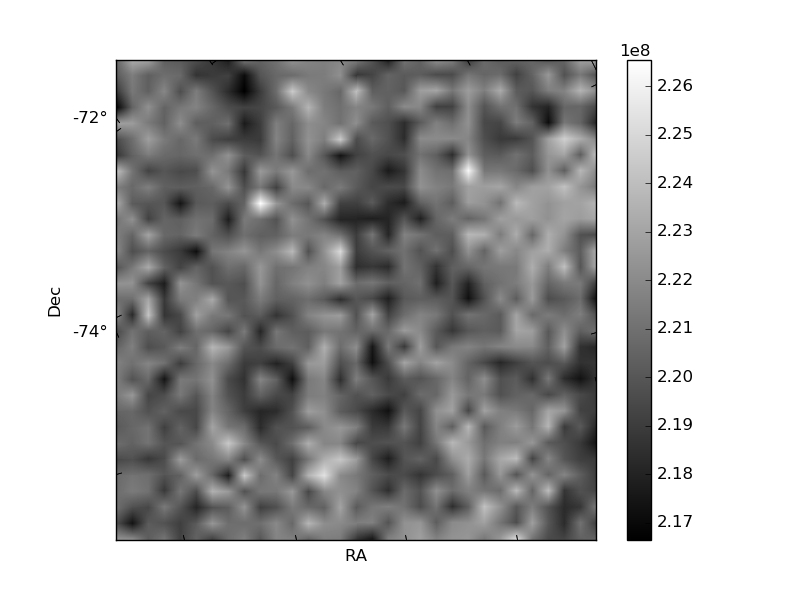
Histogram calculated using DETX and DETY for each event in the final _common_clean file
| Quadrant A | 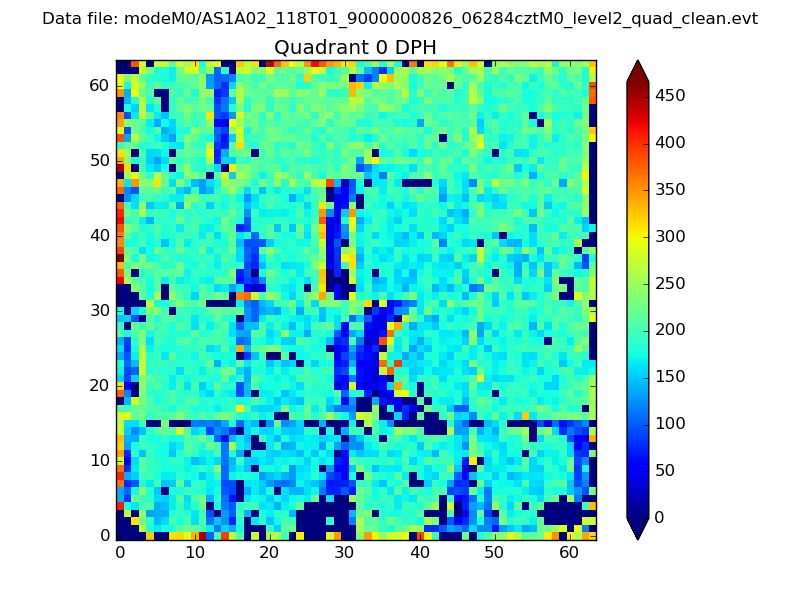 |
 |
Quadrant B |
|---|---|---|---|
| Quadrant D | 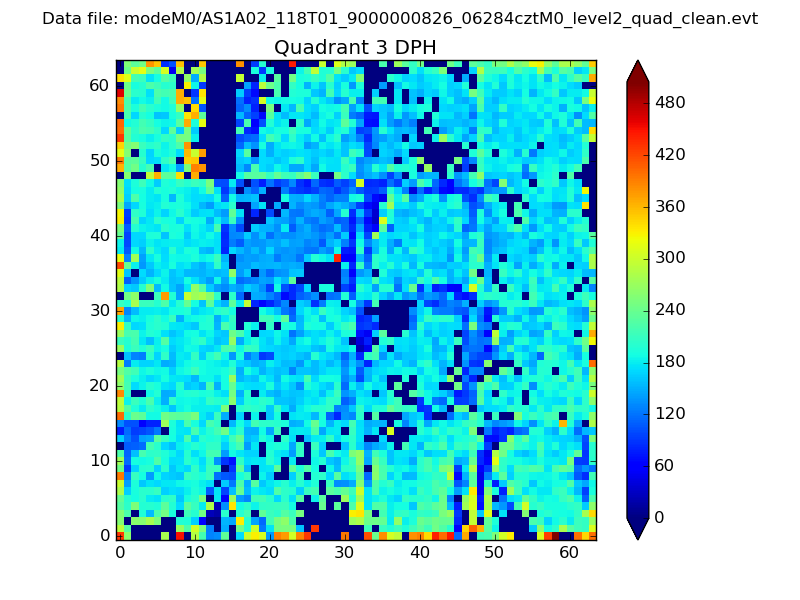 |
 |
Quadrant C |
| Plot type | Count rate plots | Images |
|---|---|---|
| Comparison with Poisson distribution Blue bars denote a histogram of data divided into 1 sec bins. Red curve is a Poisson curve with rate = median count rate of data. |
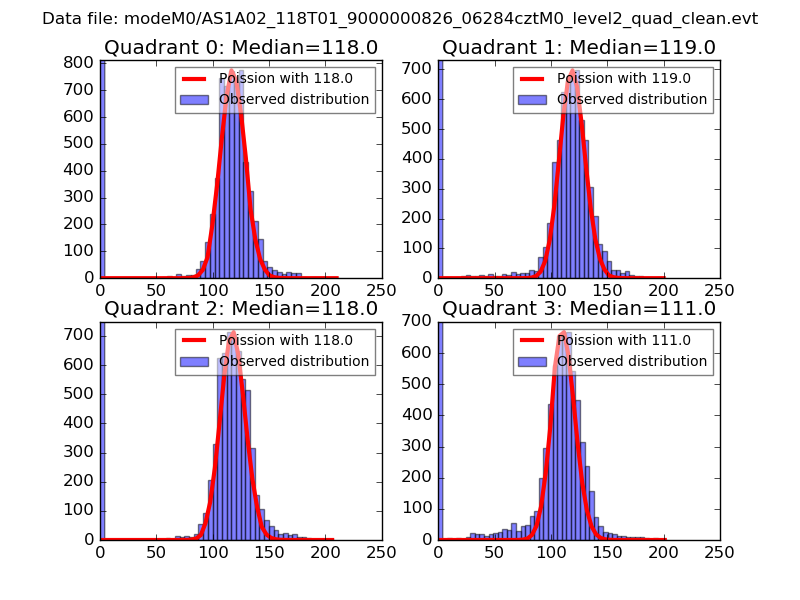 |
 |
| Quadrant-wise count rates Data is divided into 100 sec bins |
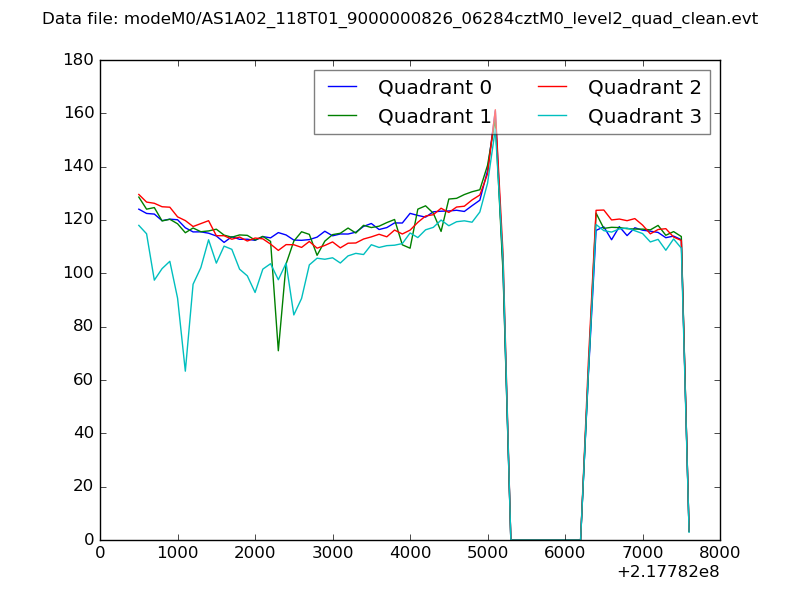 |
|
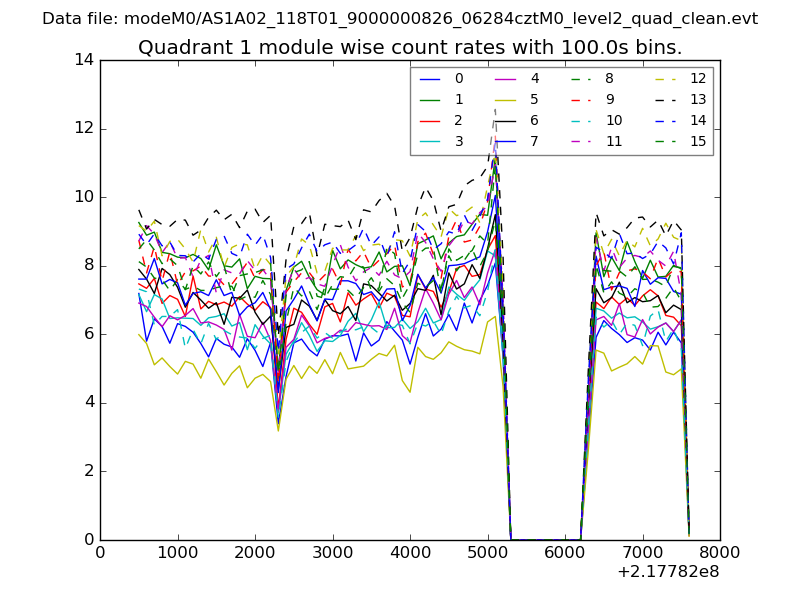
| Module-wise count rates for Quadrant A Data is divided into 100 sec bins |
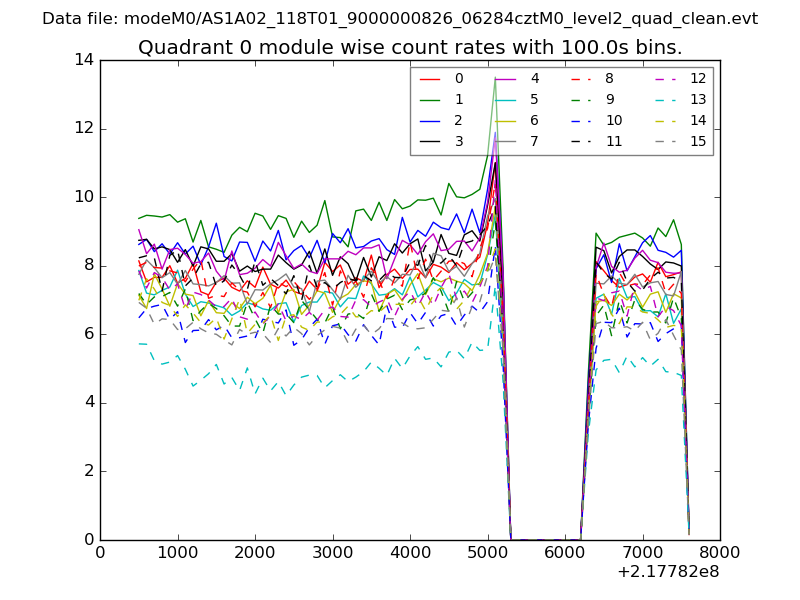 |
 |
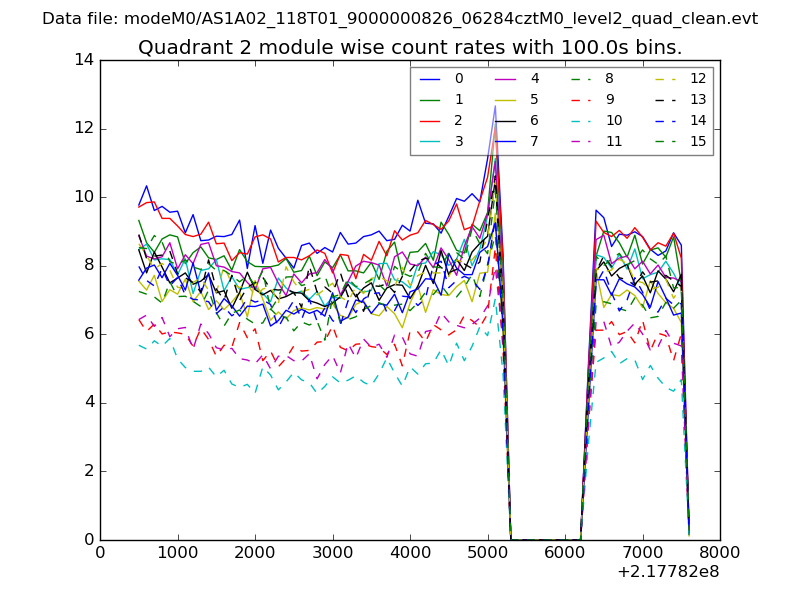
| Module-wise count rates for Quadrant B Data is divided into 100 sec bins |
 |
 |
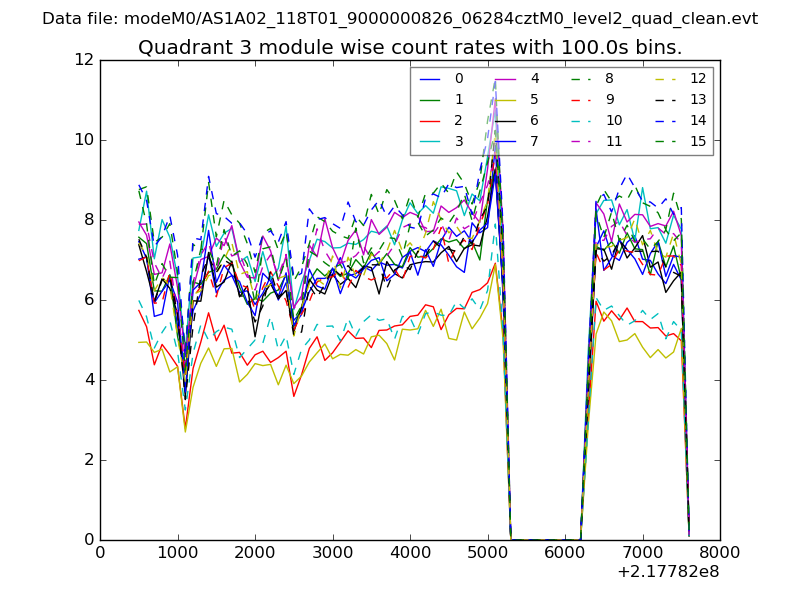
| Module-wise count rates for Quadrant C Data is divided into 100 sec bins |
 |
 |
| Module-wise count rates for Quadrant D Data is divided into 100 sec bins |
 |
 |
| Parameter | Plot |
|---|---|
| CZT HV Monitor | 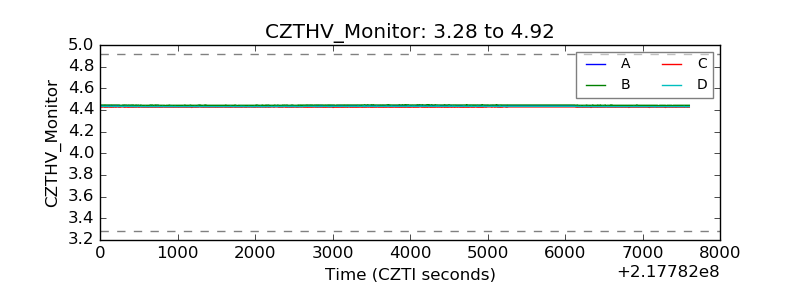 |
| D_VDD | 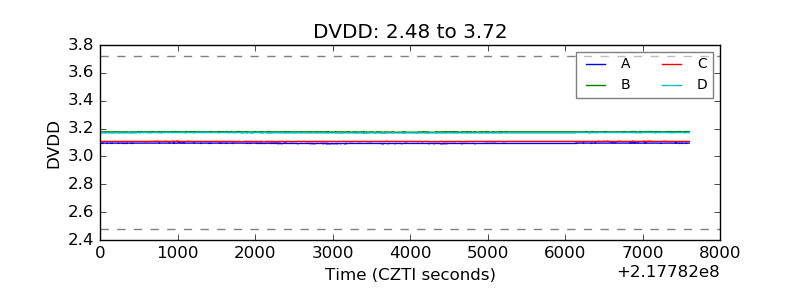 |
| Temperature 1 | 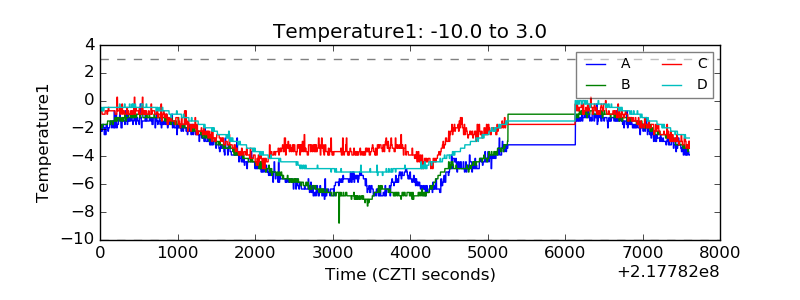 |
| Veto HV Monitor | 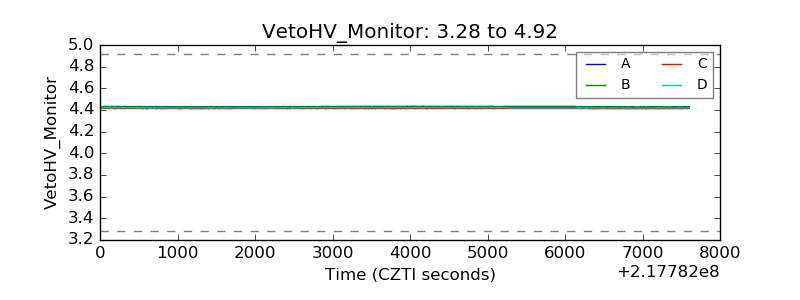 |
| Veto LLD | 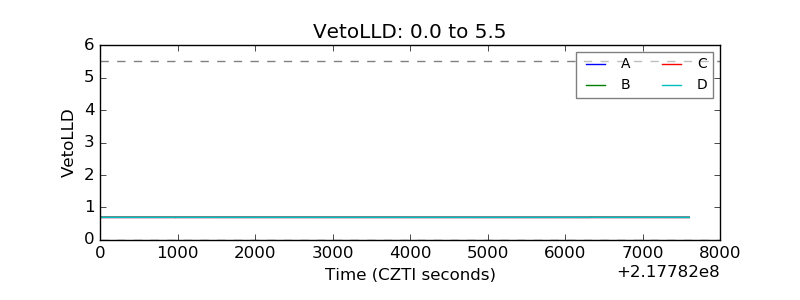 |
| Alpha Counter | 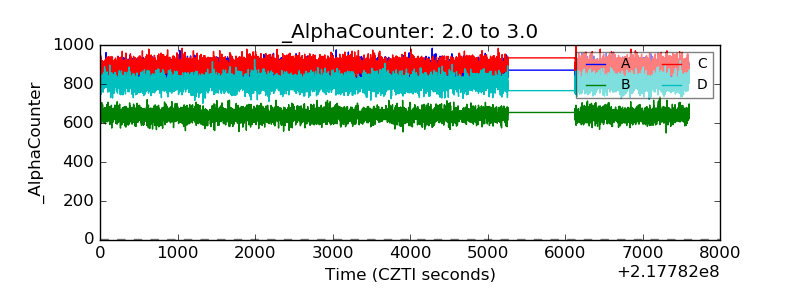 |
| _CPM_Rate | 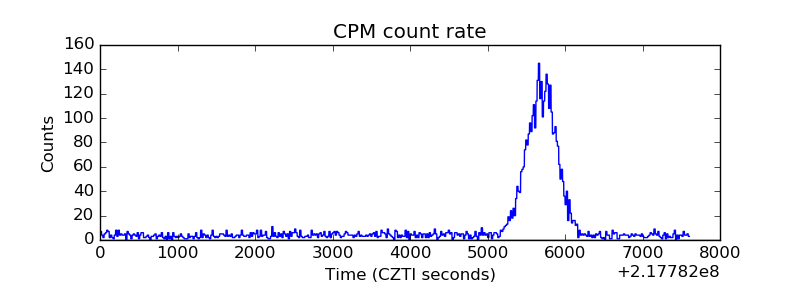 |
| CZT Counter | 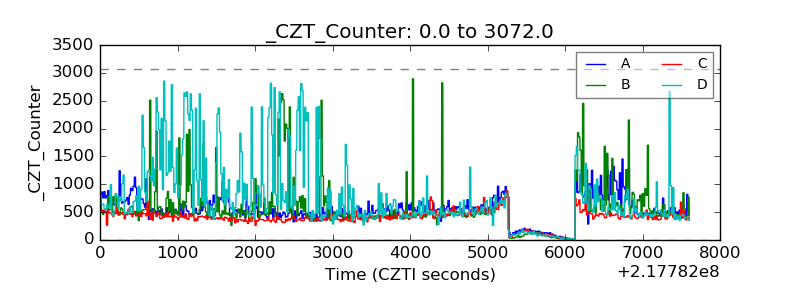 |
| +2.5 Volts monitor |  |
| +5 Volts monitor |  |
| _ROLL_ROT | 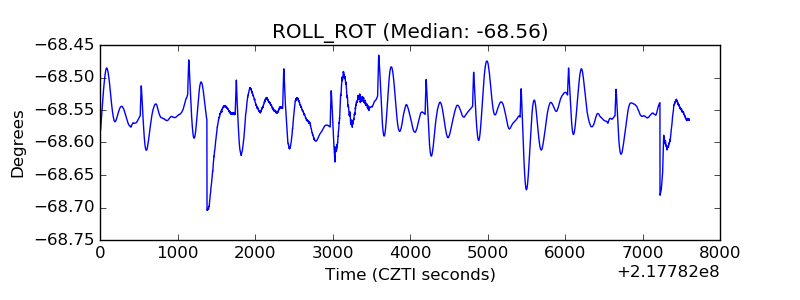 |
| _Roll_DEC | 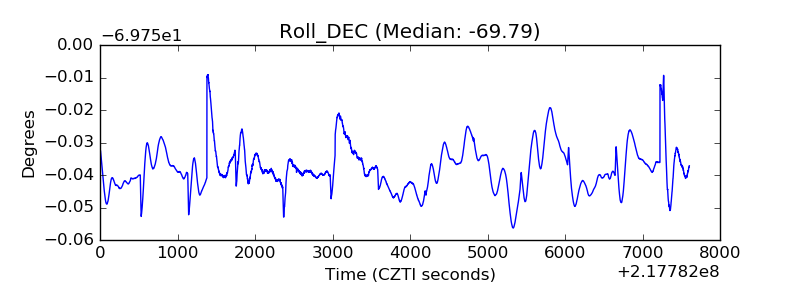 |
| _Roll_RA | 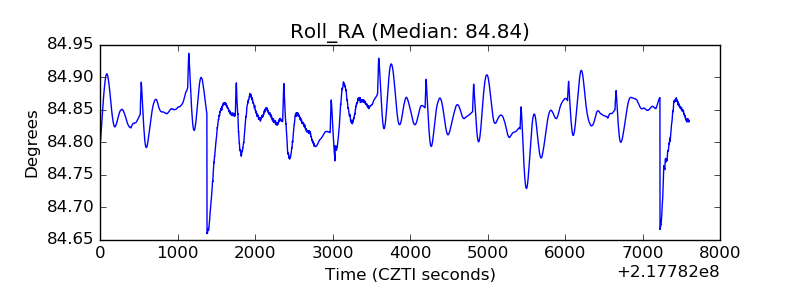 |
| Veto Counter | 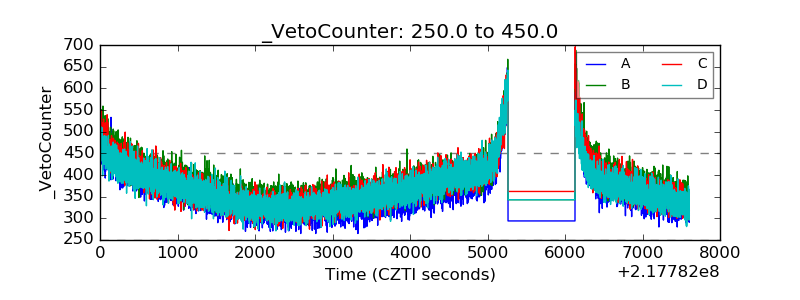 |