| Param | Original file | Final file |
|---|---|---|
| Filename | modeM0/AS1A02_118T01_9000000826_06290cztM0_level2.evt | modeM0/AS1A02_118T01_9000000826_06290cztM0_level2_quad_clean.evt |
| Size (bytes) | 1,568,134,080 | 274,812,480 |
| Size | 1.5 GB | 262.1 MB |
| Events in quadrant A | 10,019,942 | 1,795,333 |
| Events in quadrant B | 11,532,723 | 1,785,346 |
| Events in quadrant C | 8,001,872 | 1,792,752 |
| Events in quadrant D | 16,676,305 | 1,661,893 |
| Mode M9 | |||
|---|---|---|---|
| Quadrant | BADHDUFLAG | Total packets | Discarded packets |
| A | 0 | 23 | 0 |
| B | 0 | 23 | 0 |
| C | 0 | 23 | 0 |
| D | 0 | 23 | 0 |
| Mode SS | |||
|---|---|---|---|
| Quadrant | BADHDUFLAG | Total packets | Discarded packets |
| A | 0 | 382 | 0 |
| B | 0 | 382 | 0 |
| C | 0 | 382 | 0 |
| D | 0 | 382 | 0 |
| Mode M0 | |||
|---|---|---|---|
| Quadrant | BADHDUFLAG | Total packets | Discarded packets |
| A | 0 | 41902 | 5 |
| B | 0 | 47340 | 4 |
| C | 0 | 37762 | 4 |
| D | 0 | 62496 | 4 |
| Quadrant | Total seconds | Saturated seconds | Saturation percentage |
|---|---|---|---|
| A | 18691 | 78 | 0.417313% |
| B | 18691 | 954 | 5.104061% |
| C | 18691 | 58 | 0.310310% |
| D | 18691 | 1355 | 7.249478% |
Noise dominated data is calculated using 1-second bins in cleaned event files. If a bin has >2000 counts, and if more than 50% of those come from <1% of pixels, then it is considered to be noise-dominated and hence unusable.
| Quadrant | # 1 sec bins | Bins with >0 counts | Bins with >2000 counts | High rate bins dominated by noise | Noise dominated (total time) | Noise dominated (detector-on time) | Marked lightcurve |
|---|---|---|---|---|---|---|---|
| A | 20911 | 18694 | 0 | 0 | 0.00% | 0.00% | 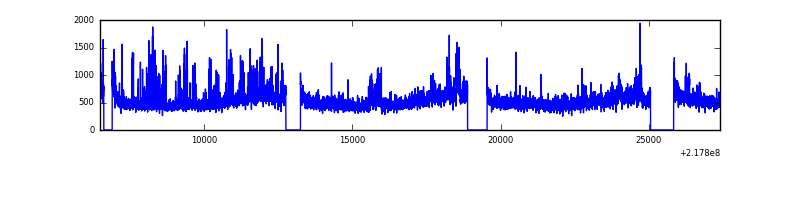 |
| B | 20911 | 18693 | 518 | 518 | 2.48% | 2.77% | 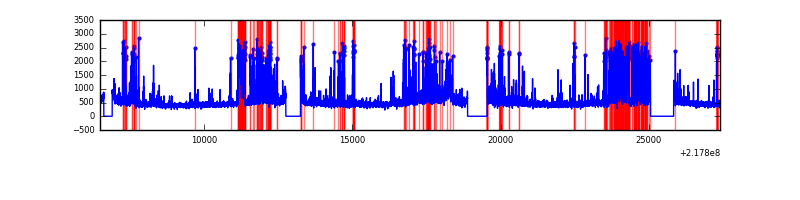 |
| C | 20911 | 18694 | 4 | 4 | 0.02% | 0.02% | 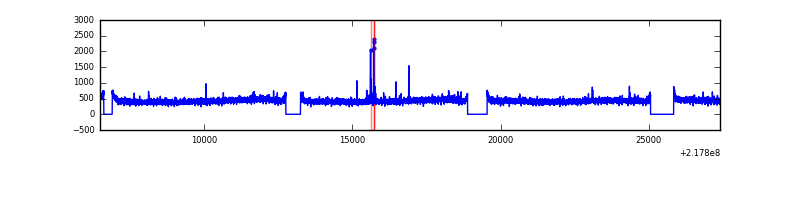 |
| D | 20911 | 18692 | 1055 | 1055 | 5.05% | 5.64% | 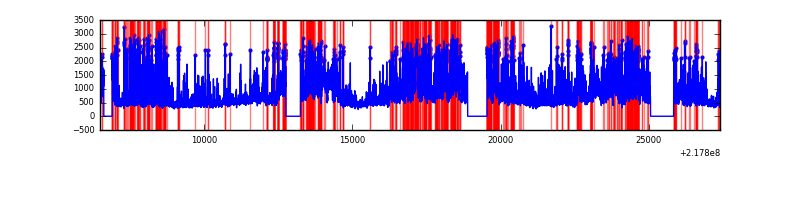 |
Top three noisy pixels from each quadrant. If the there are fewer than three noisy pixels in the level2.evt file, extra rows are filled as -1
| Pixel properties | Quadrant properties | ||||||
|---|---|---|---|---|---|---|---|
| Quadrant | DetID | PixID | Counts | Sigma | Mean | Median | Sigma |
| A | 8 | 15 | 1579140 | 3694.0 | 2082 | 2031 | 426.9 |
| A | 15 | 236 | 379367 | 883.82 | 2082 | 2031 | 426.9 |
| A | 0 | 226 | 20207 | 42.57 | 2082 | 2031 | 426.9 |
| B | 3 | 64 | 2196820 | 5623.18 | 2068 | 2015 | 390.3 |
| B | 0 | 219 | 552687 | 1410.84 | 2068 | 2015 | 390.3 |
| B | 15 | 204 | 483405 | 1233.34 | 2068 | 2015 | 390.3 |
| C | 9 | 54 | 51965 | 106.59 | 2033 | 2039 | 468.4 |
| C | 13 | 61 | 16103 | 30.02 | 2033 | 2039 | 468.4 |
| C | 1 | 16 | 14212 | 25.99 | 2033 | 2039 | 468.4 |
| D | 2 | 63 | 5171465 | 10772.4 | 1974 | 1909 | 479.9 |
| D | 12 | 220 | 2110688 | 4394.31 | 1974 | 1909 | 479.9 |
| D | 2 | 152 | 670694 | 1393.62 | 1974 | 1909 | 479.9 |
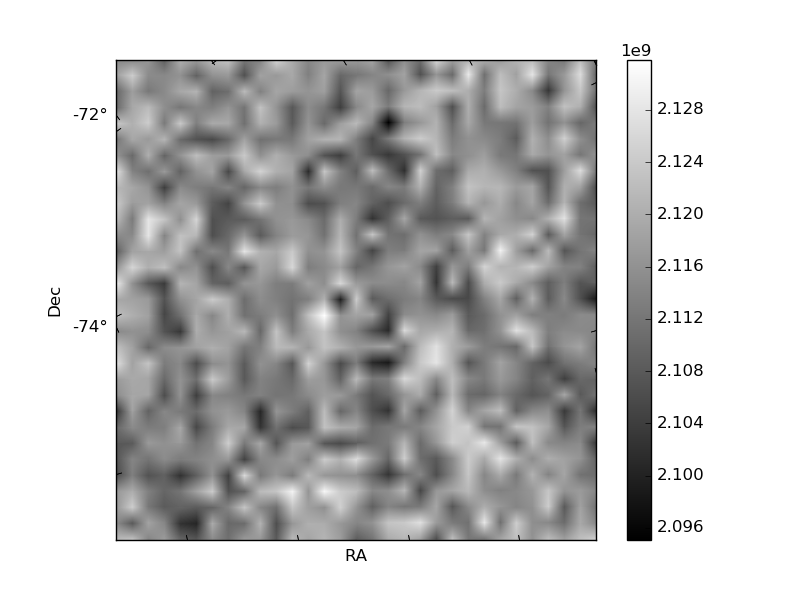
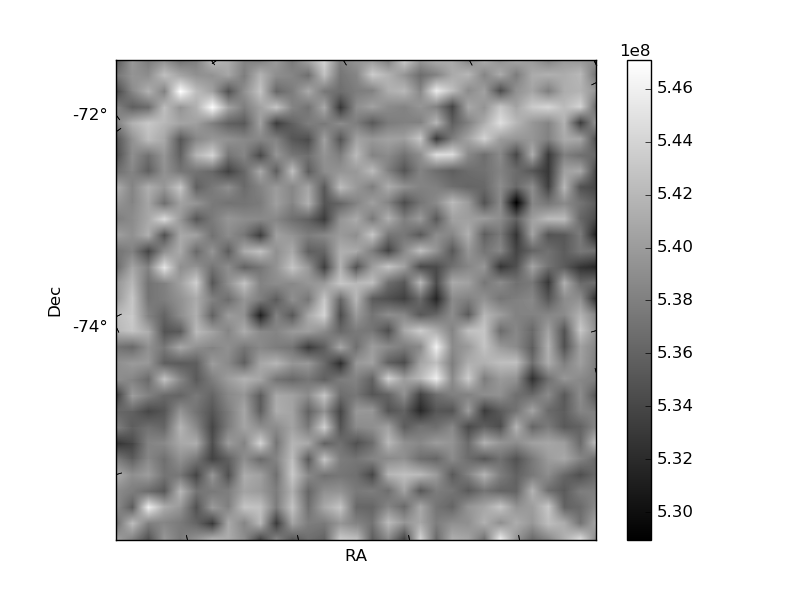
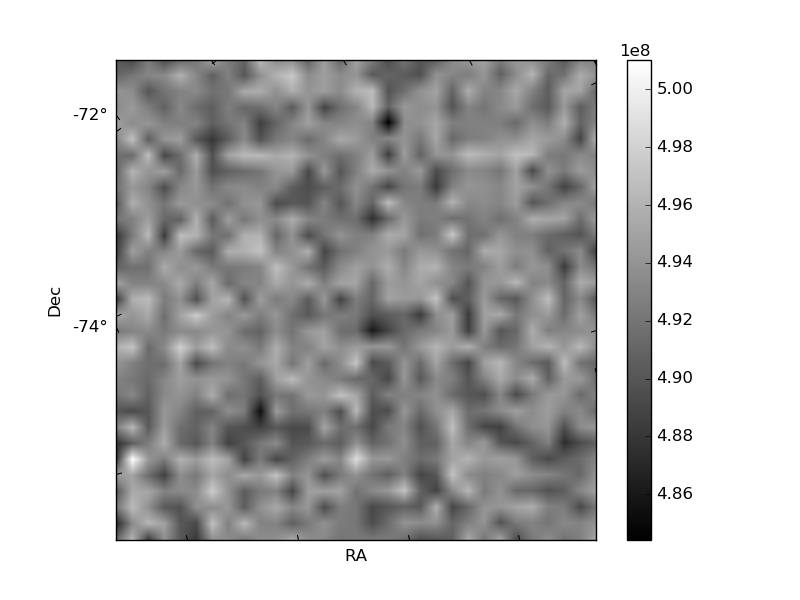
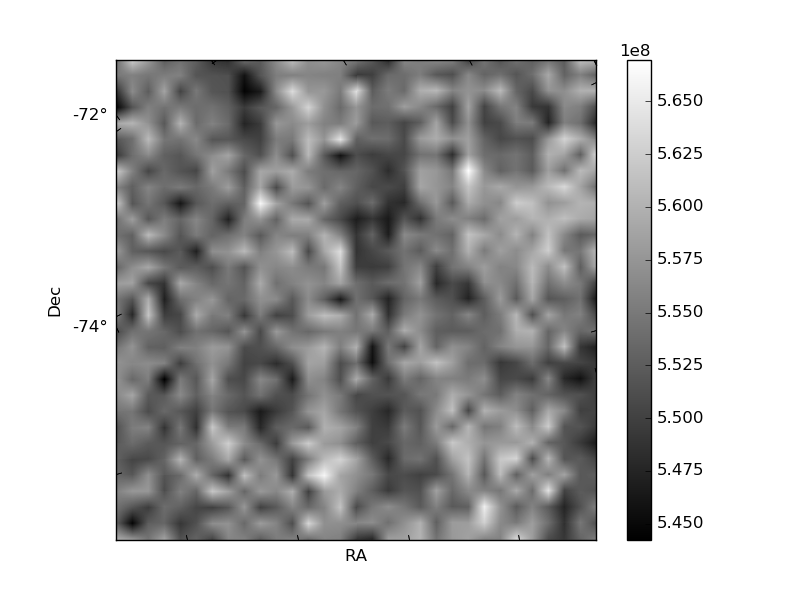
Histogram calculated using DETX and DETY for each event in the final _common_clean file
| Quadrant A | 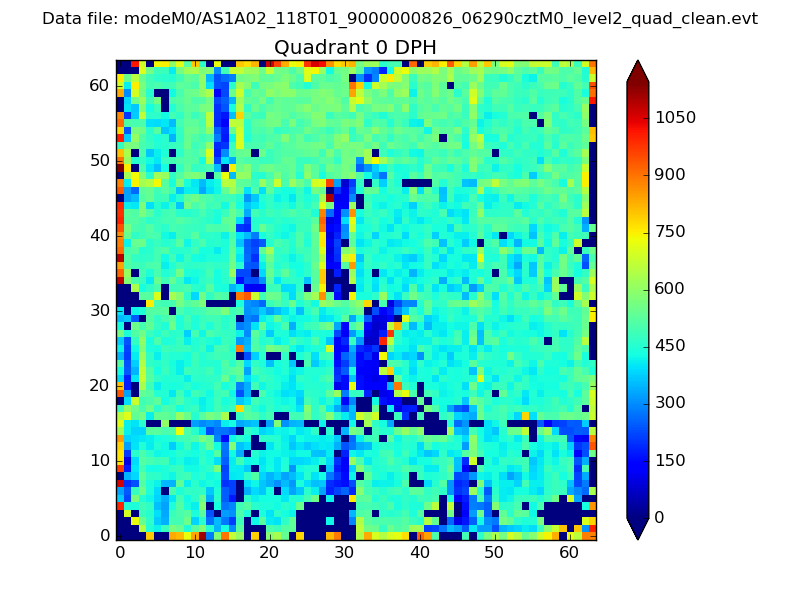 |
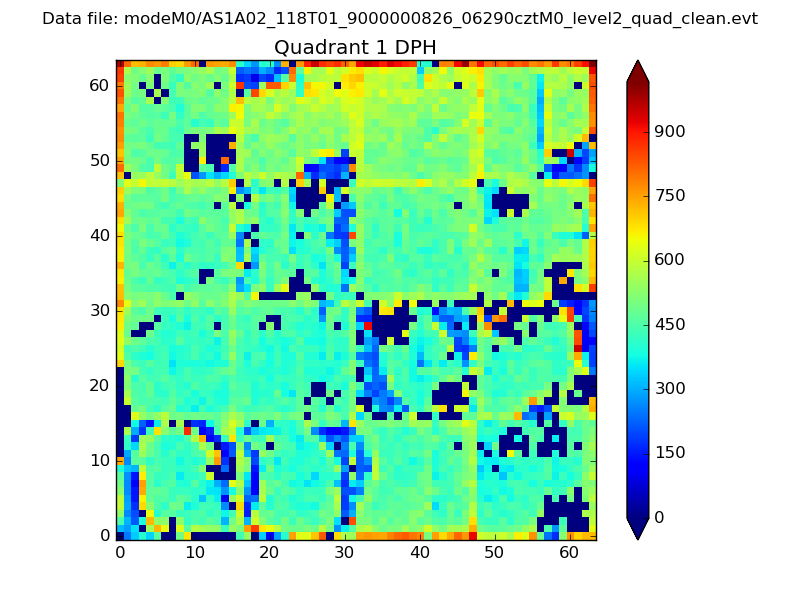 |
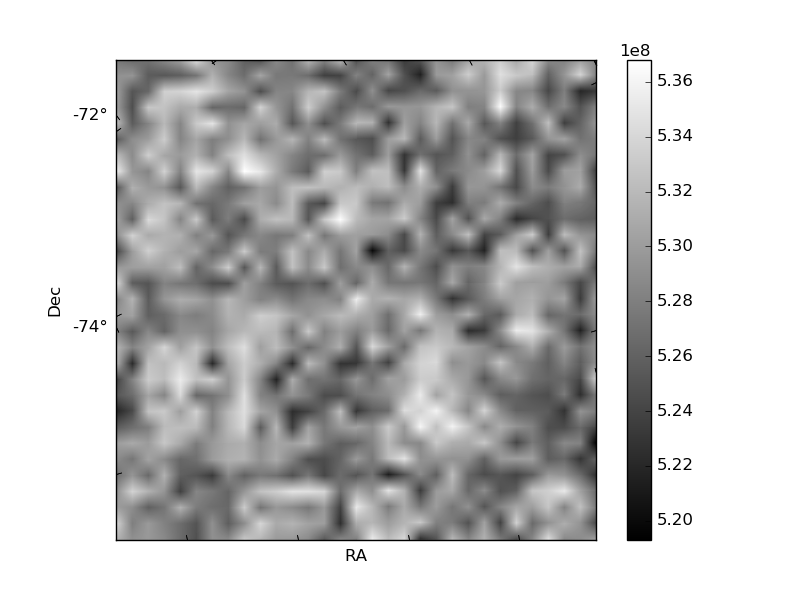
Quadrant B |
|---|---|---|---|
| Quadrant D | 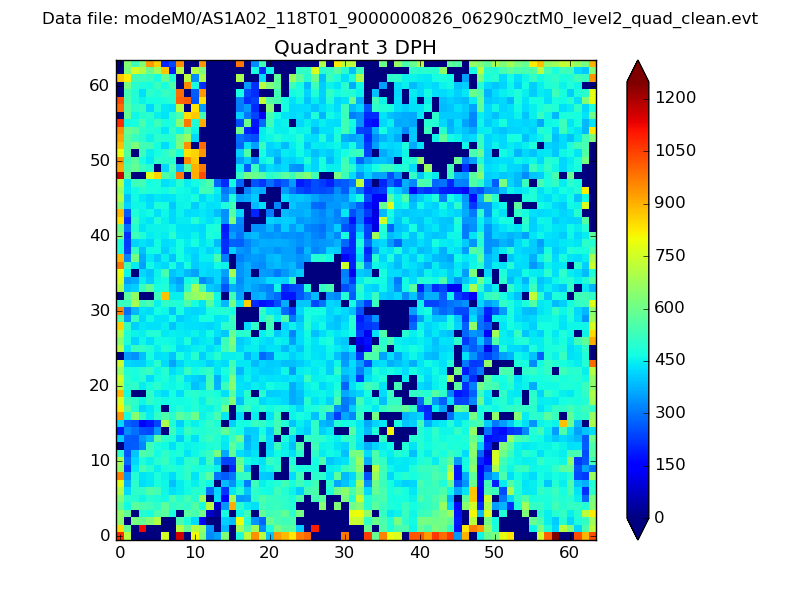 |
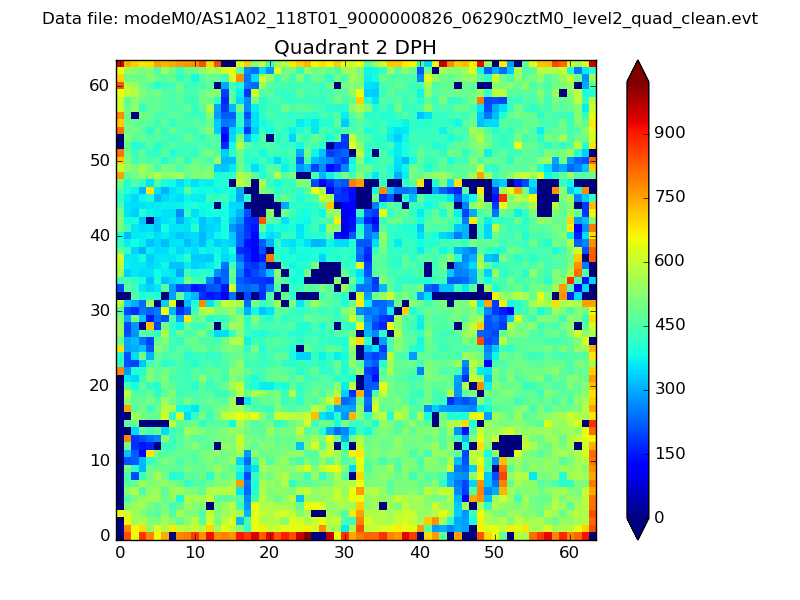 |
Quadrant C |
| Plot type | Count rate plots | Images |
|---|---|---|
| Comparison with Poisson distribution Blue bars denote a histogram of data divided into 1 sec bins. Red curve is a Poisson curve with rate = median count rate of data. |
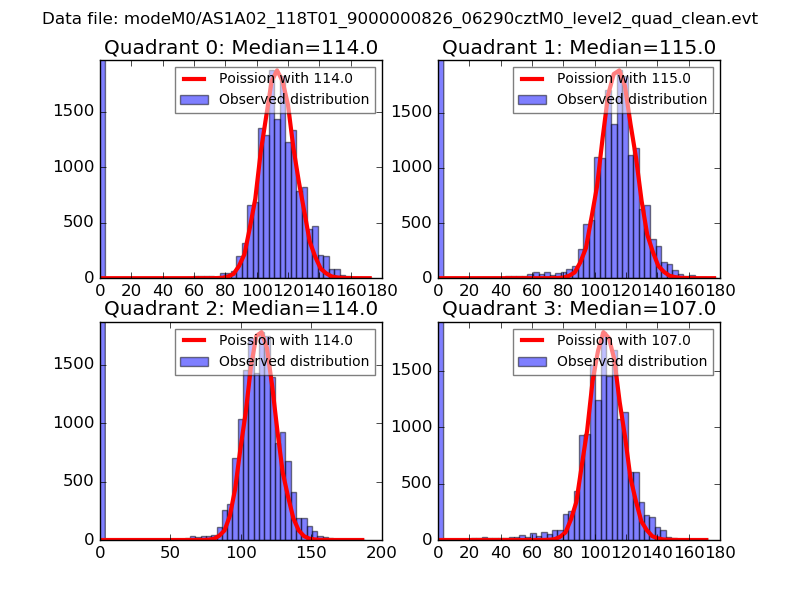 |
 |
| Quadrant-wise count rates Data is divided into 100 sec bins |
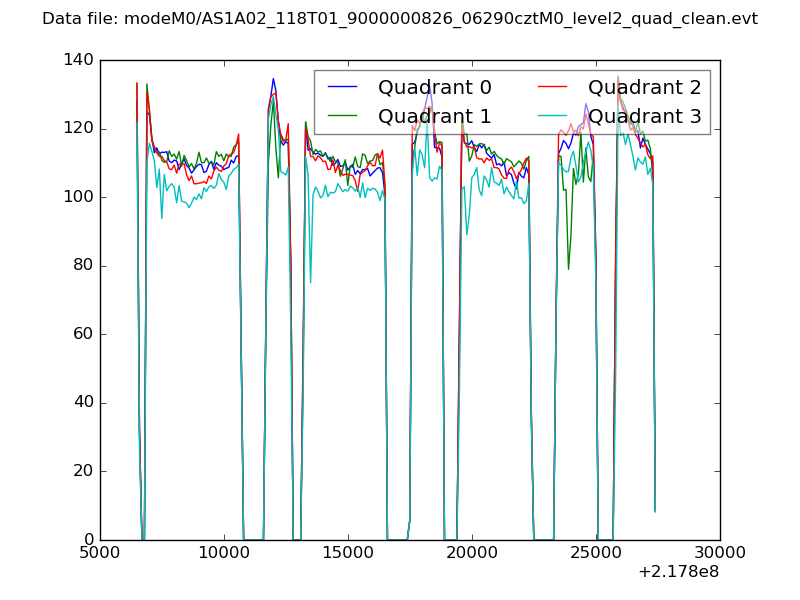 |
|
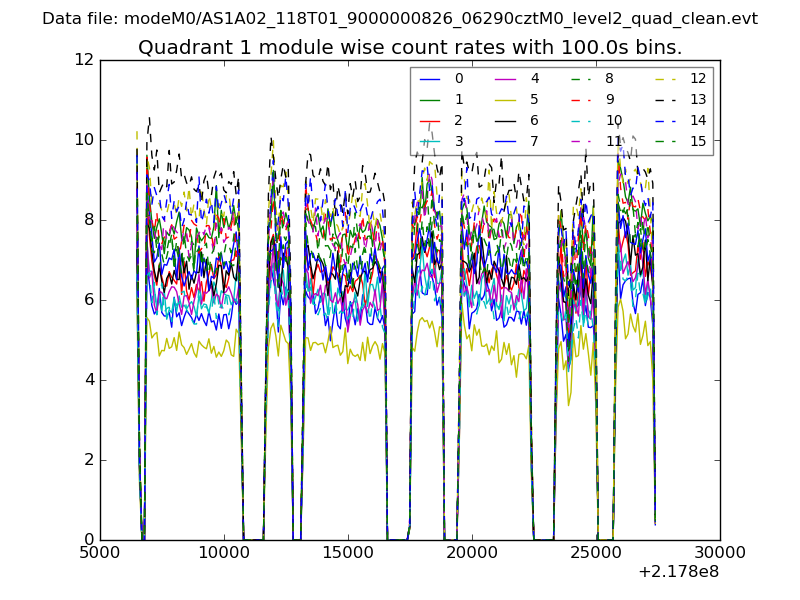
| Module-wise count rates for Quadrant A Data is divided into 100 sec bins |
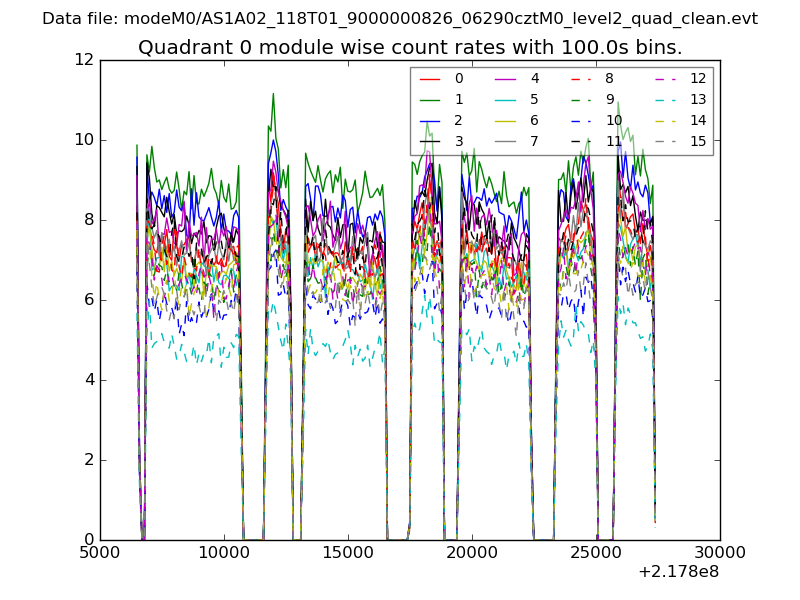 |
 |
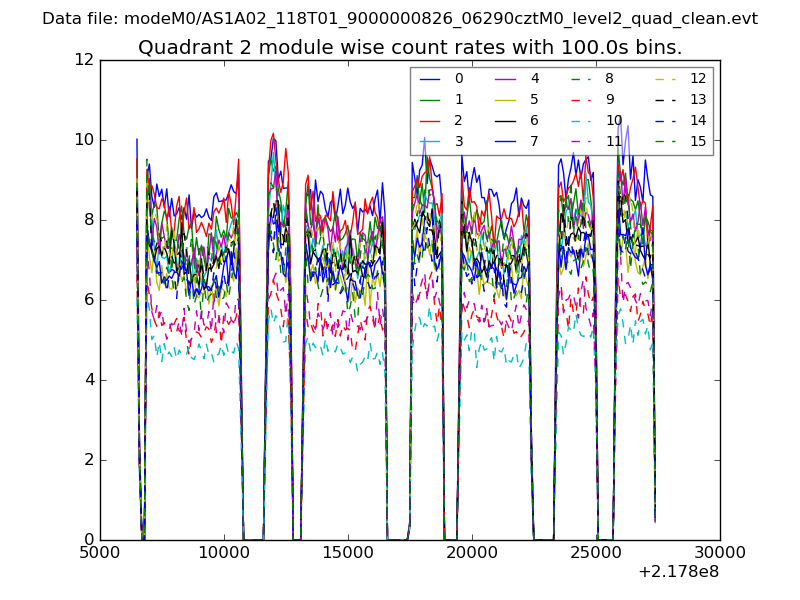
| Module-wise count rates for Quadrant B Data is divided into 100 sec bins |
 |
 |
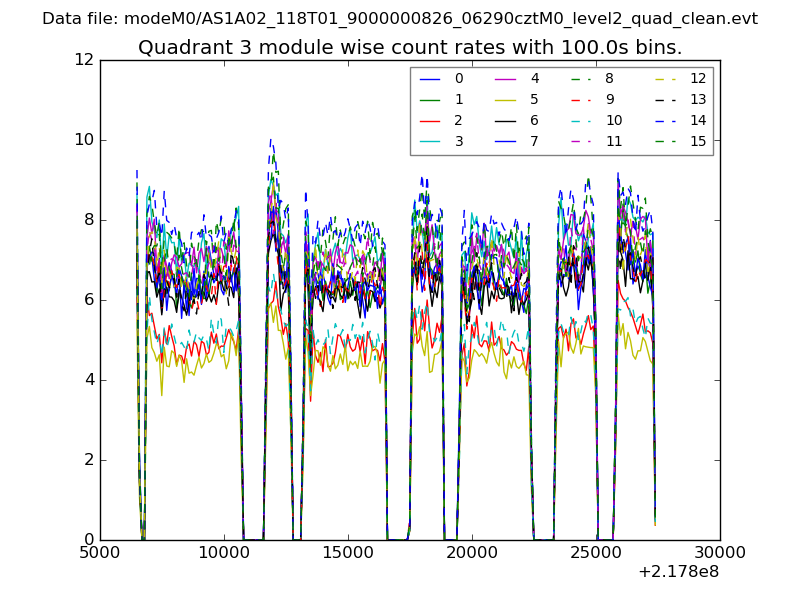
| Module-wise count rates for Quadrant C Data is divided into 100 sec bins |
 |
 |
| Module-wise count rates for Quadrant D Data is divided into 100 sec bins |
 |
 |
| Parameter | Plot |
|---|---|
| CZT HV Monitor | 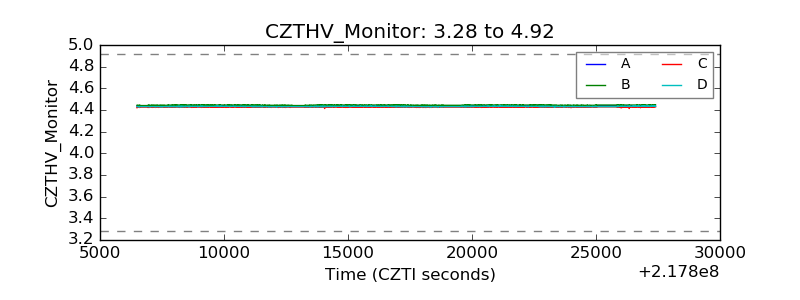 |
| D_VDD |  |
| Temperature 1 | 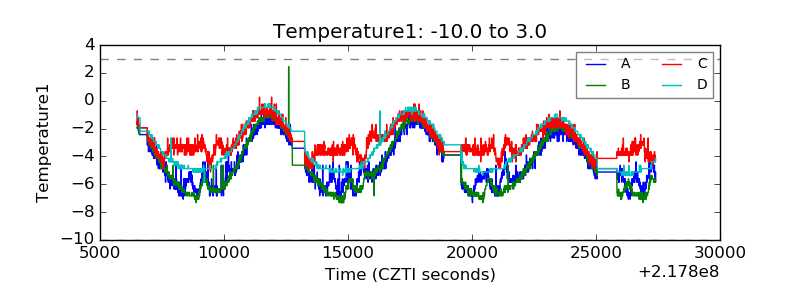 |
| Veto HV Monitor | 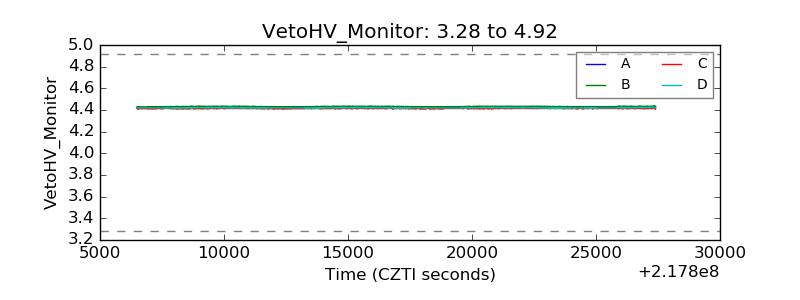 |
| Veto LLD | 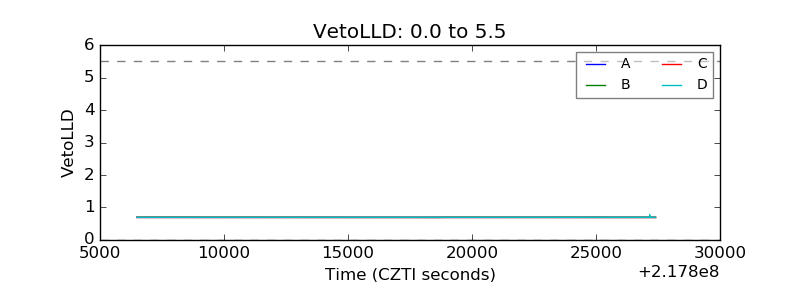 |
| Alpha Counter | 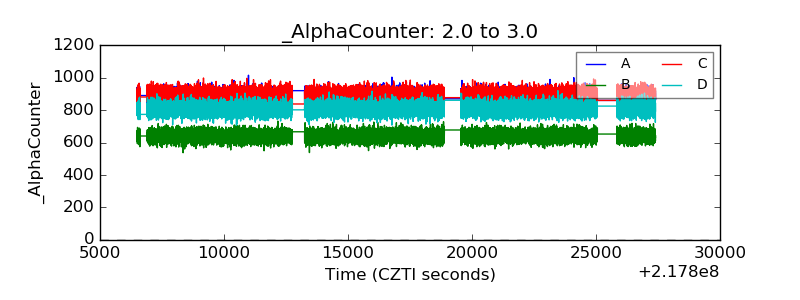 |
| _CPM_Rate | 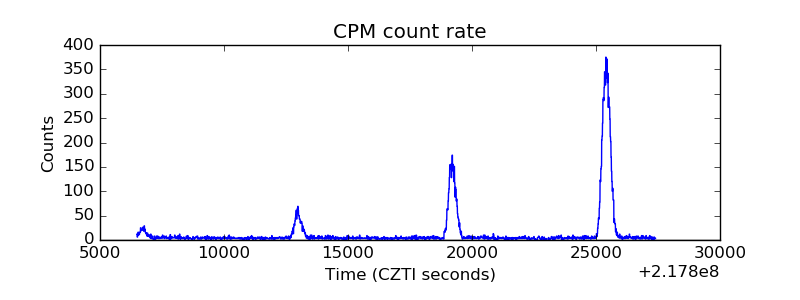 |
| CZT Counter | 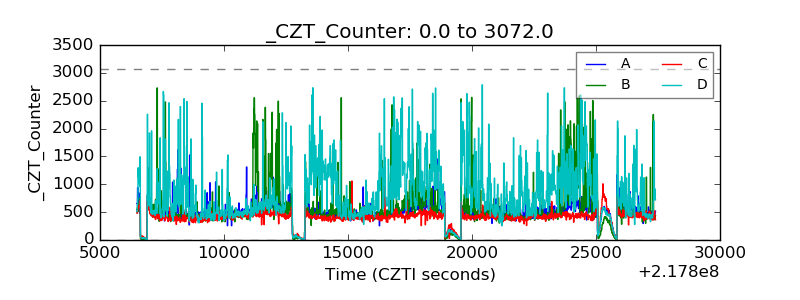 |
| +2.5 Volts monitor |  |
| +5 Volts monitor |  |
| _ROLL_ROT | 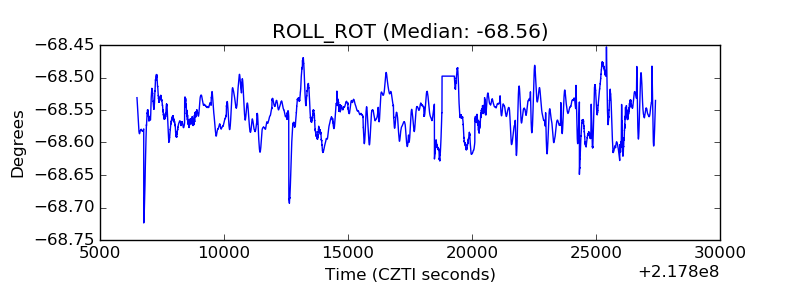 |
| _Roll_DEC | 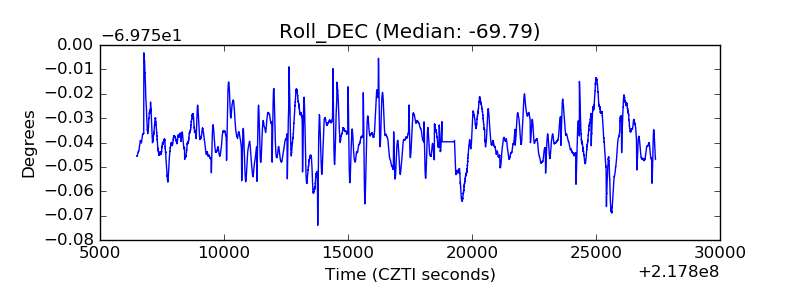 |
| _Roll_RA | 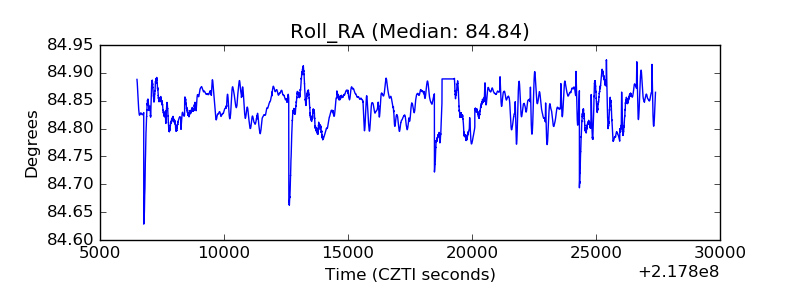 |
| Veto Counter | 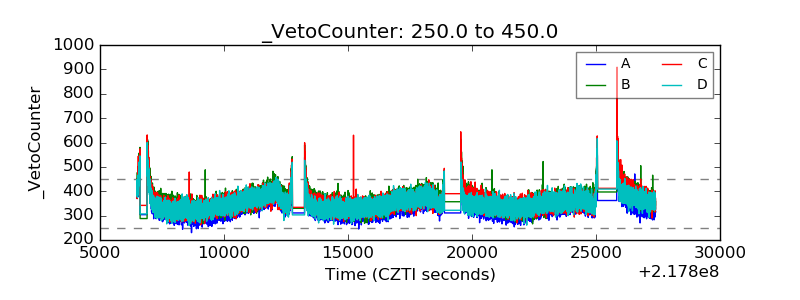 |