| Param | Original file | Final file |
|---|---|---|
| Filename | modeM0/AS1A02_118T01_9000000826_06291cztM0_level2.evt | modeM0/AS1A02_118T01_9000000826_06291cztM0_level2_quad_clean.evt |
| Size (bytes) | 2,859,606,720 | 515,551,680 |
| Size | 2.7 GB | 491.7 MB |
| Events in quadrant A | 19,062,782 | 3,354,148 |
| Events in quadrant B | 20,627,052 | 3,357,693 |
| Events in quadrant C | 15,034,330 | 3,359,167 |
| Events in quadrant D | 29,504,626 | 3,122,933 |
| Mode M9 | |||
|---|---|---|---|
| Quadrant | BADHDUFLAG | Total packets | Discarded packets |
| A | 0 | 34 | 0 |
| B | 0 | 34 | 0 |
| C | 0 | 34 | 0 |
| D | 0 | 34 | 0 |
| Mode SS | |||
|---|---|---|---|
| Quadrant | BADHDUFLAG | Total packets | Discarded packets |
| A | 0 | 718 | 0 |
| B | 0 | 718 | 0 |
| C | 0 | 718 | 0 |
| D | 0 | 718 | 0 |
| Mode M0 | |||
|---|---|---|---|
| Quadrant | BADHDUFLAG | Total packets | Discarded packets |
| A | 0 | 79528 | 7 |
| B | 0 | 85948 | 6 |
| C | 0 | 71120 | 6 |
| D | 0 | 111980 | 6 |
| Quadrant | Total seconds | Saturated seconds | Saturation percentage |
|---|---|---|---|
| A | 35248 | 201 | 0.570245% |
| B | 35248 | 1424 | 4.039946% |
| C | 35248 | 95 | 0.269519% |
| D | 35248 | 2390 | 6.780527% |
Noise dominated data is calculated using 1-second bins in cleaned event files. If a bin has >2000 counts, and if more than 50% of those come from <1% of pixels, then it is considered to be noise-dominated and hence unusable.
| Quadrant | # 1 sec bins | Bins with >0 counts | Bins with >2000 counts | High rate bins dominated by noise | Noise dominated (total time) | Noise dominated (detector-on time) | Marked lightcurve |
|---|---|---|---|---|---|---|---|
| A | 38678 | 35252 | 25 | 25 | 0.06% | 0.07% | 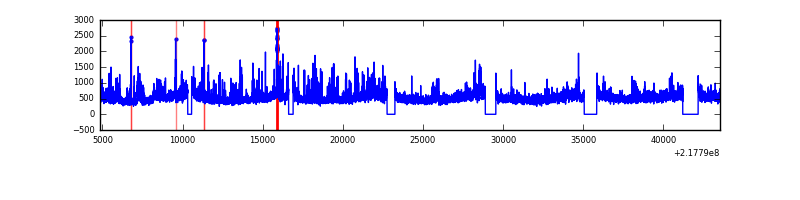 |
| B | 38678 | 35251 | 772 | 772 | 2.00% | 2.19% | 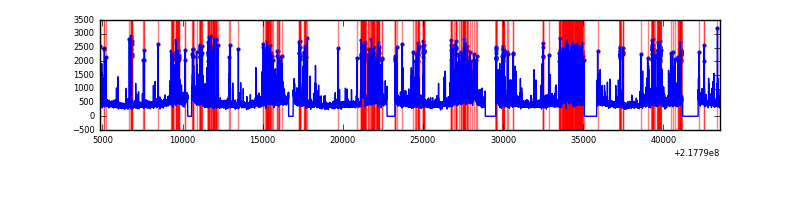 |
| C | 38678 | 35252 | 4 | 4 | 0.01% | 0.01% | 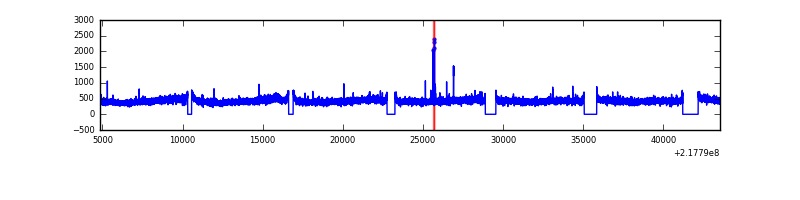 |
| D | 38678 | 35249 | 1989 | 1989 | 5.14% | 5.64% | 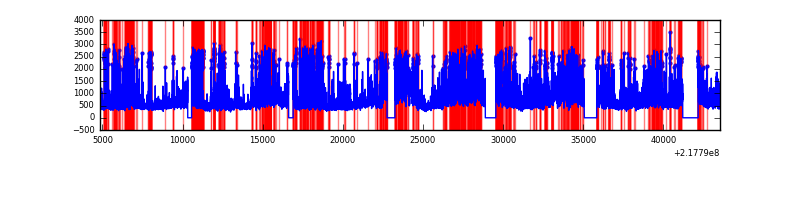 |
Top three noisy pixels from each quadrant. If the there are fewer than three noisy pixels in the level2.evt file, extra rows are filled as -1
| Pixel properties | Quadrant properties | ||||||
|---|---|---|---|---|---|---|---|
| Quadrant | DetID | PixID | Counts | Sigma | Mean | Median | Sigma |
| A | 8 | 15 | 3034465 | 3822.55 | 3923 | 3836 | 792.8 |
| A | 15 | 236 | 673797 | 845.03 | 3923 | 3836 | 792.8 |
| A | 13 | 251 | 124937 | 152.74 | 3923 | 3836 | 792.8 |
| B | 3 | 64 | 3063375 | 4192.91 | 3913 | 3817 | 729.7 |
| B | 0 | 219 | 1335564 | 1825.06 | 3913 | 3817 | 729.7 |
| B | 15 | 204 | 660612 | 900.09 | 3913 | 3817 | 729.7 |
| C | 9 | 54 | 58852 | 62.49 | 3832 | 3846 | 880.2 |
| C | 13 | 61 | 30517 | 30.3 | 3832 | 3846 | 880.2 |
| C | 1 | 16 | 17766 | 15.81 | 3832 | 3846 | 880.2 |
| D | 2 | 63 | 6983207 | 7714.61 | 3737 | 3622 | 904.7 |
| D | 12 | 220 | 5166253 | 5706.31 | 3737 | 3622 | 904.7 |
| D | 2 | 152 | 1223551 | 1348.4 | 3737 | 3622 | 904.7 |
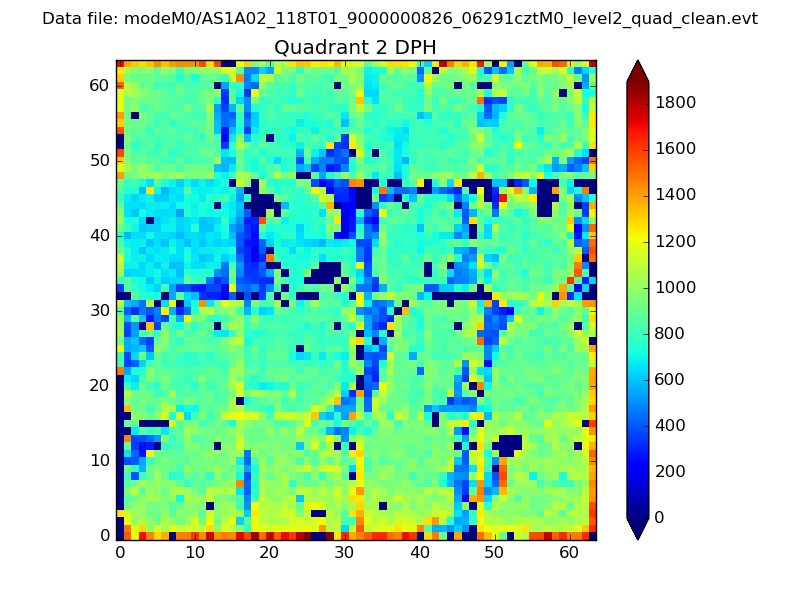
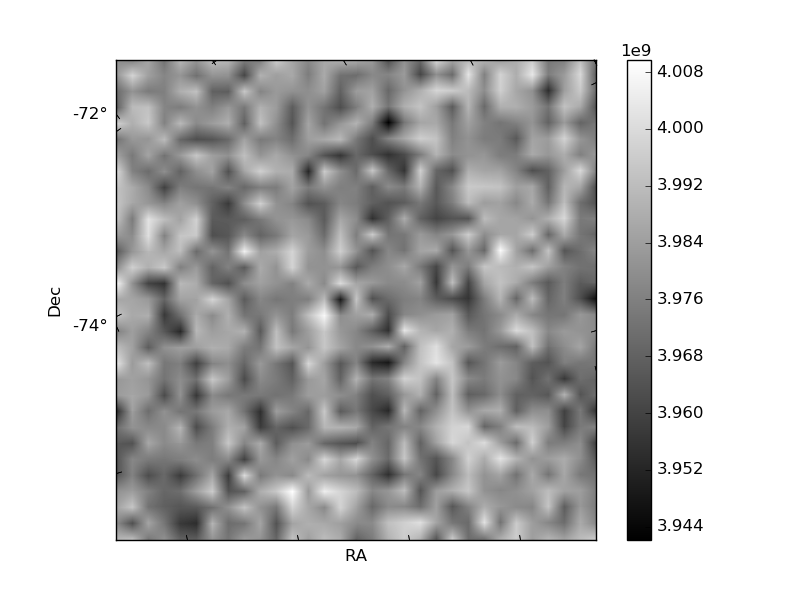
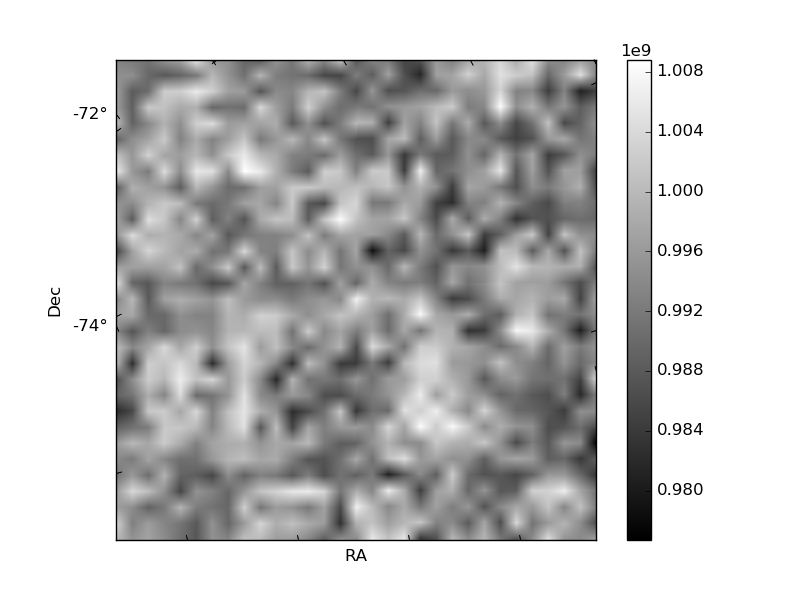
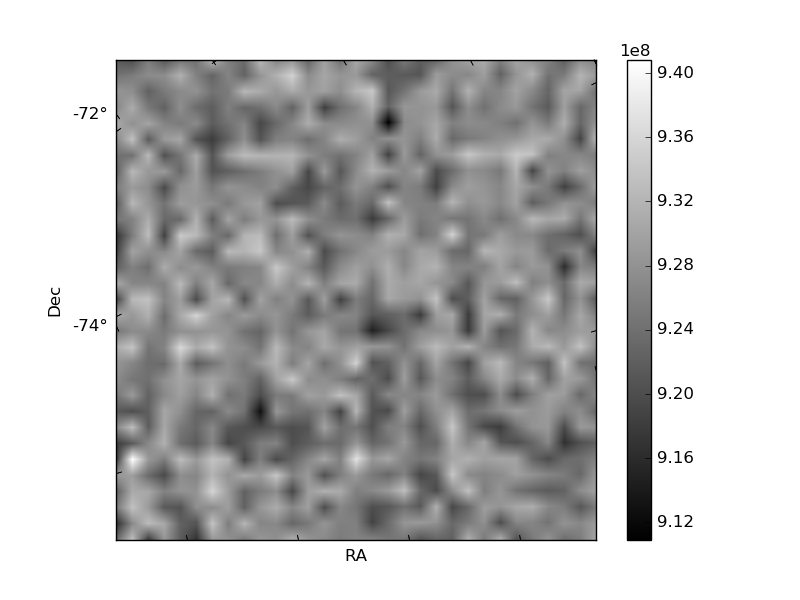
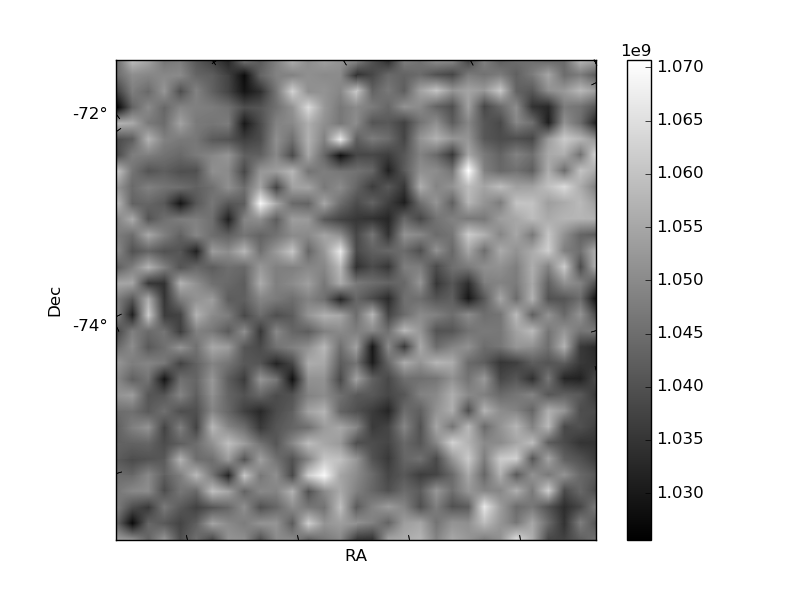
Histogram calculated using DETX and DETY for each event in the final _common_clean file
| Quadrant A | 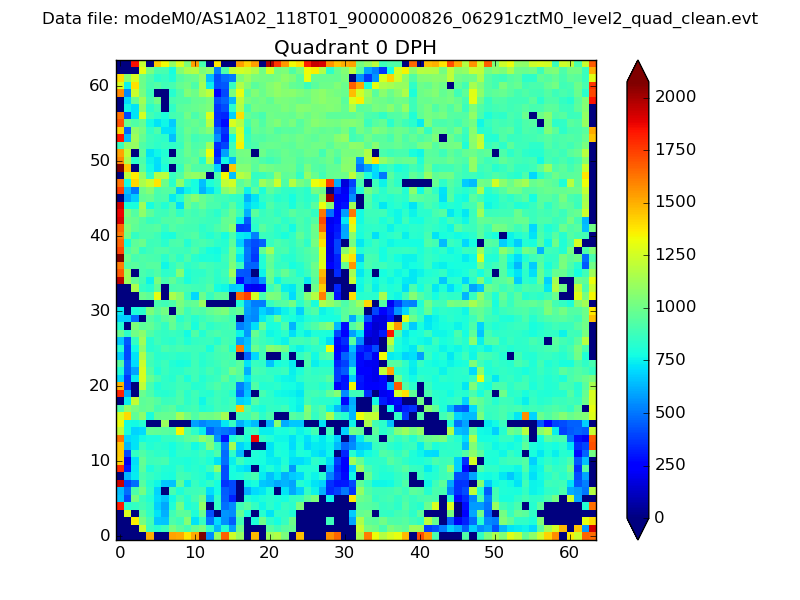 |
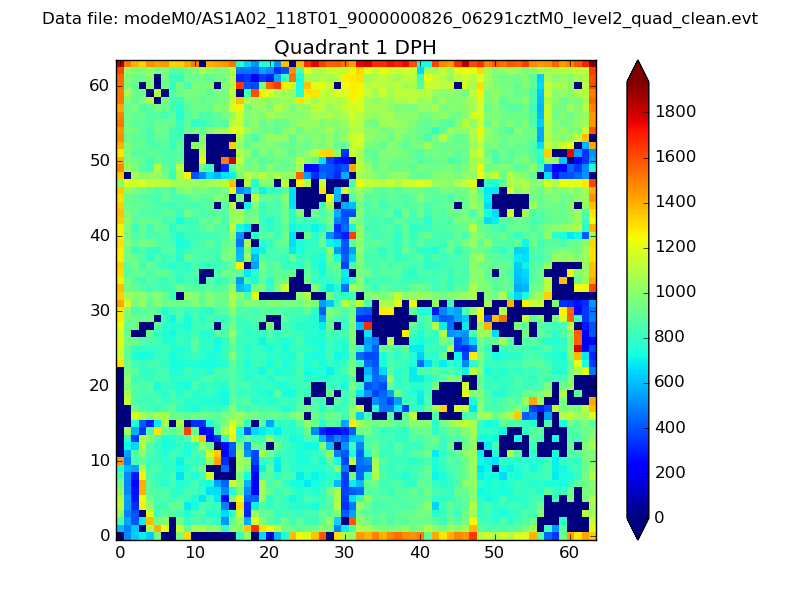 |
Quadrant B |
|---|---|---|---|
| Quadrant D | 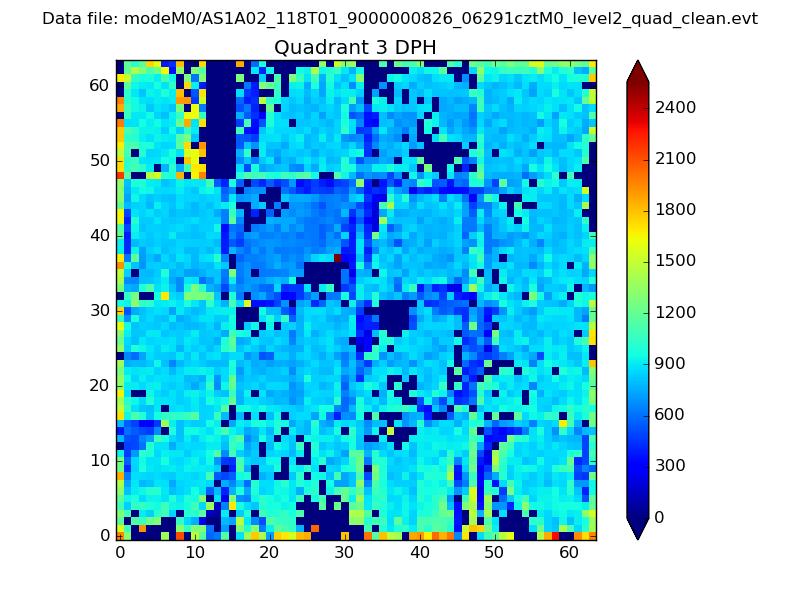 |
 |
Quadrant C |
| Plot type | Count rate plots | Images |
|---|---|---|
| Comparison with Poisson distribution Blue bars denote a histogram of data divided into 1 sec bins. Red curve is a Poisson curve with rate = median count rate of data. |
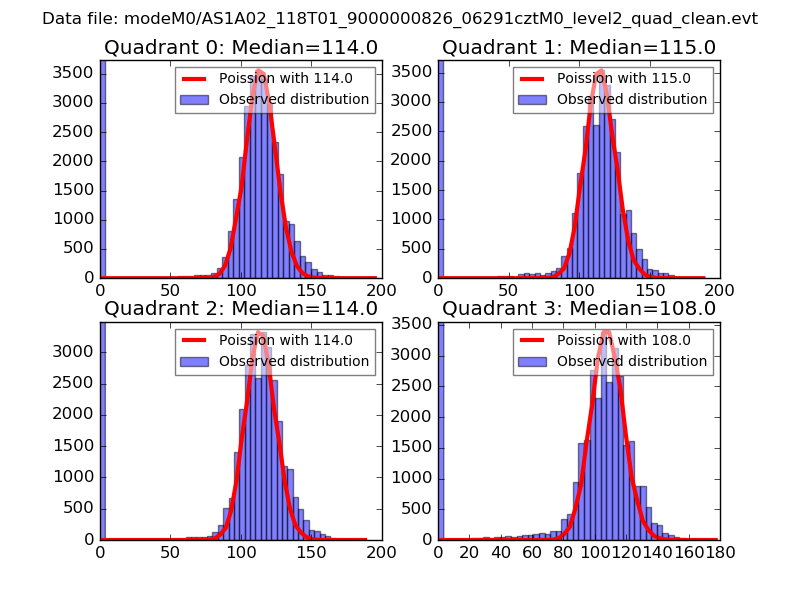 |
 |
| Quadrant-wise count rates Data is divided into 100 sec bins |
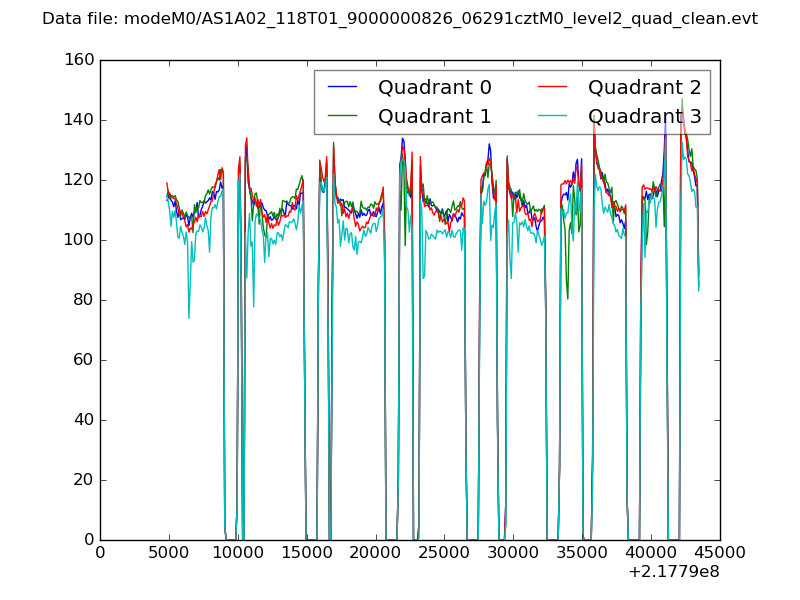 |
|
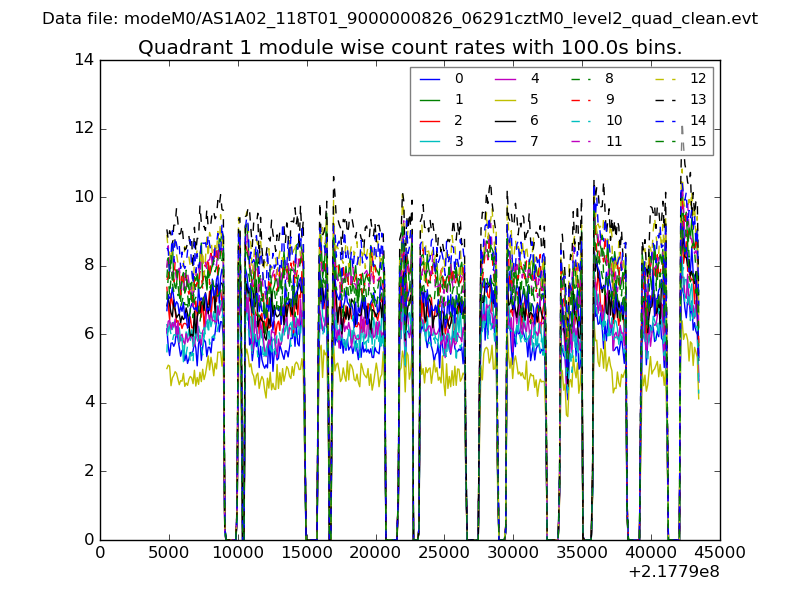
| Module-wise count rates for Quadrant A Data is divided into 100 sec bins |
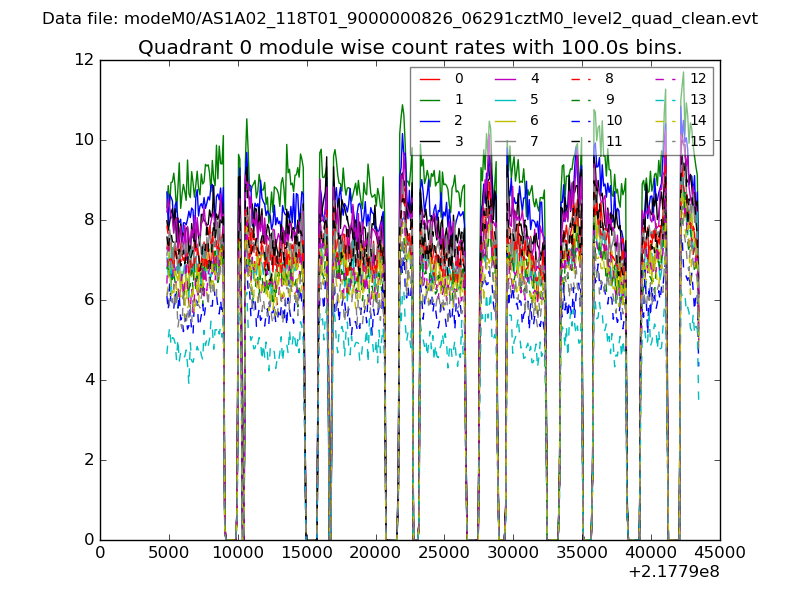 |
 |
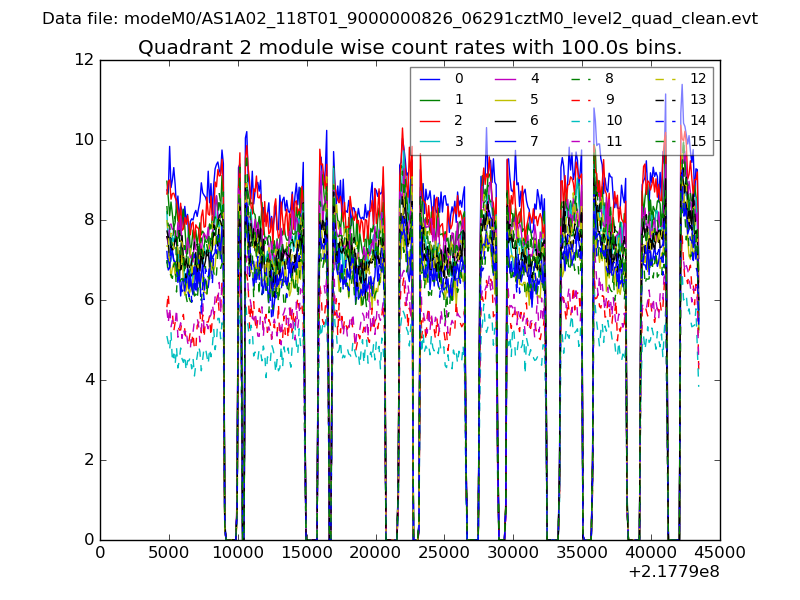
| Module-wise count rates for Quadrant B Data is divided into 100 sec bins |
 |
 |
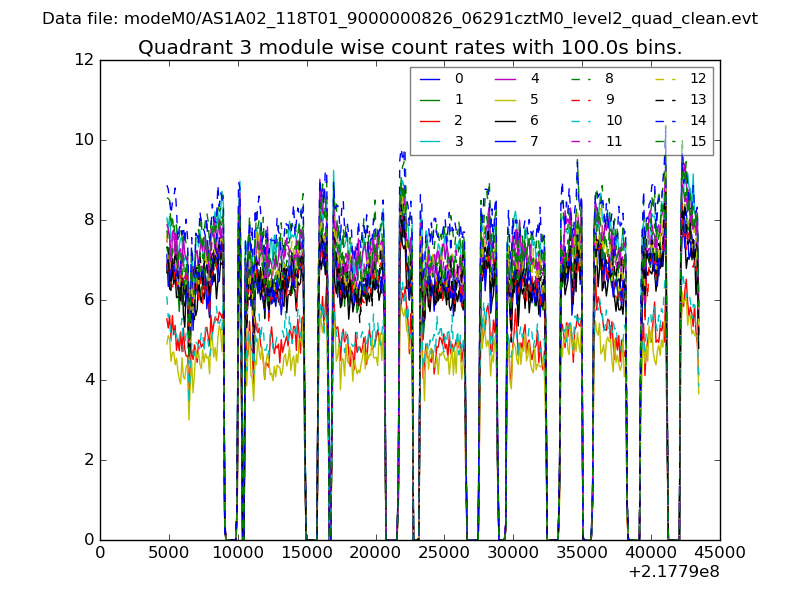
| Module-wise count rates for Quadrant C Data is divided into 100 sec bins |
 |
 |
| Module-wise count rates for Quadrant D Data is divided into 100 sec bins |
 |
 |
| Parameter | Plot |
|---|---|
| CZT HV Monitor | 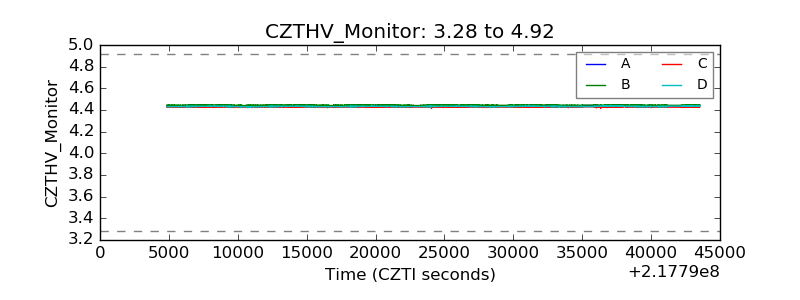 |
| D_VDD |  |
| Temperature 1 |  |
| Veto HV Monitor | 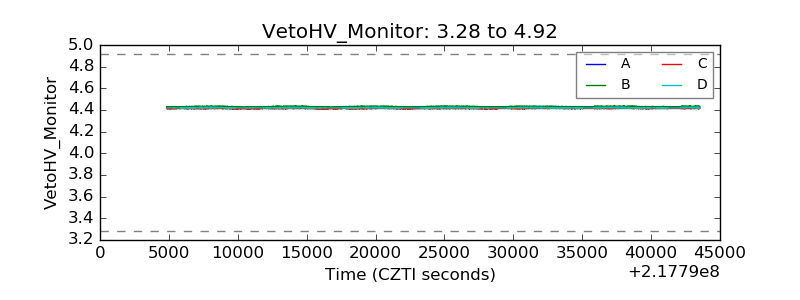 |
| Veto LLD |  |
| Alpha Counter | 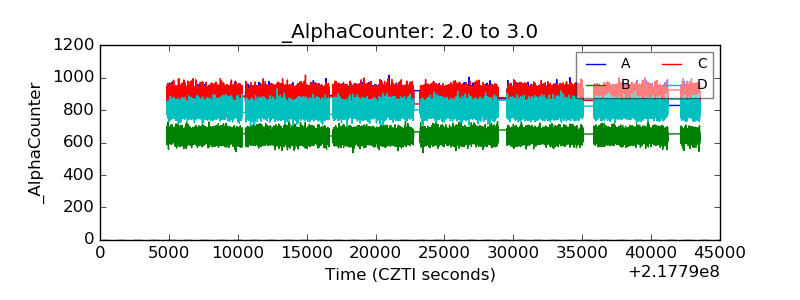 |
| _CPM_Rate | 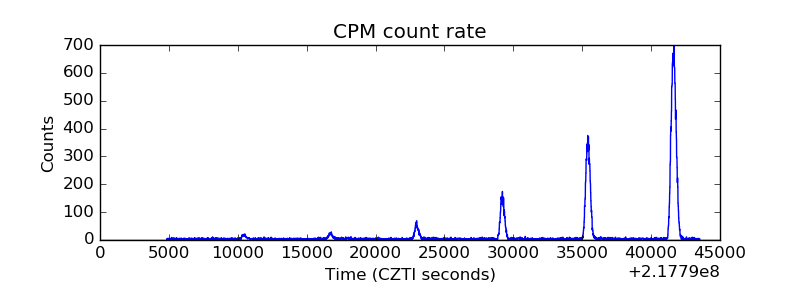 |
| CZT Counter | 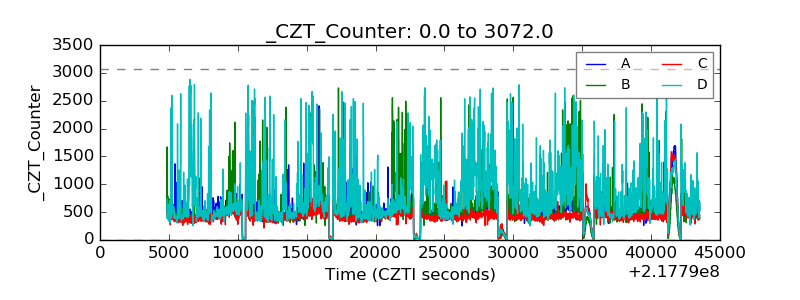 |
| +2.5 Volts monitor |  |
| +5 Volts monitor |  |
| _ROLL_ROT | 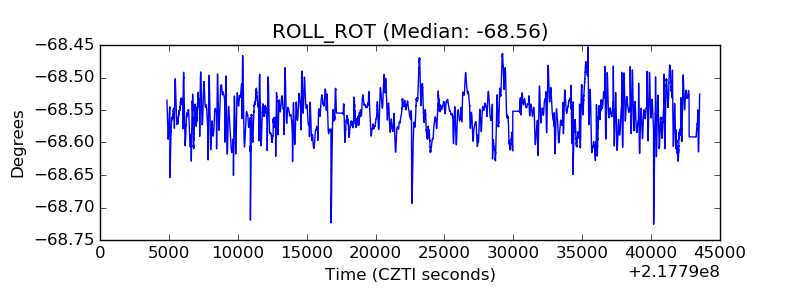 |
| _Roll_DEC | 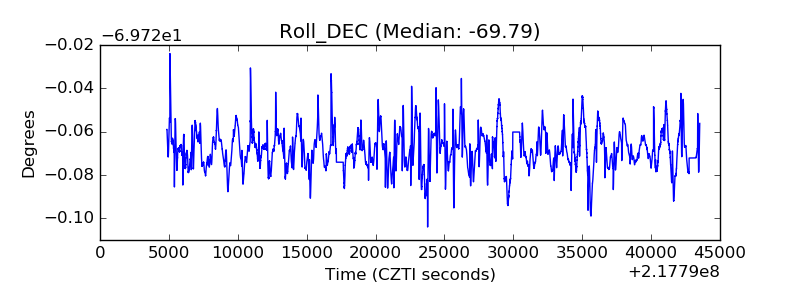 |
| _Roll_RA | 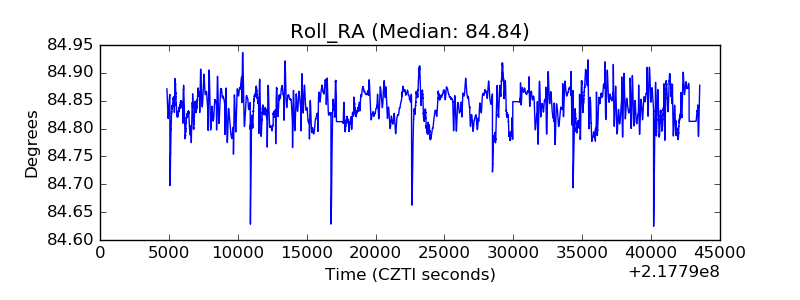 |
| Veto Counter | 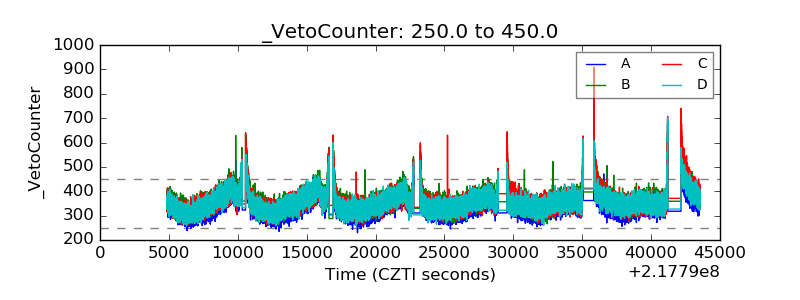 |