| Param | Original file | Final file |
|---|---|---|
| Filename | modeM0/AS1A02_118T01_9000000826_06293cztM0_level2.evt | modeM0/AS1A02_118T01_9000000826_06293cztM0_level2_quad_clean.evt |
| Size (bytes) | 586,998,720 | 100,313,280 |
| Size | 559.8 MB | 95.7 MB |
| Events in quadrant A | 3,812,437 | 659,864 |
| Events in quadrant B | 3,449,007 | 674,703 |
| Events in quadrant C | 2,807,874 | 668,152 |
| Events in quadrant D | 7,278,945 | 592,982 |
| Mode M9 | |||
|---|---|---|---|
| Quadrant | BADHDUFLAG | Total packets | Discarded packets |
| A | 0 | 10 | 0 |
| B | 0 | 10 | 0 |
| C | 0 | 10 | 0 |
| D | 0 | 10 | 0 |
| Mode SS | |||
|---|---|---|---|
| Quadrant | BADHDUFLAG | Total packets | Discarded packets |
| A | 0 | 130 | 0 |
| B | 0 | 130 | 0 |
| C | 0 | 130 | 0 |
| D | 0 | 130 | 0 |
| Mode M0 | |||
|---|---|---|---|
| Quadrant | BADHDUFLAG | Total packets | Discarded packets |
| A | 0 | 15378 | 3 |
| B | 0 | 14382 | 2 |
| C | 0 | 12845 | 2 |
| D | 0 | 26051 | 2 |
| Quadrant | Total seconds | Saturated seconds | Saturation percentage |
|---|---|---|---|
| A | 6333 | 52 | 0.821096% |
| B | 6333 | 165 | 2.605400% |
| C | 6333 | 39 | 0.615822% |
| D | 6333 | 986 | 15.569240% |
Noise dominated data is calculated using 1-second bins in cleaned event files. If a bin has >2000 counts, and if more than 50% of those come from <1% of pixels, then it is considered to be noise-dominated and hence unusable.
| Quadrant | # 1 sec bins | Bins with >0 counts | Bins with >2000 counts | High rate bins dominated by noise | Noise dominated (total time) | Noise dominated (detector-on time) | Marked lightcurve |
|---|---|---|---|---|---|---|---|
| A | 7408 | 6333 | 2 | 2 | 0.03% | 0.03% | 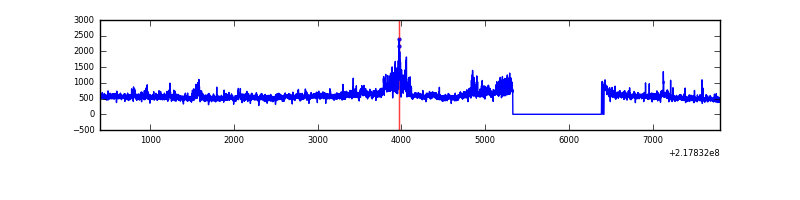 |
| B | 7408 | 6333 | 101 | 101 | 1.36% | 1.59% | 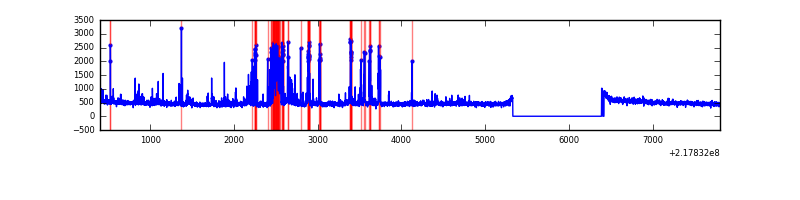 |
| C | 7408 | 6333 | 0 | 0 | 0.00% | 0.00% | 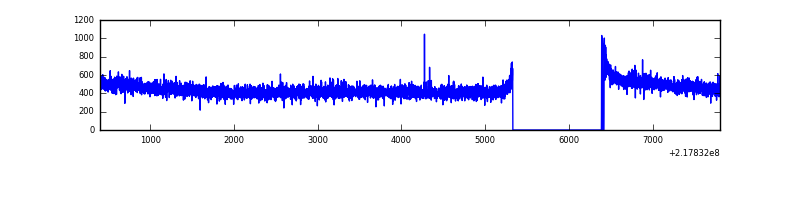 |
| D | 7408 | 6333 | 905 | 905 | 12.22% | 14.29% | 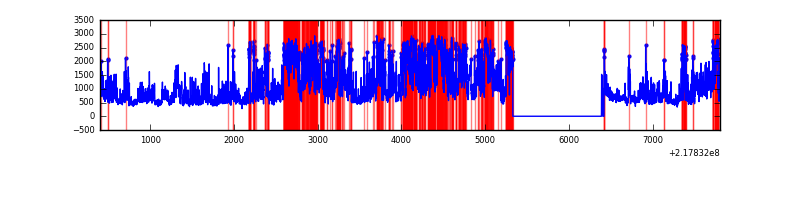 |
Top three noisy pixels from each quadrant. If the there are fewer than three noisy pixels in the level2.evt file, extra rows are filled as -1
| Pixel properties | Quadrant properties | ||||||
|---|---|---|---|---|---|---|---|
| Quadrant | DetID | PixID | Counts | Sigma | Mean | Median | Sigma |
| A | 15 | 236 | 551739 | 3735.14 | 726 | 711 | 147.5 |
| A | 8 | 15 | 454304 | 3074.68 | 726 | 711 | 147.5 |
| A | 13 | 14 | 11723 | 74.64 | 726 | 711 | 147.5 |
| B | 3 | 64 | 338890 | 2462.01 | 730 | 712 | 137.4 |
| B | 0 | 219 | 182459 | 1323.16 | 730 | 712 | 137.4 |
| B | 4 | 81 | 60536 | 435.53 | 730 | 712 | 137.4 |
| C | 13 | 61 | 5797 | 30.73 | 717 | 720 | 165.2 |
| C | 1 | 16 | 4479 | 22.75 | 717 | 720 | 165.2 |
| C | 9 | 54 | 3040 | 14.04 | 717 | 720 | 165.2 |
| D | 2 | 63 | 3546213 | 21787.21 | 672 | 652 | 162.7 |
| D | 12 | 220 | 699511 | 4294.44 | 672 | 652 | 162.7 |
| D | 2 | 152 | 133923 | 818.94 | 672 | 652 | 162.7 |
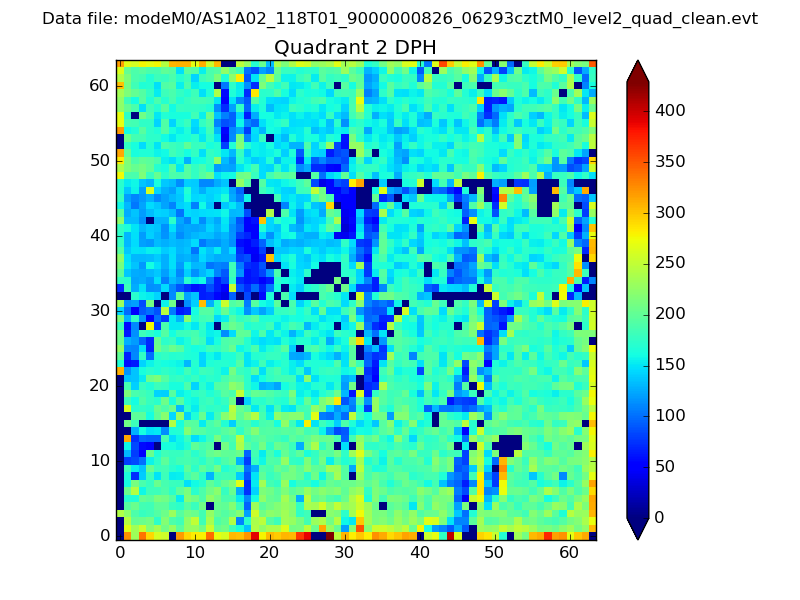
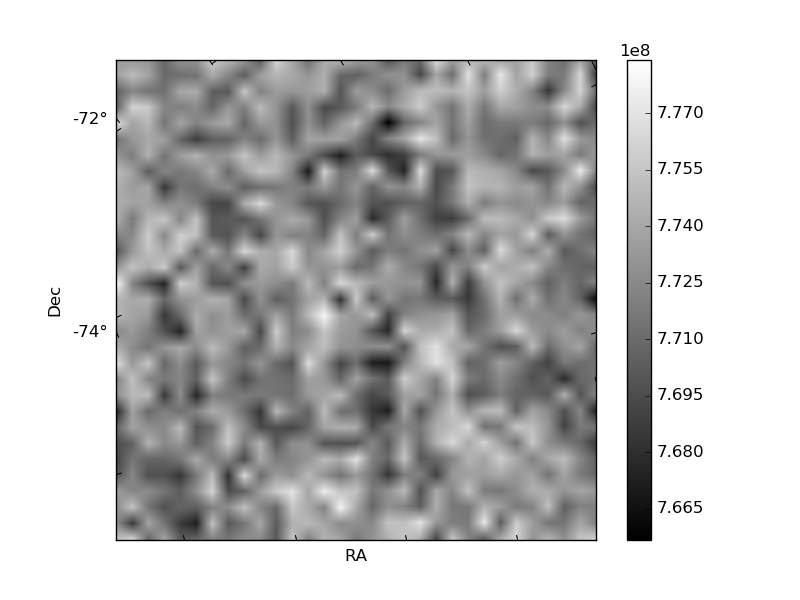
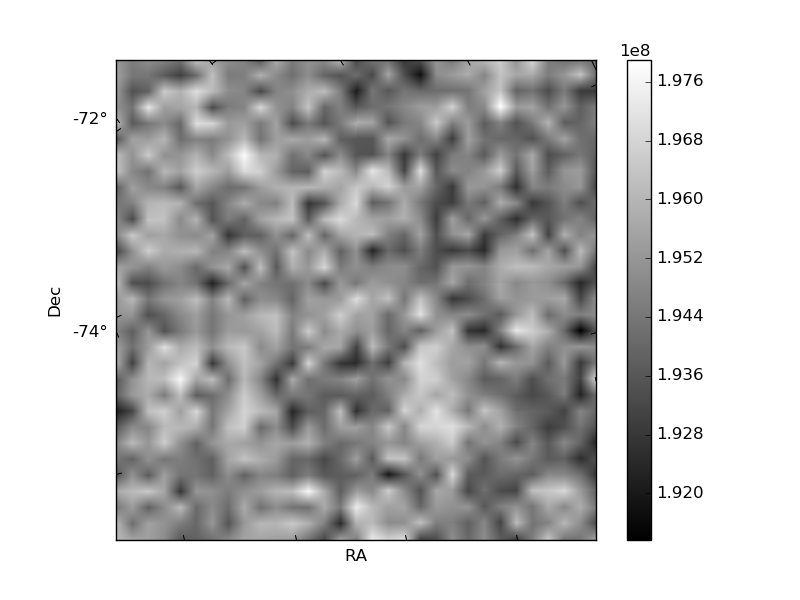
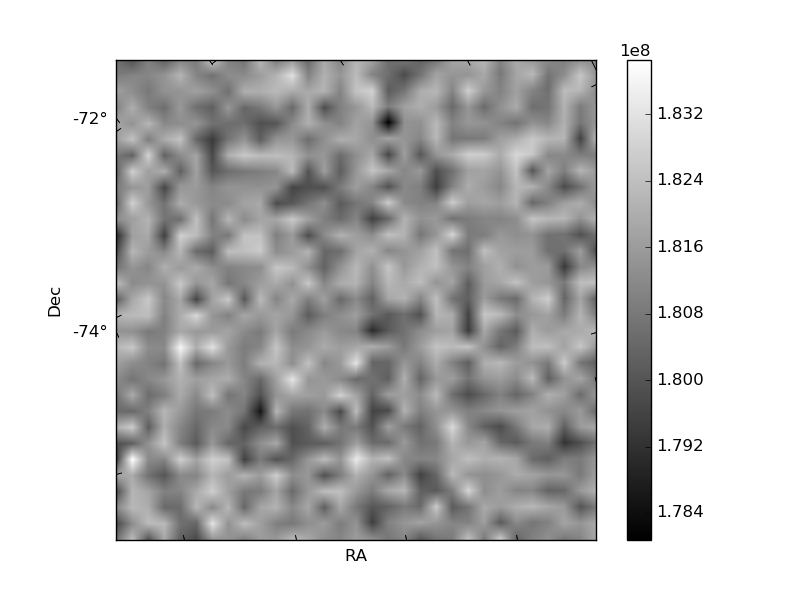
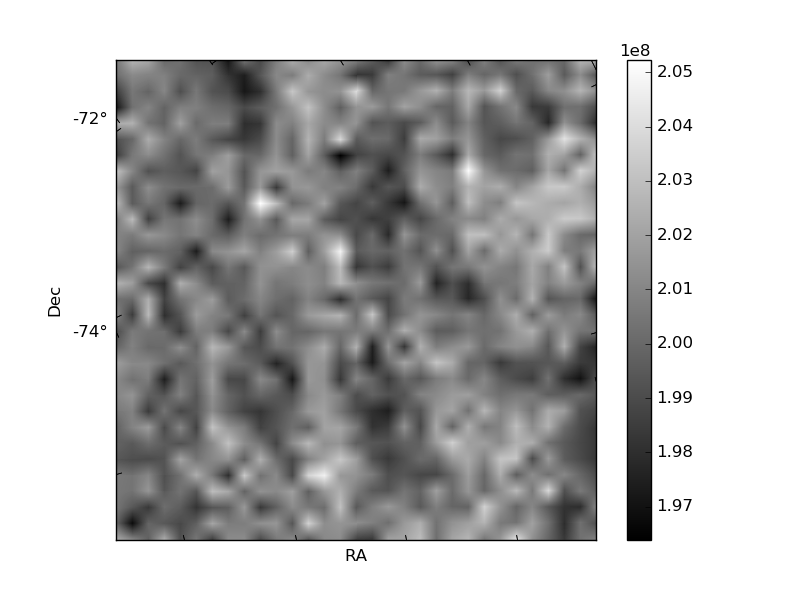
Histogram calculated using DETX and DETY for each event in the final _common_clean file
| Quadrant A | 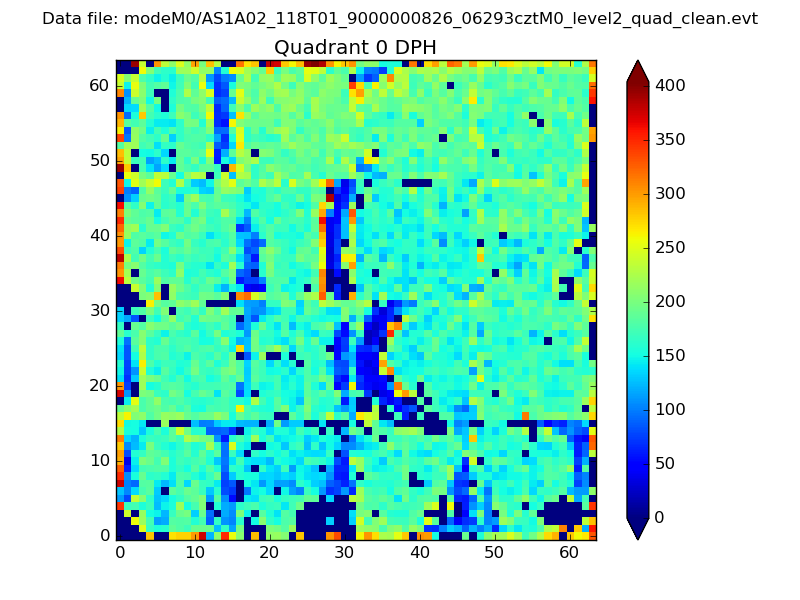 |
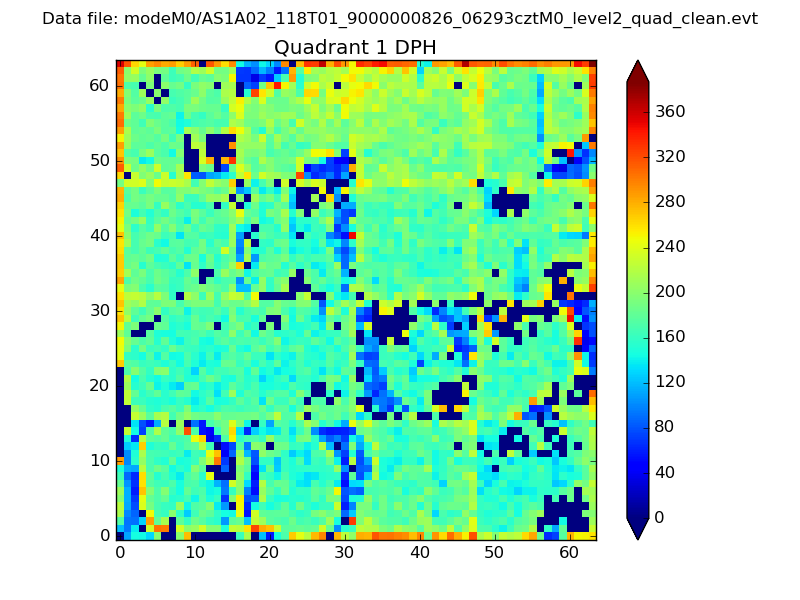 |
Quadrant B |
|---|---|---|---|
| Quadrant D | 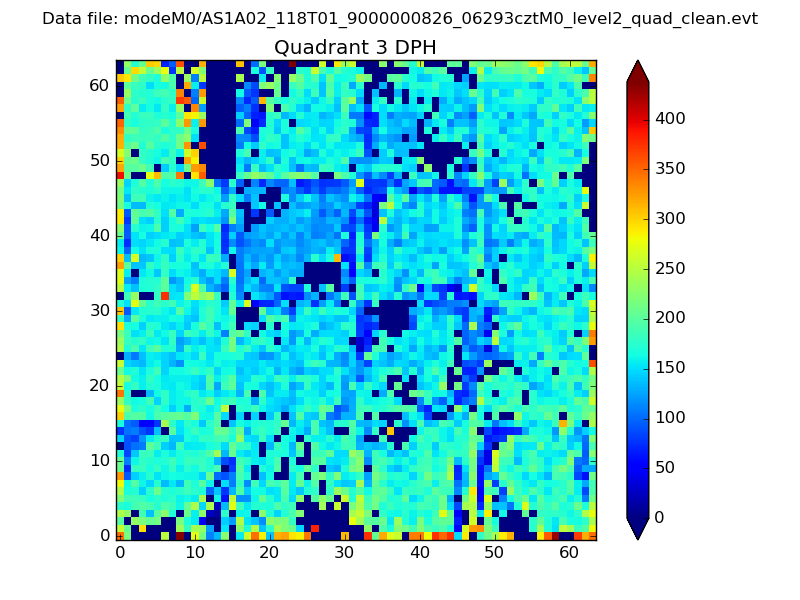 |
 |
Quadrant C |
| Plot type | Count rate plots | Images |
|---|---|---|
| Comparison with Poisson distribution Blue bars denote a histogram of data divided into 1 sec bins. Red curve is a Poisson curve with rate = median count rate of data. |
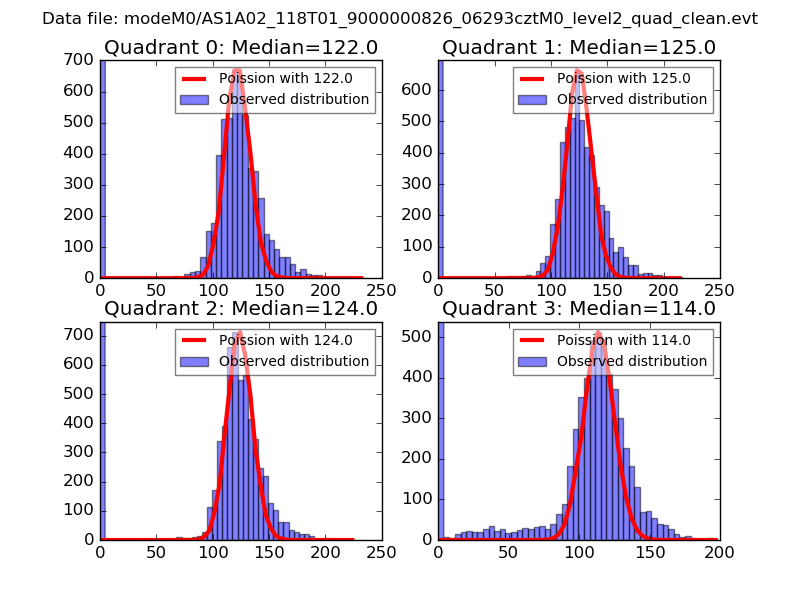 |
 |
| Quadrant-wise count rates Data is divided into 100 sec bins |
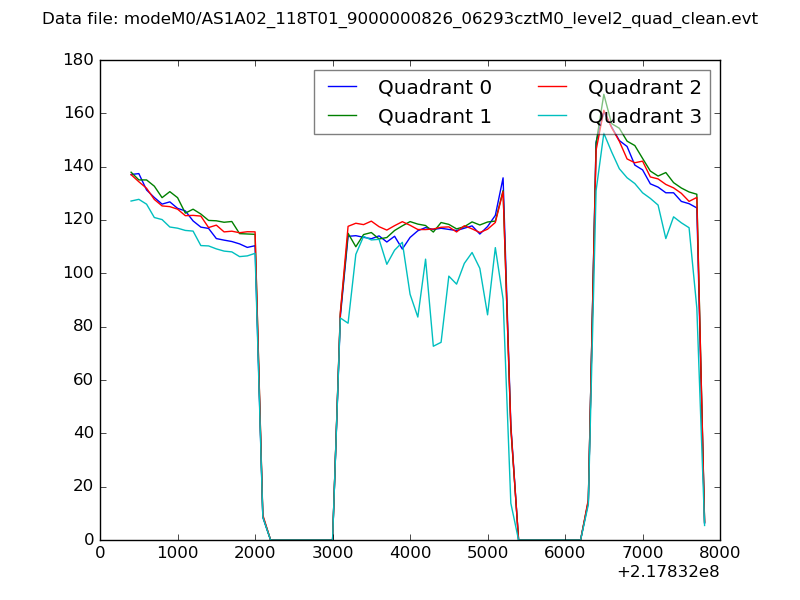 |
|
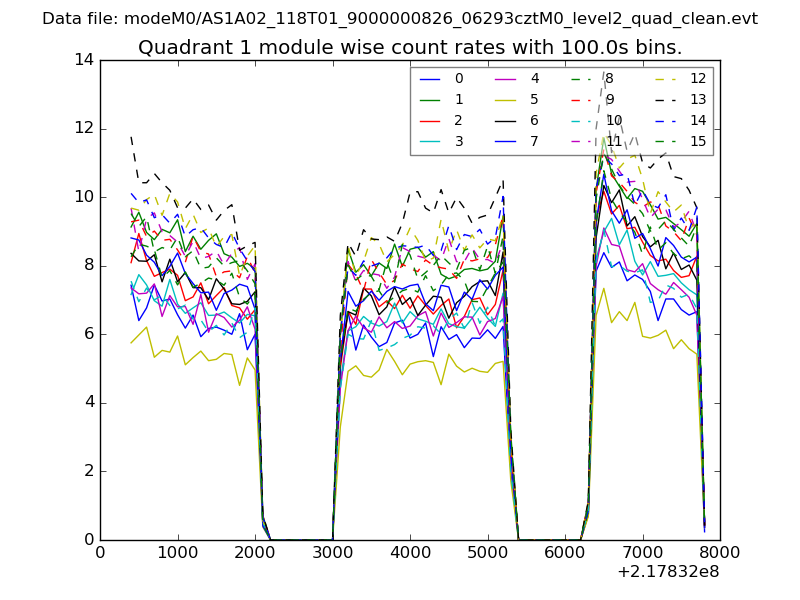
| Module-wise count rates for Quadrant A Data is divided into 100 sec bins |
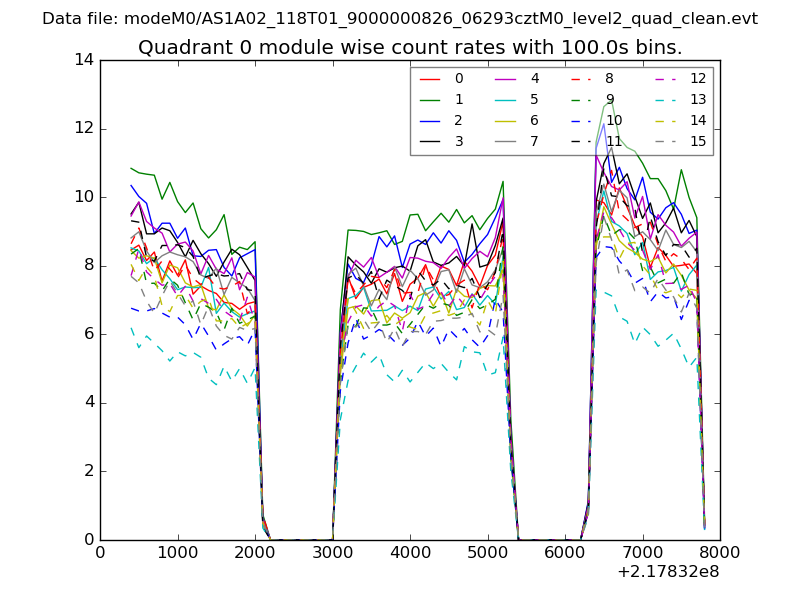 |
 |
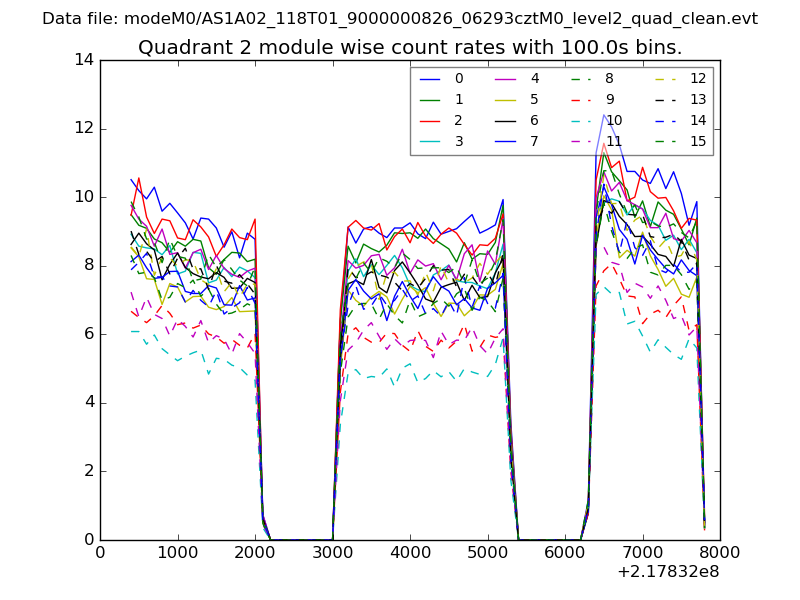
| Module-wise count rates for Quadrant B Data is divided into 100 sec bins |
 |
 |
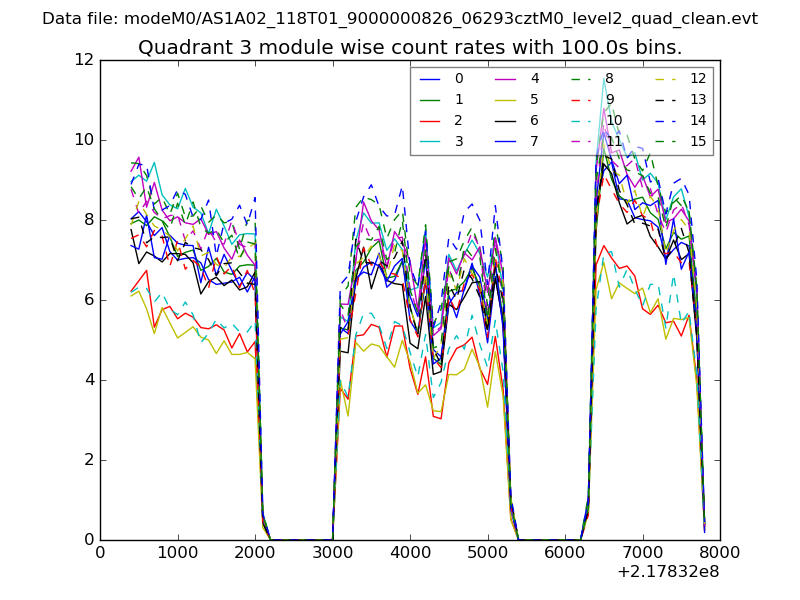
| Module-wise count rates for Quadrant C Data is divided into 100 sec bins |
 |
 |
| Module-wise count rates for Quadrant D Data is divided into 100 sec bins |
 |
 |
| Parameter | Plot |
|---|---|
| CZT HV Monitor |  |
| D_VDD | 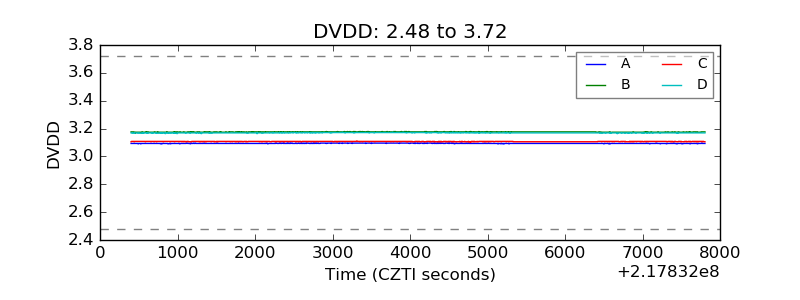 |
| Temperature 1 | 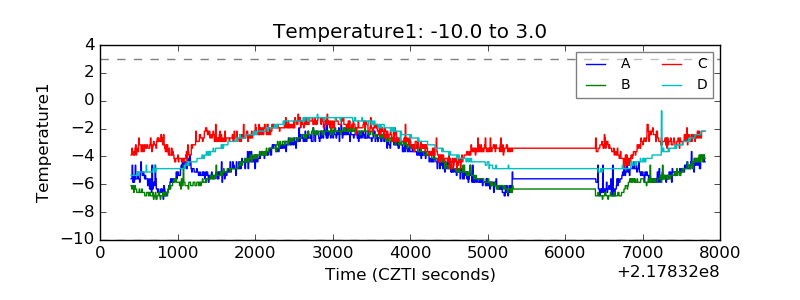 |
| Veto HV Monitor | 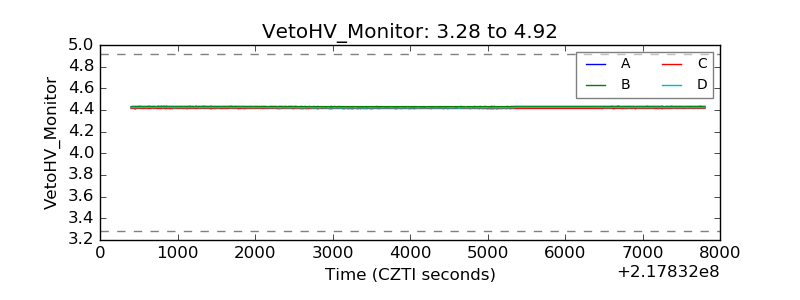 |
| Veto LLD | 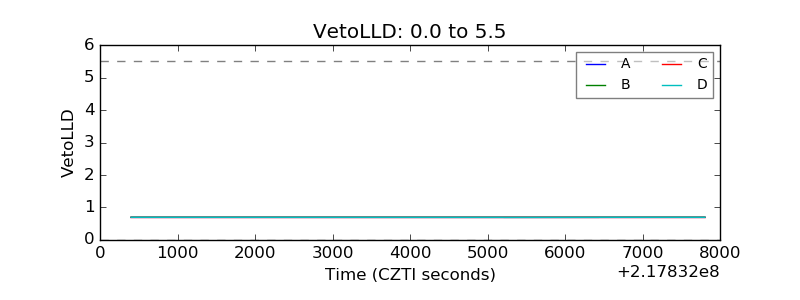 |
| Alpha Counter | 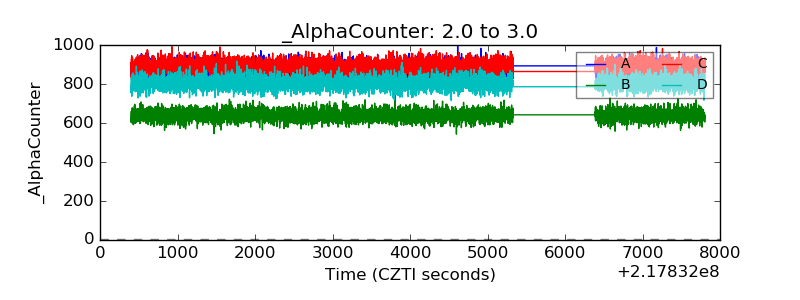 |
| _CPM_Rate | 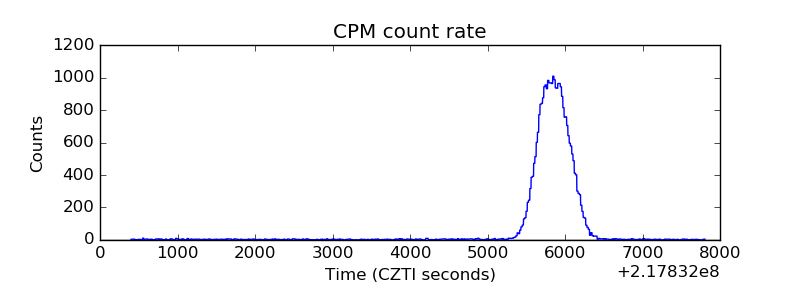 |
| CZT Counter | 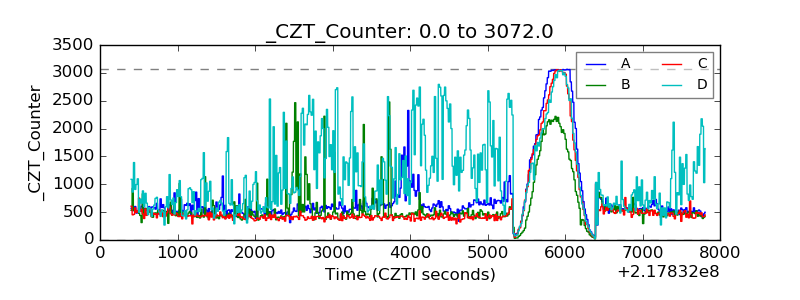 |
| +2.5 Volts monitor |  |
| +5 Volts monitor |  |
| _ROLL_ROT | 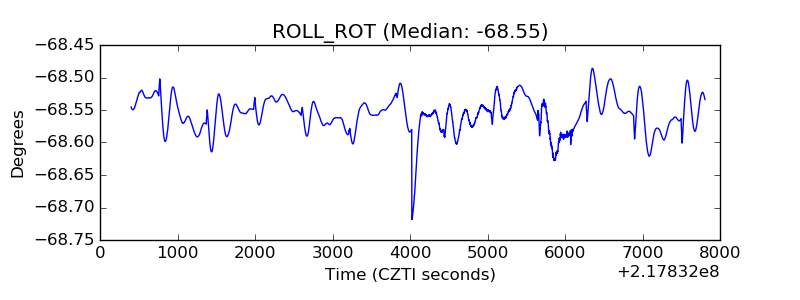 |
| _Roll_DEC | 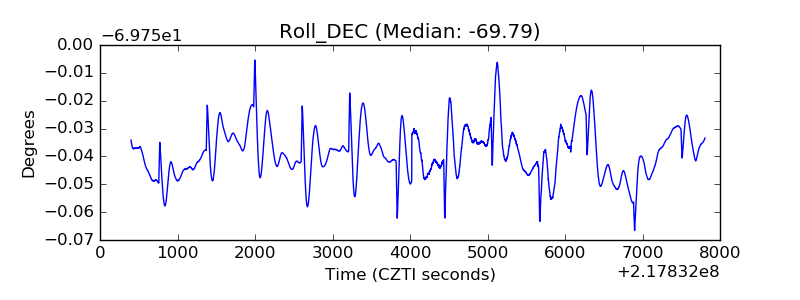 |
| _Roll_RA | 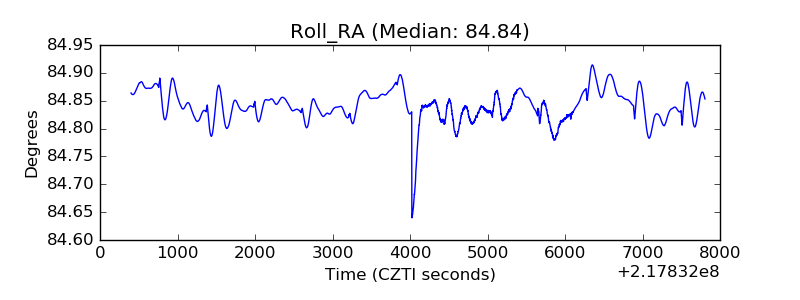 |
| Veto Counter | 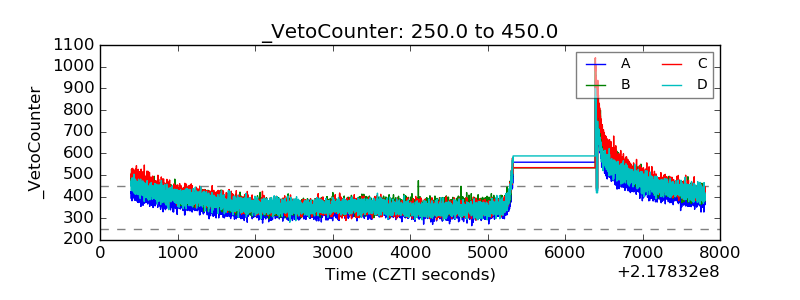 |