| Param | Original file | Final file |
|---|---|---|
| Filename | modeM0/AS1A02_118T01_9000000826_06294cztM0_level2.evt | modeM0/AS1A02_118T01_9000000826_06294cztM0_level2_quad_clean.evt |
| Size (bytes) | 554,621,760 | 91,031,040 |
| Size | 528.9 MB | 86.8 MB |
| Events in quadrant A | 3,245,144 | 599,789 |
| Events in quadrant B | 3,132,484 | 610,038 |
| Events in quadrant C | 2,704,838 | 606,651 |
| Events in quadrant D | 7,315,418 | 528,347 |
| Mode M9 | |||
|---|---|---|---|
| Quadrant | BADHDUFLAG | Total packets | Discarded packets |
| A | 0 | 11 | 0 |
| B | 0 | 11 | 0 |
| C | 0 | 11 | 0 |
| D | 0 | 11 | 0 |
| Mode SS | |||
|---|---|---|---|
| Quadrant | BADHDUFLAG | Total packets | Discarded packets |
| A | 0 | 122 | 0 |
| B | 0 | 122 | 0 |
| C | 0 | 122 | 0 |
| D | 0 | 122 | 0 |
| Mode M0 | |||
|---|---|---|---|
| Quadrant | BADHDUFLAG | Total packets | Discarded packets |
| A | 0 | 13223 | 2 |
| B | 0 | 13118 | 1 |
| C | 0 | 12177 | 1 |
| D | 0 | 25872 | 1 |
| Quadrant | Total seconds | Saturated seconds | Saturation percentage |
|---|---|---|---|
| A | 5882 | 71 | 1.207072% |
| B | 5882 | 177 | 3.009181% |
| C | 5882 | 52 | 0.884053% |
| D | 5882 | 1013 | 17.222033% |
Noise dominated data is calculated using 1-second bins in cleaned event files. If a bin has >2000 counts, and if more than 50% of those come from <1% of pixels, then it is considered to be noise-dominated and hence unusable.
| Quadrant | # 1 sec bins | Bins with >0 counts | Bins with >2000 counts | High rate bins dominated by noise | Noise dominated (total time) | Noise dominated (detector-on time) | Marked lightcurve |
|---|---|---|---|---|---|---|---|
| A | 7042 | 5882 | 2 | 2 | 0.03% | 0.03% | 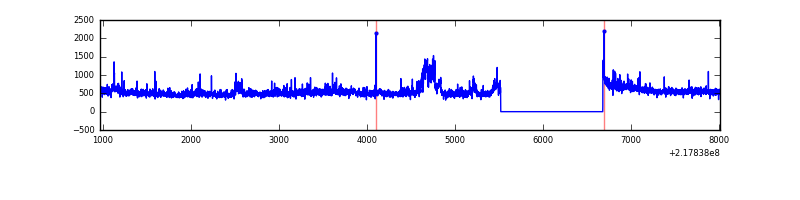 |
| B | 7042 | 5882 | 86 | 86 | 1.22% | 1.46% | 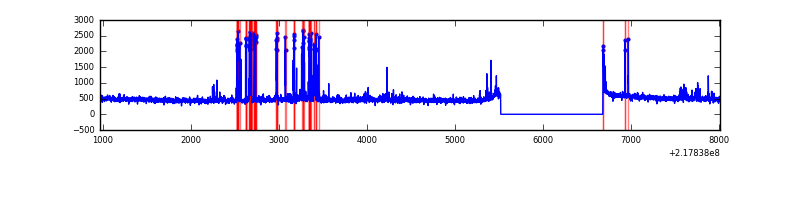 |
| C | 7042 | 5882 | 0 | 0 | 0.00% | 0.00% | 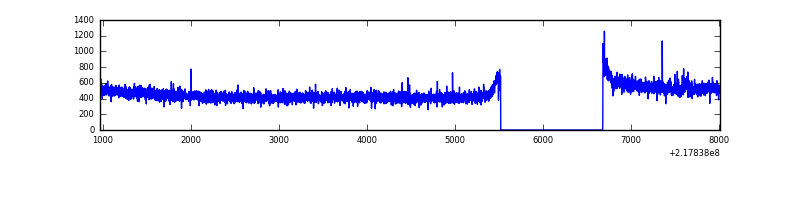 |
| D | 7042 | 5882 | 867 | 867 | 12.31% | 14.74% | 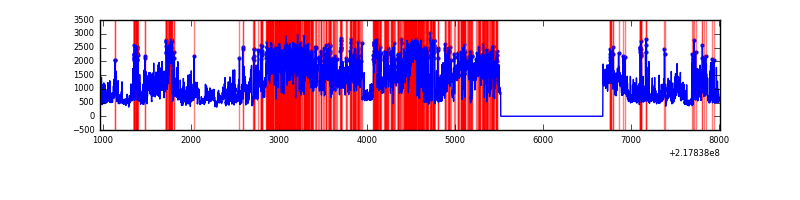 |
Top three noisy pixels from each quadrant. If the there are fewer than three noisy pixels in the level2.evt file, extra rows are filled as -1
| Pixel properties | Quadrant properties | ||||||
|---|---|---|---|---|---|---|---|
| Quadrant | DetID | PixID | Counts | Sigma | Mean | Median | Sigma |
| A | 15 | 236 | 299141 | 2133.16 | 693 | 679 | 139.9 |
| A | 14 | 111 | 147823 | 1051.66 | 693 | 679 | 139.9 |
| A | 8 | 15 | 104342 | 740.9 | 693 | 679 | 139.9 |
| B | 0 | 219 | 342901 | 2661.01 | 691 | 674 | 128.6 |
| B | 15 | 204 | 52000 | 399.09 | 691 | 674 | 128.6 |
| B | 4 | 81 | 29491 | 224.07 | 691 | 674 | 128.6 |
| C | 1 | 16 | 58900 | 374.87 | 677 | 680 | 155.3 |
| C | 13 | 61 | 5396 | 30.37 | 677 | 680 | 155.3 |
| C | 8 | 222 | 1972 | 8.32 | 677 | 680 | 155.3 |
| D | 2 | 63 | 3763004 | 24061.16 | 644 | 625 | 156.4 |
| D | 12 | 220 | 340559 | 2173.95 | 644 | 625 | 156.4 |
| D | 12 | 110 | 232196 | 1480.94 | 644 | 625 | 156.4 |
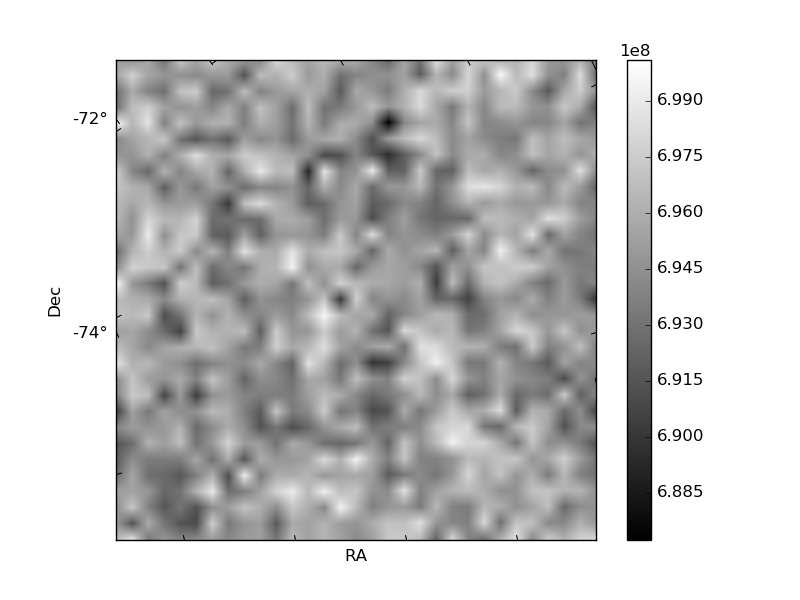
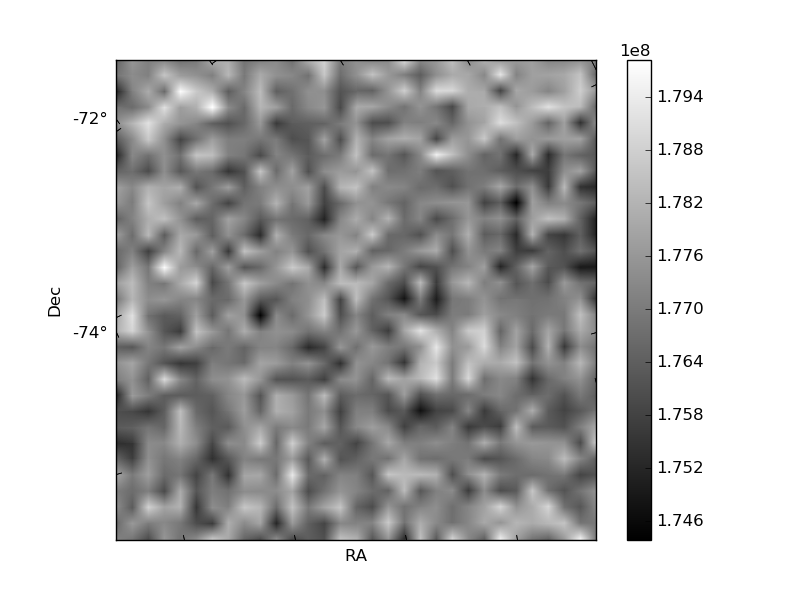
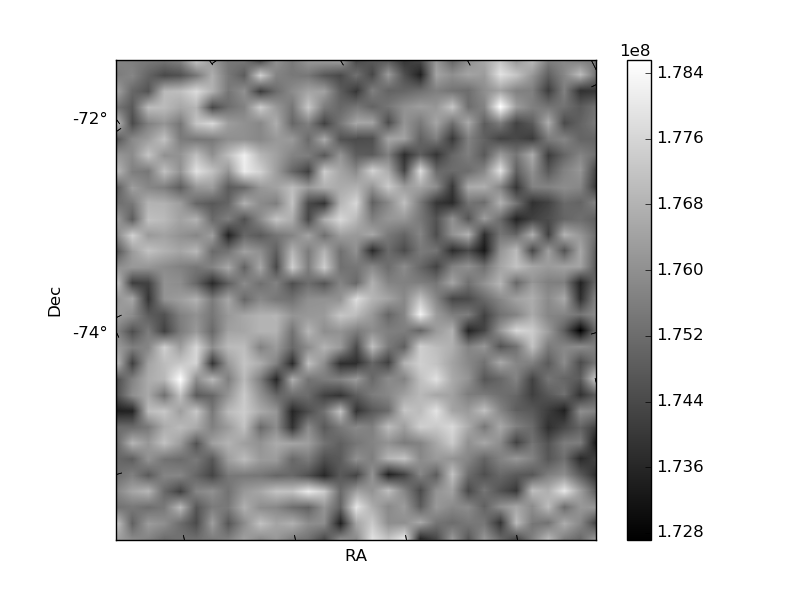
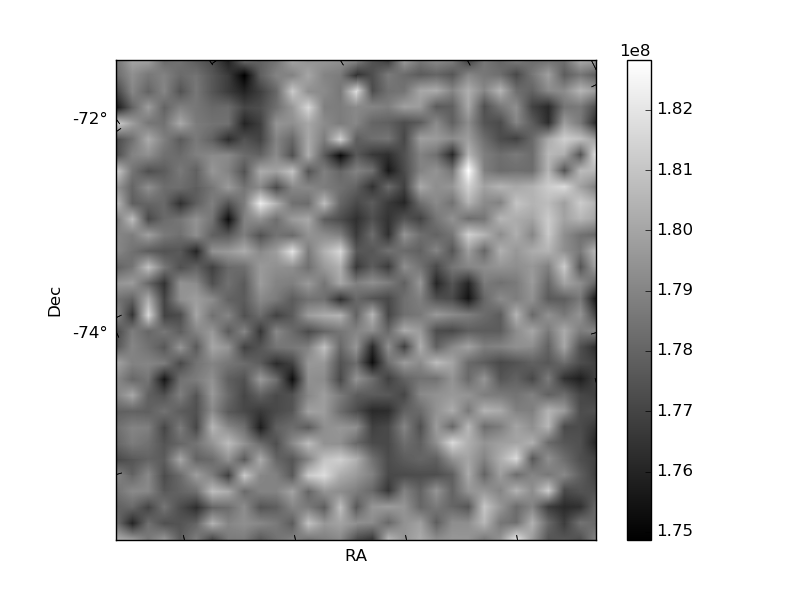
Histogram calculated using DETX and DETY for each event in the final _common_clean file
| Quadrant A | 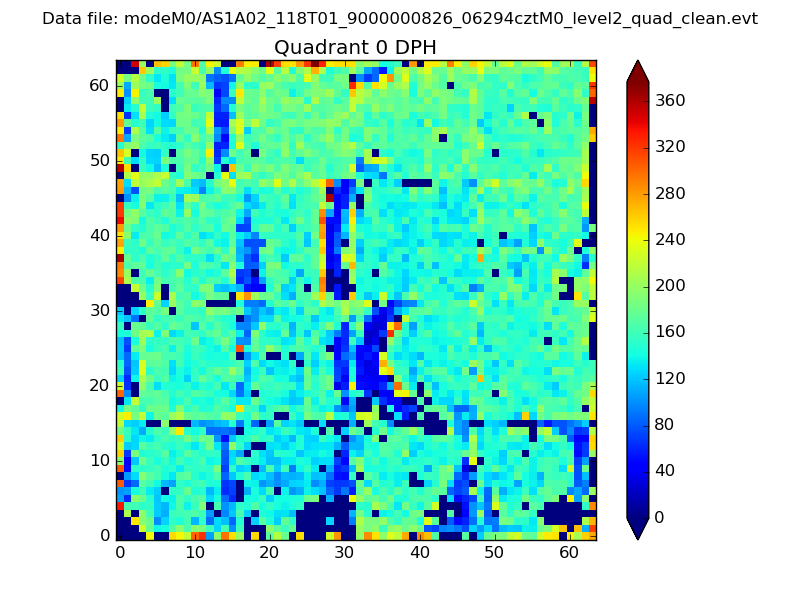 |
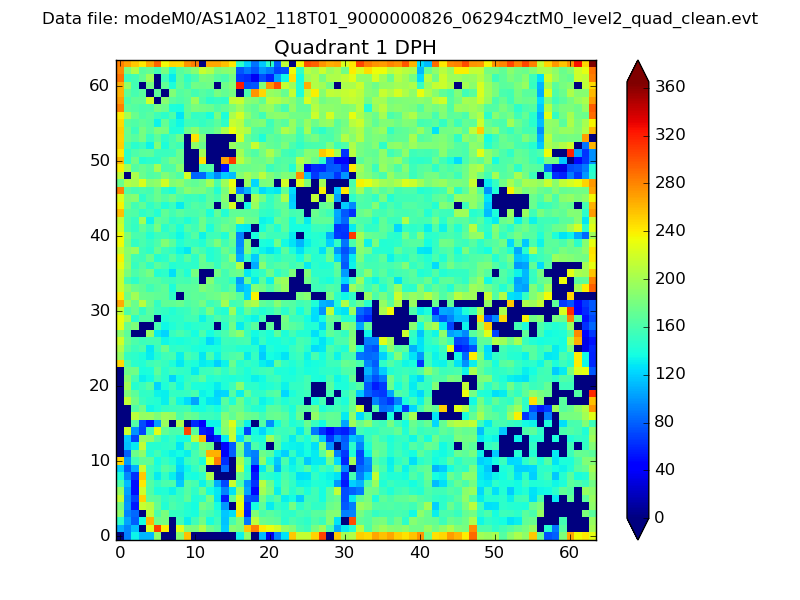 |
Quadrant B |
|---|---|---|---|
| Quadrant D | 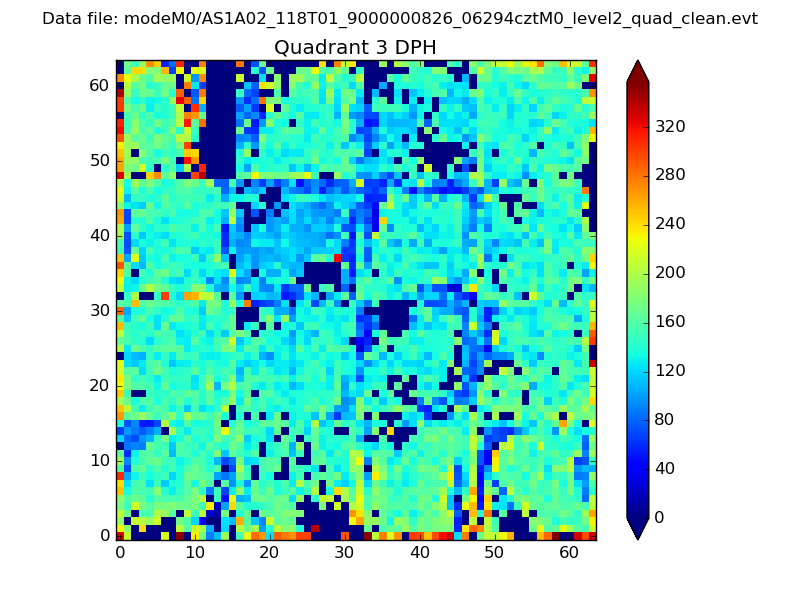 |
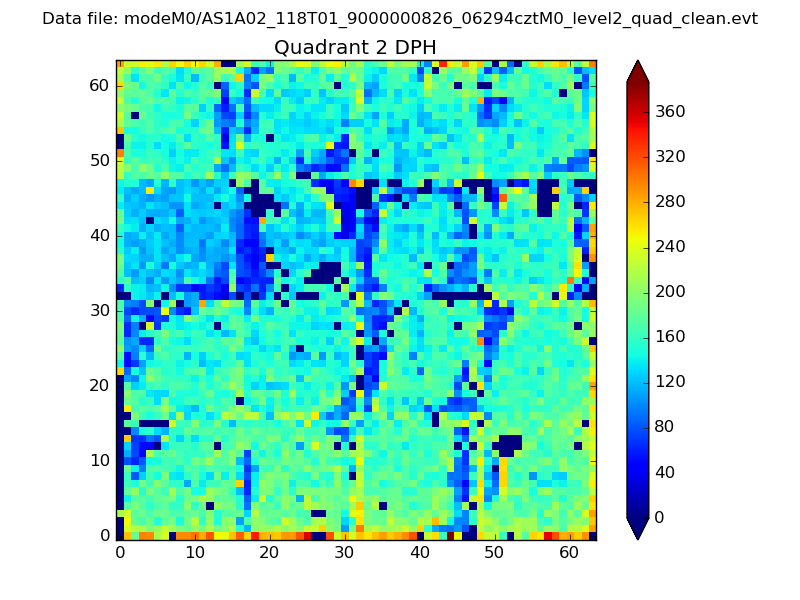 |
Quadrant C |
| Plot type | Count rate plots | Images |
|---|---|---|
| Comparison with Poisson distribution Blue bars denote a histogram of data divided into 1 sec bins. Red curve is a Poisson curve with rate = median count rate of data. |
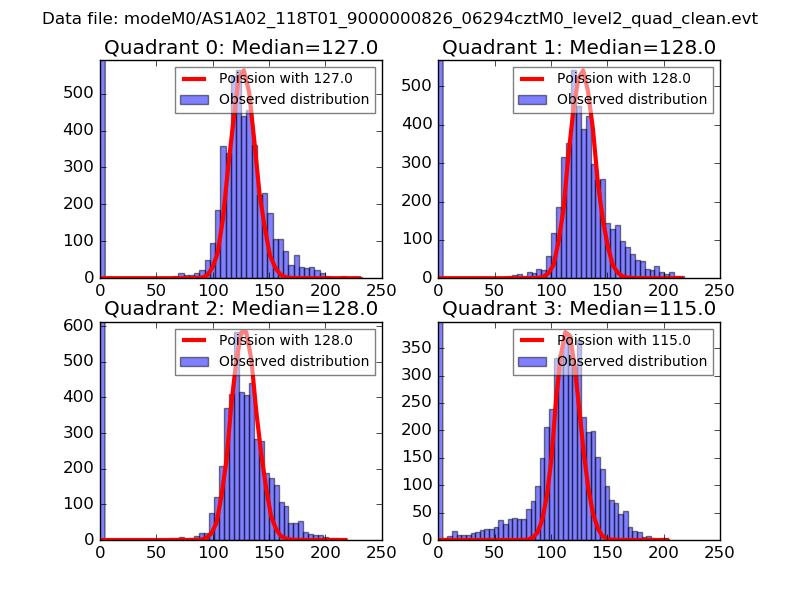 |
 |
| Quadrant-wise count rates Data is divided into 100 sec bins |
 |
|
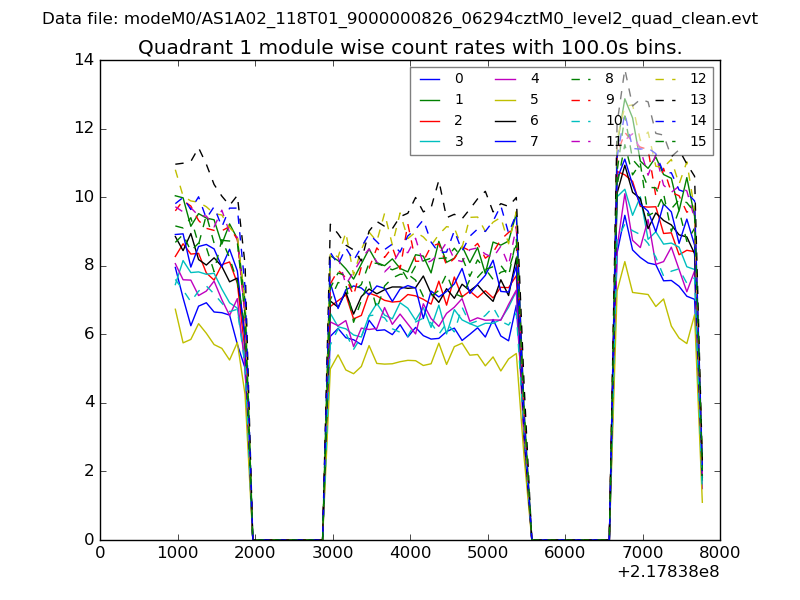
| Module-wise count rates for Quadrant A Data is divided into 100 sec bins |
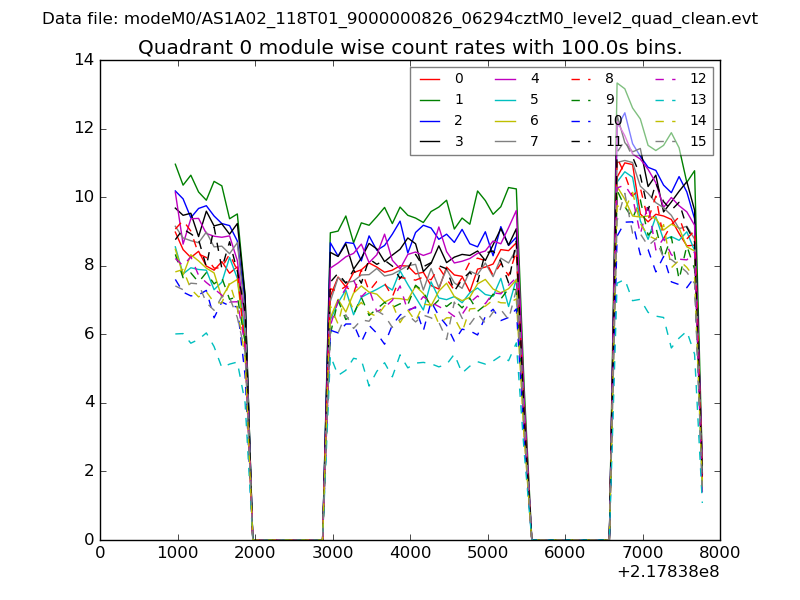 |
 |
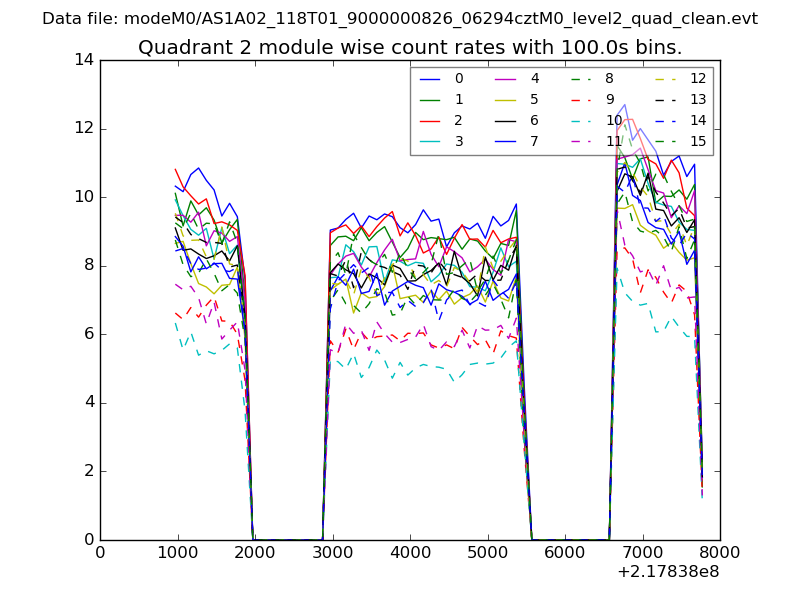
| Module-wise count rates for Quadrant B Data is divided into 100 sec bins |
 |
 |
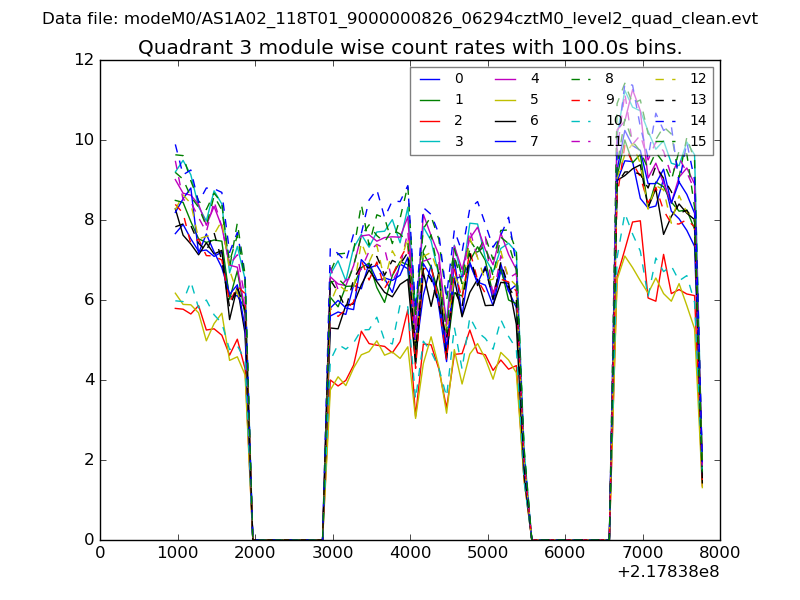
| Module-wise count rates for Quadrant C Data is divided into 100 sec bins |
 |
 |
| Module-wise count rates for Quadrant D Data is divided into 100 sec bins |
 |
 |
| Parameter | Plot |
|---|---|
| CZT HV Monitor | 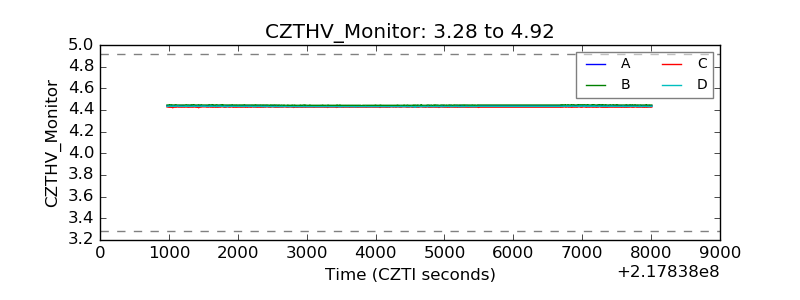 |
| D_VDD | 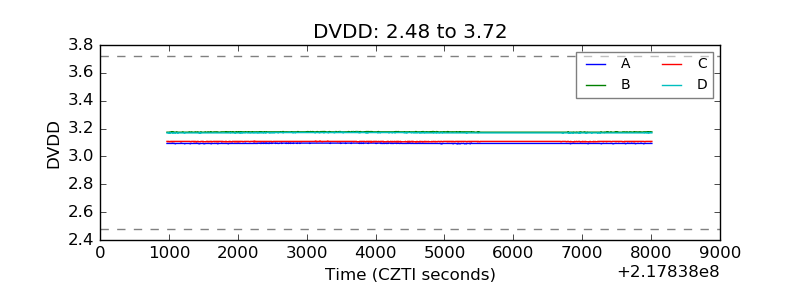 |
| Temperature 1 | 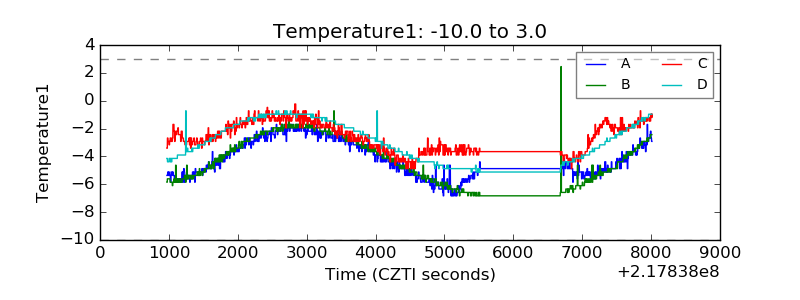 |
| Veto HV Monitor | 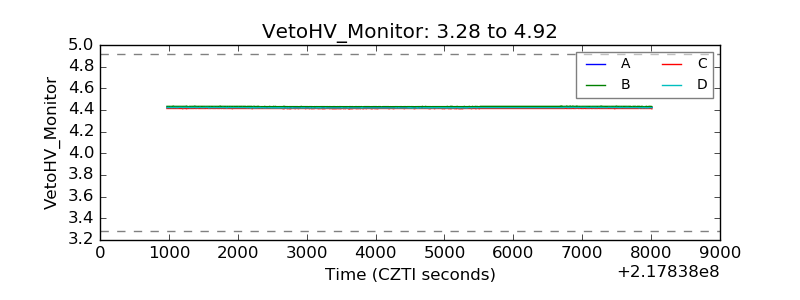 |
| Veto LLD | 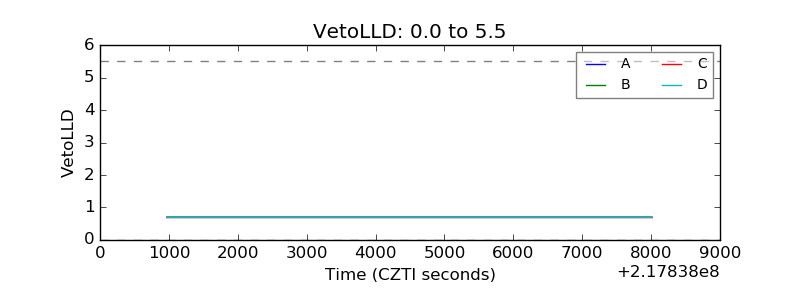 |
| Alpha Counter |  |
| _CPM_Rate |  |
| CZT Counter | 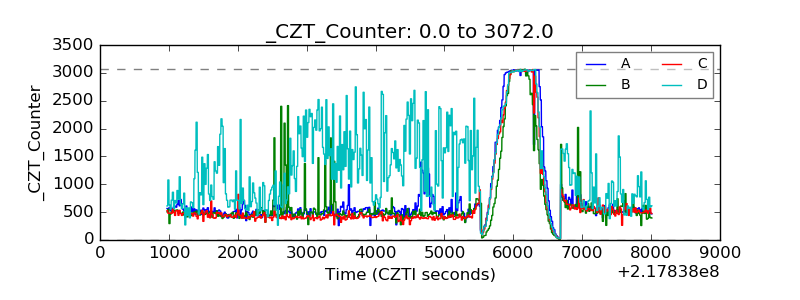 |
| +2.5 Volts monitor |  |
| +5 Volts monitor |  |
| _ROLL_ROT | 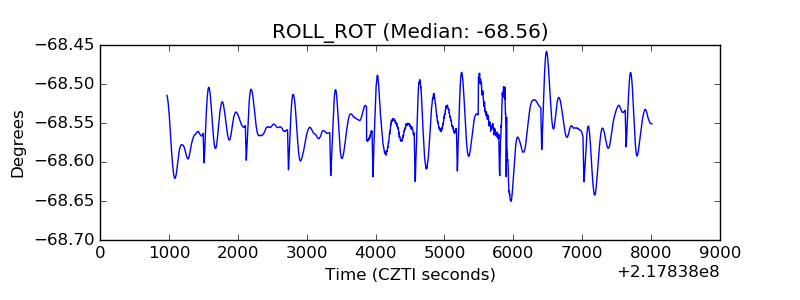 |
| _Roll_DEC |  |
| _Roll_RA | 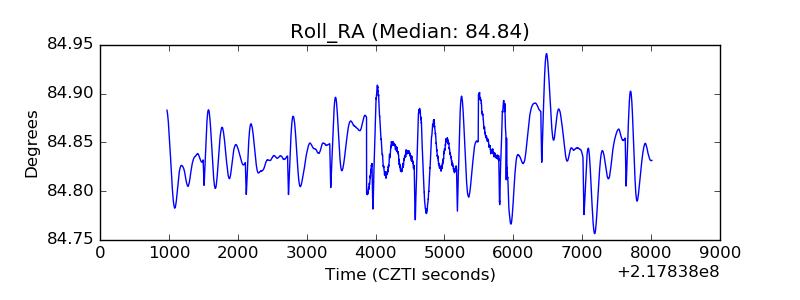 |
| Veto Counter | 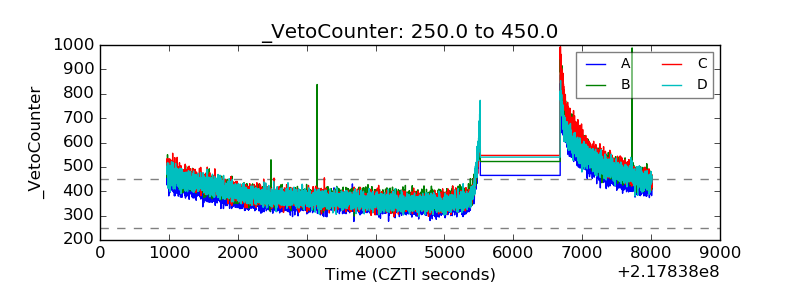 |