| Param | Original file | Final file |
|---|---|---|
| Filename | modeM0/AS1A02_118T01_9000000826_06295cztM0_level2.evt | modeM0/AS1A02_118T01_9000000826_06295cztM0_level2_quad_clean.evt |
| Size (bytes) | 636,874,560 | 90,812,160 |
| Size | 607.4 MB | 86.6 MB |
| Events in quadrant A | 4,642,693 | 593,636 |
| Events in quadrant B | 4,173,254 | 581,989 |
| Events in quadrant C | 2,962,541 | 603,094 |
| Events in quadrant D | 7,095,122 | 543,160 |
| Mode M9 | |||
|---|---|---|---|
| Quadrant | BADHDUFLAG | Total packets | Discarded packets |
| A | 0 | 13 | 0 |
| B | 0 | 13 | 0 |
| C | 0 | 13 | 0 |
| D | 0 | 13 | 0 |
| Mode SS | |||
|---|---|---|---|
| Quadrant | BADHDUFLAG | Total packets | Discarded packets |
| A | 0 | 124 | 0 |
| B | 0 | 124 | 0 |
| C | 0 | 124 | 0 |
| D | 0 | 124 | 0 |
| Mode M0 | |||
|---|---|---|---|
| Quadrant | BADHDUFLAG | Total packets | Discarded packets |
| A | 0 | 18099 | 2 |
| B | 0 | 16271 | 1 |
| C | 0 | 12779 | 1 |
| D | 0 | 25351 | 1 |
| Quadrant | Total seconds | Saturated seconds | Saturation percentage |
|---|---|---|---|
| A | 6129 | 130 | 2.121064% |
| B | 6129 | 503 | 8.206885% |
| C | 6129 | 74 | 1.207375% |
| D | 6129 | 960 | 15.663240% |
Noise dominated data is calculated using 1-second bins in cleaned event files. If a bin has >2000 counts, and if more than 50% of those come from <1% of pixels, then it is considered to be noise-dominated and hence unusable.
| Quadrant | # 1 sec bins | Bins with >0 counts | Bins with >2000 counts | High rate bins dominated by noise | Noise dominated (total time) | Noise dominated (detector-on time) | Marked lightcurve |
|---|---|---|---|---|---|---|---|
| A | 7354 | 6129 | 8 | 8 | 0.11% | 0.13% |  |
| B | 7354 | 6129 | 272 | 272 | 3.70% | 4.44% | 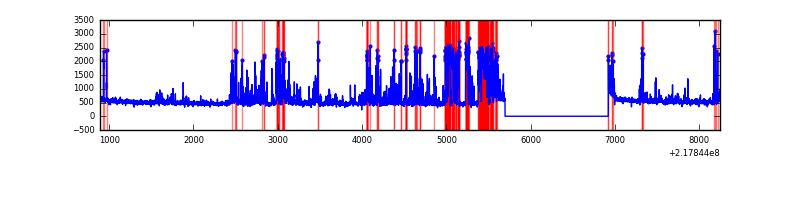 |
| C | 7354 | 6129 | 1 | 1 | 0.01% | 0.02% | 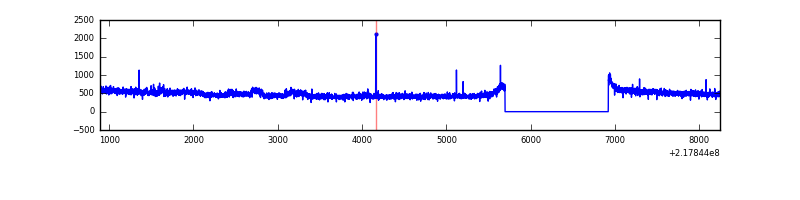 |
| D | 7353 | 6128 | 859 | 859 | 11.68% | 14.02% | 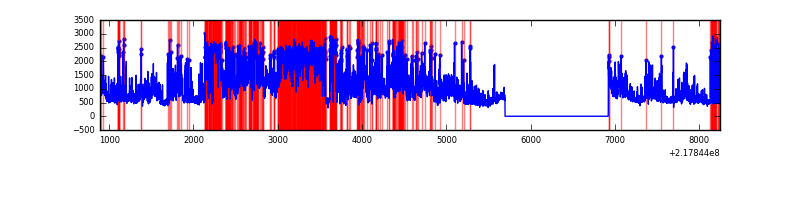 |
Top three noisy pixels from each quadrant. If the there are fewer than three noisy pixels in the level2.evt file, extra rows are filled as -1
| Pixel properties | Quadrant properties | ||||||
|---|---|---|---|---|---|---|---|
| Quadrant | DetID | PixID | Counts | Sigma | Mean | Median | Sigma |
| A | 8 | 15 | 950519 | 6378.9 | 744 | 729 | 148.9 |
| A | 15 | 236 | 809143 | 5429.4 | 744 | 729 | 148.9 |
| A | 13 | 251 | 19262 | 124.47 | 744 | 729 | 148.9 |
| B | 3 | 64 | 965086 | 7188.52 | 724 | 708 | 134.2 |
| B | 0 | 219 | 189879 | 1410.09 | 724 | 708 | 134.2 |
| B | 4 | 81 | 109368 | 809.96 | 724 | 708 | 134.2 |
| C | 1 | 16 | 116342 | 701.56 | 727 | 731 | 164.8 |
| C | 9 | 54 | 7320 | 39.98 | 727 | 731 | 164.8 |
| C | 13 | 61 | 5720 | 30.27 | 727 | 731 | 164.8 |
| D | 2 | 63 | 3124607 | 18658.71 | 694 | 673 | 167.4 |
| D | 12 | 220 | 661313 | 3945.89 | 694 | 673 | 167.4 |
| D | 12 | 110 | 206264 | 1227.96 | 694 | 673 | 167.4 |
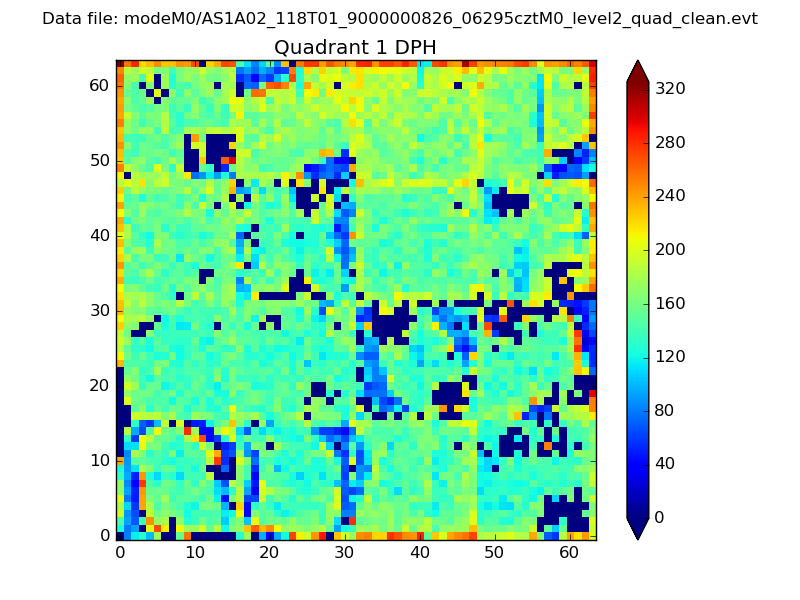
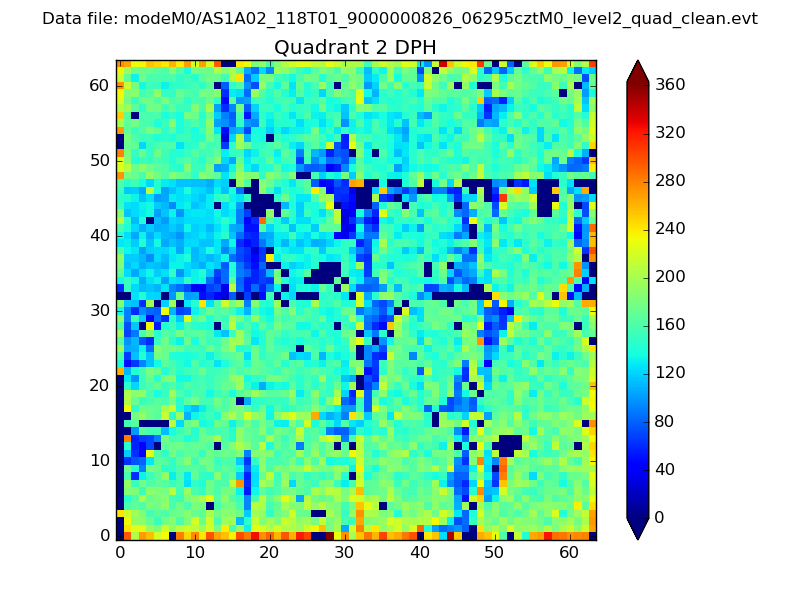
Histogram calculated using DETX and DETY for each event in the final _common_clean file
| Quadrant A |  |
 |
Quadrant B |
|---|---|---|---|
| Quadrant D | 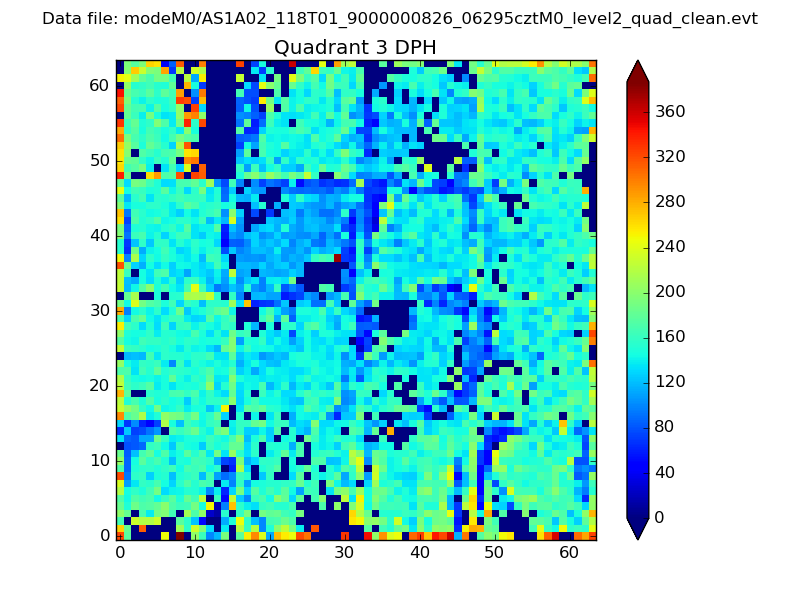 |
 |
Quadrant C |
| Plot type | Count rate plots | Images |
|---|---|---|
| Comparison with Poisson distribution Blue bars denote a histogram of data divided into 1 sec bins. Red curve is a Poisson curve with rate = median count rate of data. |
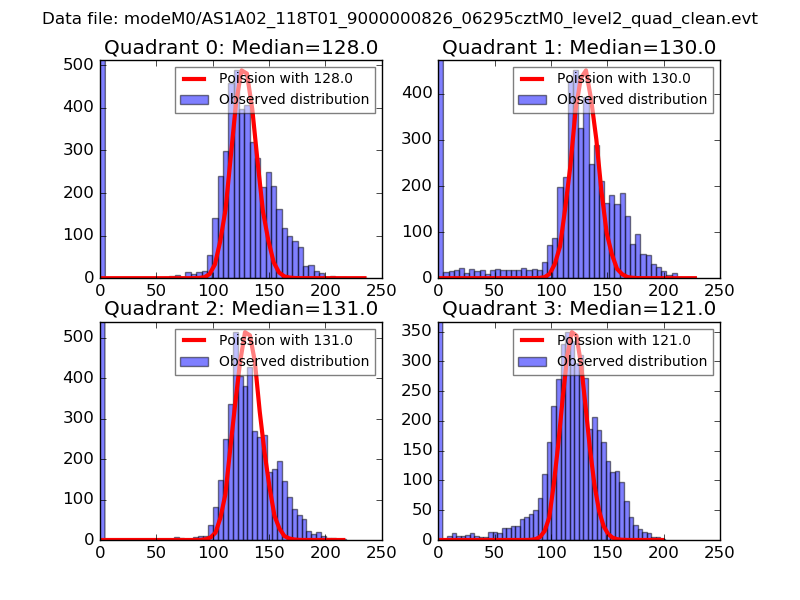 |
 |
| Quadrant-wise count rates Data is divided into 100 sec bins |
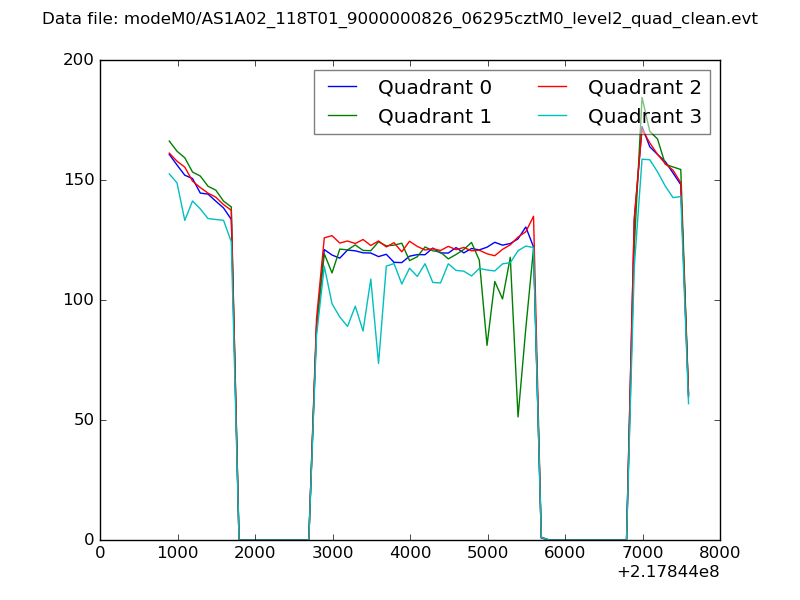 |
|
| Module-wise count rates for Quadrant A Data is divided into 100 sec bins |
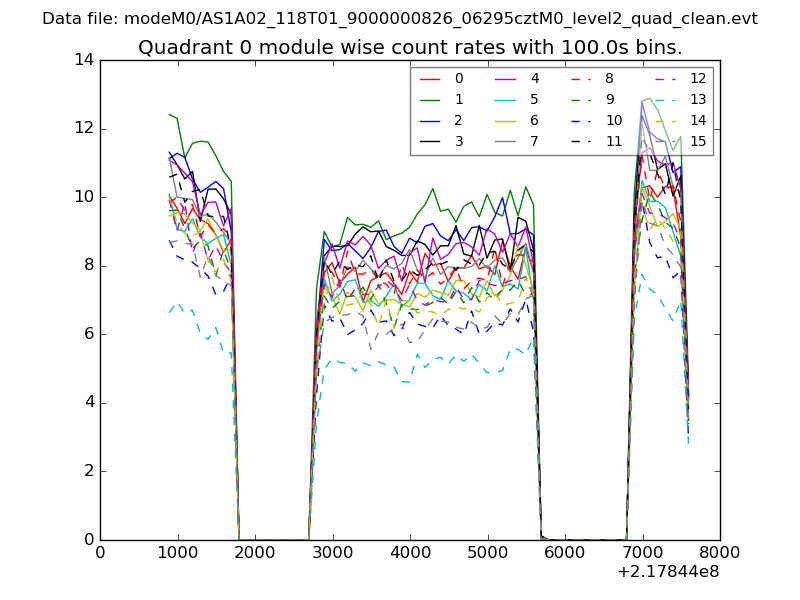 |
 |
| Module-wise count rates for Quadrant B Data is divided into 100 sec bins |
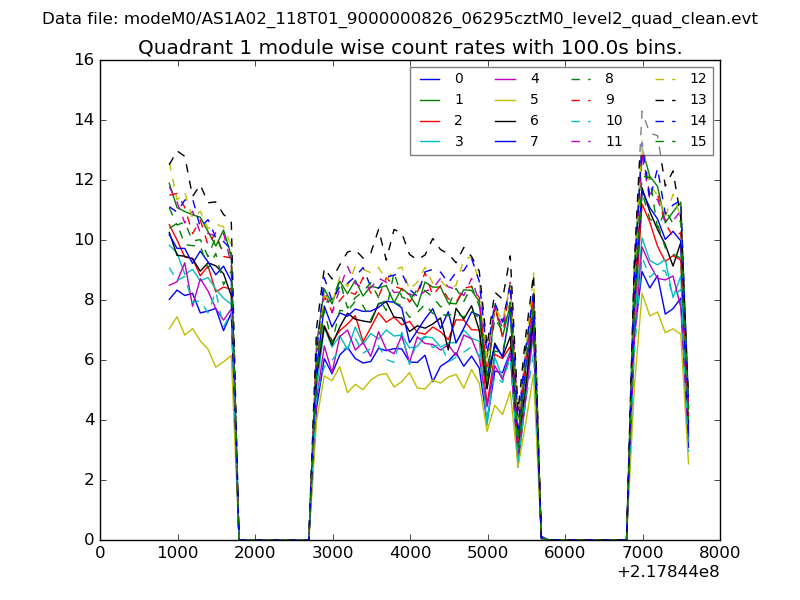 |
 |
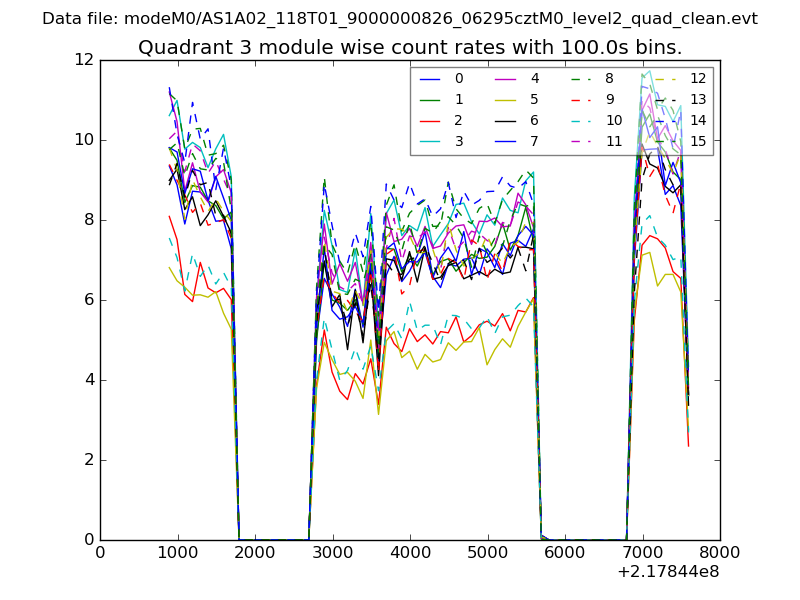
| Module-wise count rates for Quadrant C Data is divided into 100 sec bins |
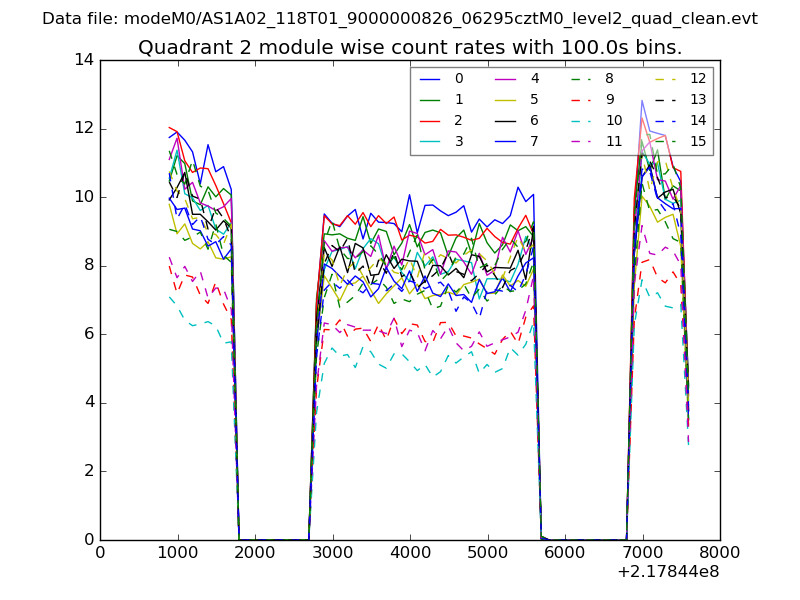 |
 |
| Module-wise count rates for Quadrant D Data is divided into 100 sec bins |
 |
 |
| Parameter | Plot |
|---|---|
| CZT HV Monitor | 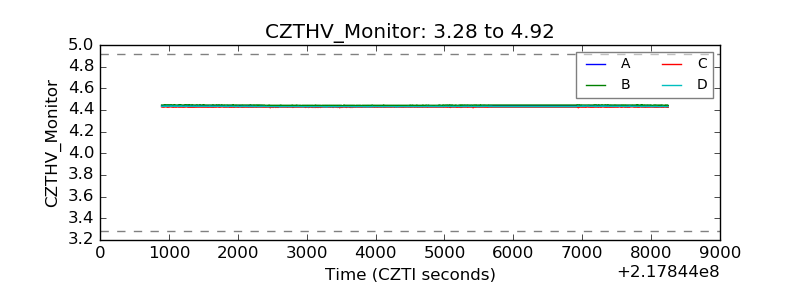 |
| D_VDD | 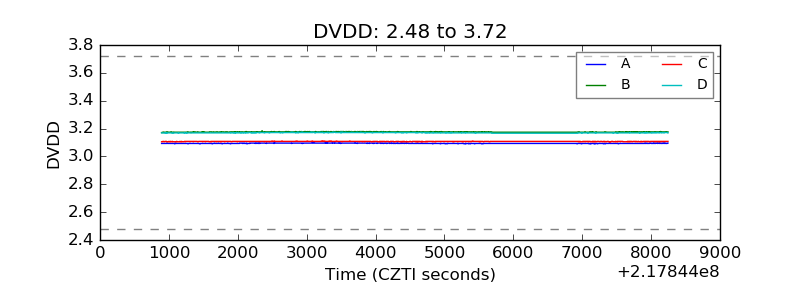 |
| Temperature 1 | 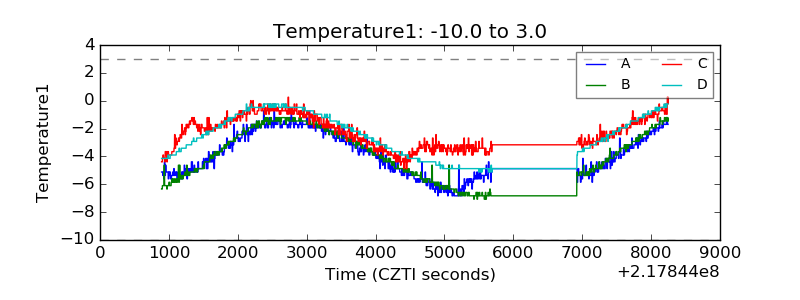 |
| Veto HV Monitor | 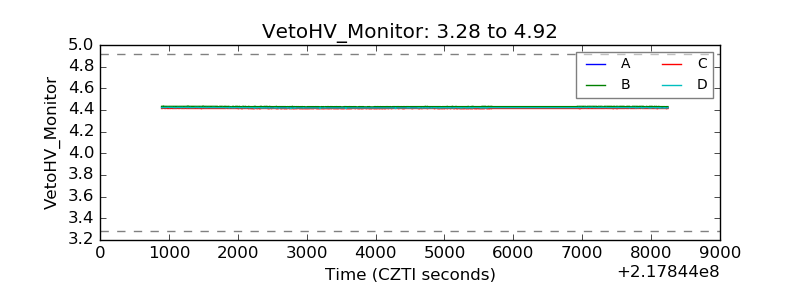 |
| Veto LLD | 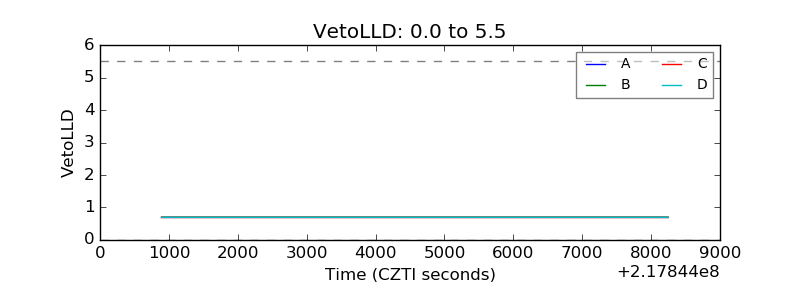 |
| Alpha Counter | 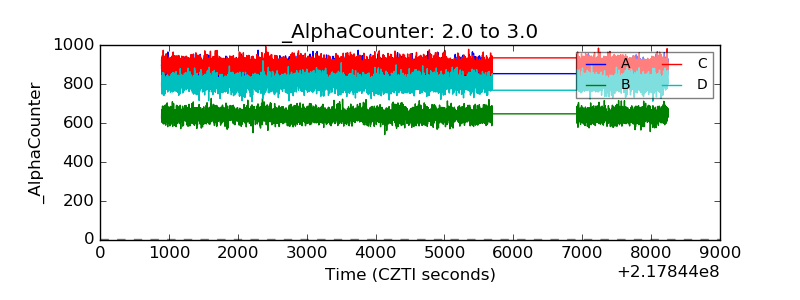 |
| _CPM_Rate | 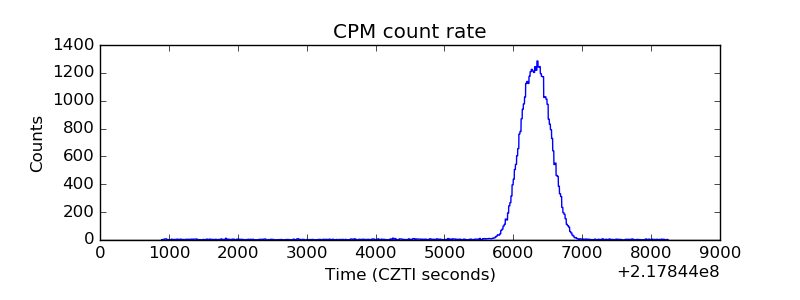 |
| CZT Counter |  |
| +2.5 Volts monitor |  |
| +5 Volts monitor |  |
| _ROLL_ROT | 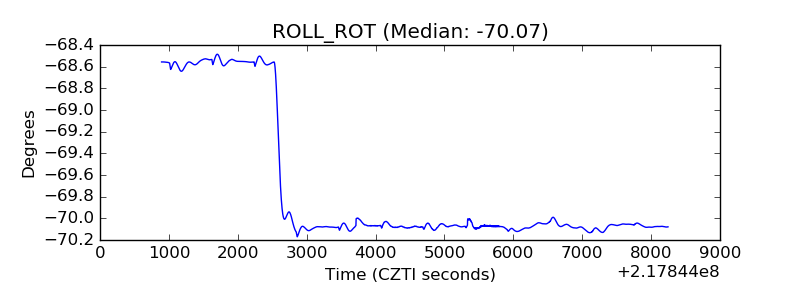 |
| _Roll_DEC | 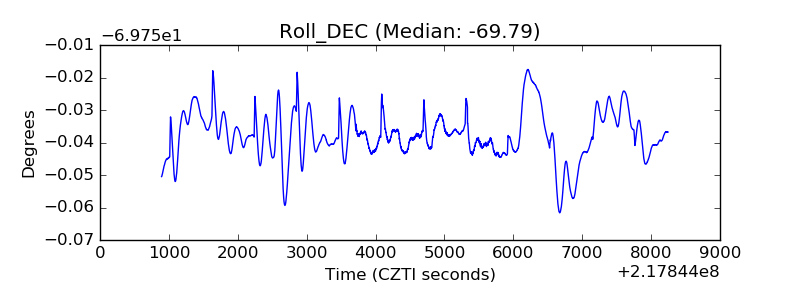 |
| _Roll_RA | 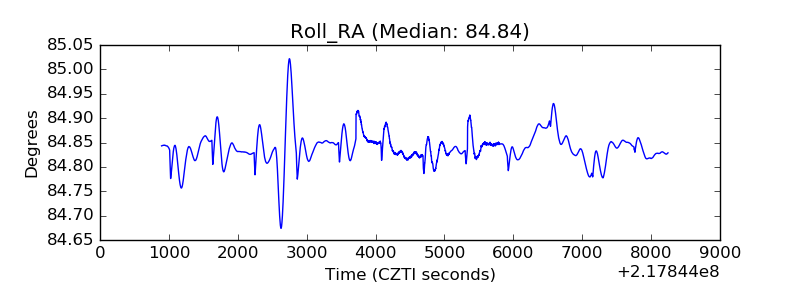 |
| Veto Counter | 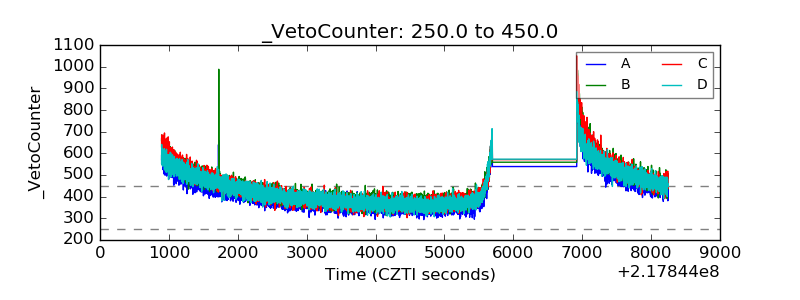 |