| Param | Original file | Final file |
|---|---|---|
| Filename | modeM0/AS1A02_118T01_9000000826_06297cztM0_level2.evt | modeM0/AS1A02_118T01_9000000826_06297cztM0_level2_quad_clean.evt |
| Size (bytes) | 622,776,960 | 86,060,160 |
| Size | 593.9 MB | 82.1 MB |
| Events in quadrant A | 4,349,789 | 549,839 |
| Events in quadrant B | 3,785,827 | 551,765 |
| Events in quadrant C | 2,929,096 | 555,196 |
| Events in quadrant D | 7,359,624 | 498,906 |
| Mode M9 | |||
|---|---|---|---|
| Quadrant | BADHDUFLAG | Total packets | Discarded packets |
| A | 0 | 12 | 0 |
| B | 0 | 12 | 0 |
| C | 0 | 12 | 0 |
| D | 0 | 12 | 0 |
| Mode SS | |||
|---|---|---|---|
| Quadrant | BADHDUFLAG | Total packets | Discarded packets |
| A | 0 | 130 | 0 |
| B | 0 | 130 | 0 |
| C | 0 | 130 | 0 |
| D | 0 | 130 | 0 |
| Mode M0 | |||
|---|---|---|---|
| Quadrant | BADHDUFLAG | Total packets | Discarded packets |
| A | 0 | 17876 | 2 |
| B | 0 | 15397 | 1 |
| C | 0 | 13228 | 1 |
| D | 0 | 26375 | 1 |
| Quadrant | Total seconds | Saturated seconds | Saturation percentage |
|---|---|---|---|
| A | 6453 | 148 | 2.293507% |
| B | 6453 | 272 | 4.215094% |
| C | 6453 | 109 | 1.689137% |
| D | 6453 | 1056 | 16.364482% |
Noise dominated data is calculated using 1-second bins in cleaned event files. If a bin has >2000 counts, and if more than 50% of those come from <1% of pixels, then it is considered to be noise-dominated and hence unusable.
| Quadrant | # 1 sec bins | Bins with >0 counts | Bins with >2000 counts | High rate bins dominated by noise | Noise dominated (total time) | Noise dominated (detector-on time) | Marked lightcurve |
|---|---|---|---|---|---|---|---|
| A | 7618 | 6453 | 0 | 0 | 0.00% | 0.00% |  |
| B | 7618 | 6453 | 117 | 117 | 1.54% | 1.81% |  |
| C | 7618 | 6453 | 0 | 0 | 0.00% | 0.00% |  |
| D | 7618 | 6453 | 863 | 863 | 11.33% | 13.37% |  |
Top three noisy pixels from each quadrant. If the there are fewer than three noisy pixels in the level2.evt file, extra rows are filled as -1
| Pixel properties | Quadrant properties | ||||||
|---|---|---|---|---|---|---|---|
| Quadrant | DetID | PixID | Counts | Sigma | Mean | Median | Sigma |
| A | 8 | 15 | 737838 | 4778.01 | 765 | 748 | 154.3 |
| A | 15 | 236 | 621401 | 4023.24 | 765 | 748 | 154.3 |
| A | 14 | 111 | 35100 | 222.68 | 765 | 748 | 154.3 |
| B | 0 | 219 | 396973 | 2767.56 | 765 | 746 | 143.2 |
| B | 3 | 64 | 304830 | 2123.96 | 765 | 746 | 143.2 |
| B | 4 | 81 | 66481 | 459.14 | 765 | 746 | 143.2 |
| C | 1 | 16 | 29916 | 173.46 | 741 | 744 | 168.2 |
| C | 13 | 61 | 6058 | 31.6 | 741 | 744 | 168.2 |
| C | 9 | 54 | 5903 | 30.68 | 741 | 744 | 168.2 |
| D | 2 | 63 | 3328851 | 19239.96 | 710 | 685 | 173.0 |
| D | 12 | 220 | 482979 | 2788.12 | 710 | 685 | 173.0 |
| D | 2 | 152 | 442787 | 2555.77 | 710 | 685 | 173.0 |
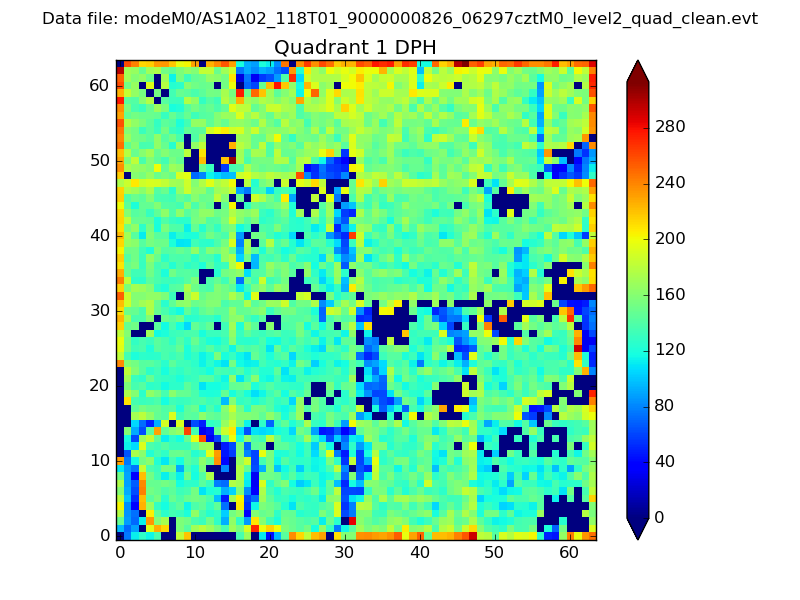
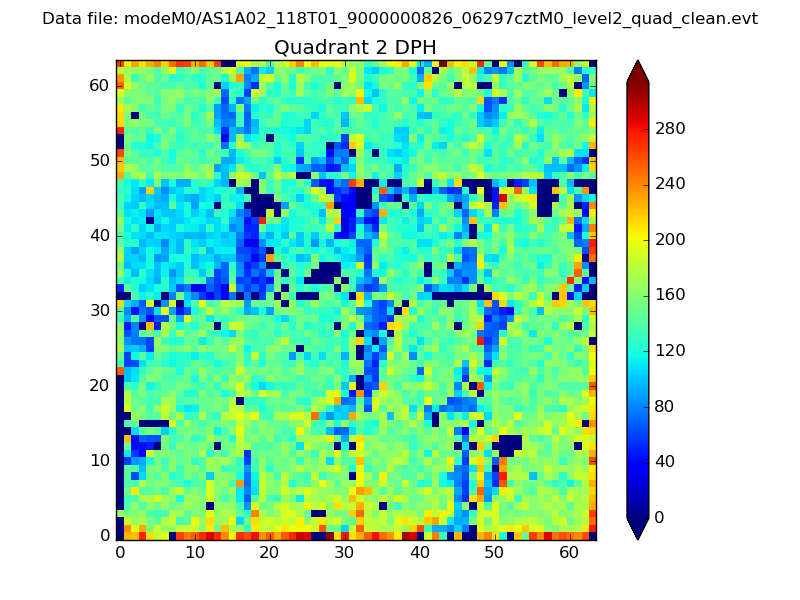
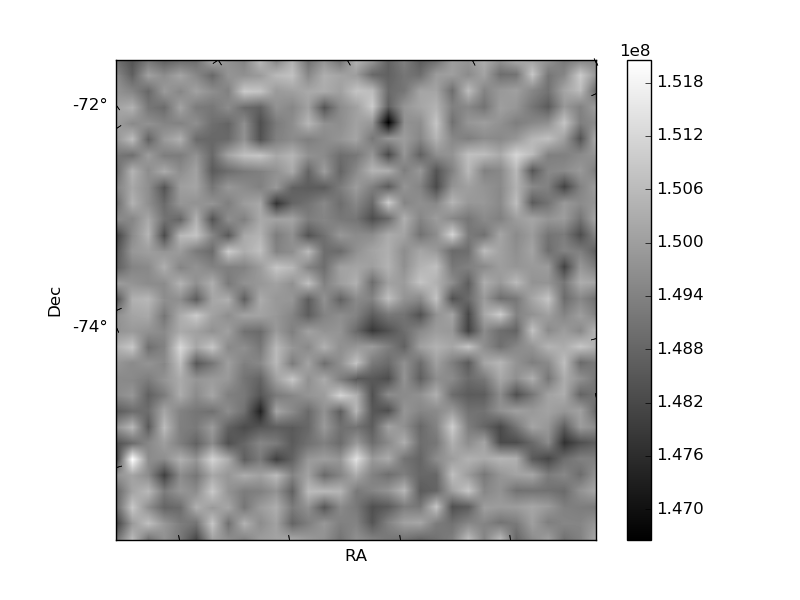
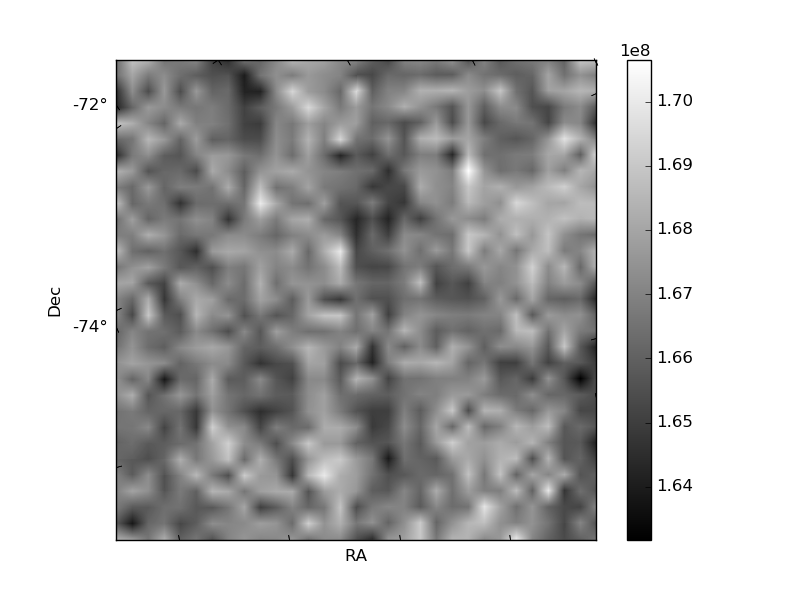
Histogram calculated using DETX and DETY for each event in the final _common_clean file
| Quadrant A | 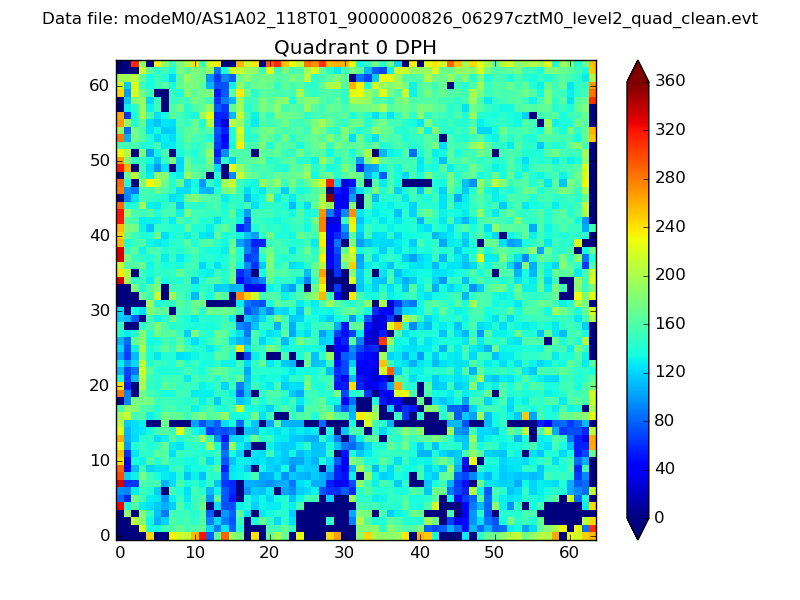 |
 |
Quadrant B |
|---|---|---|---|
| Quadrant D | 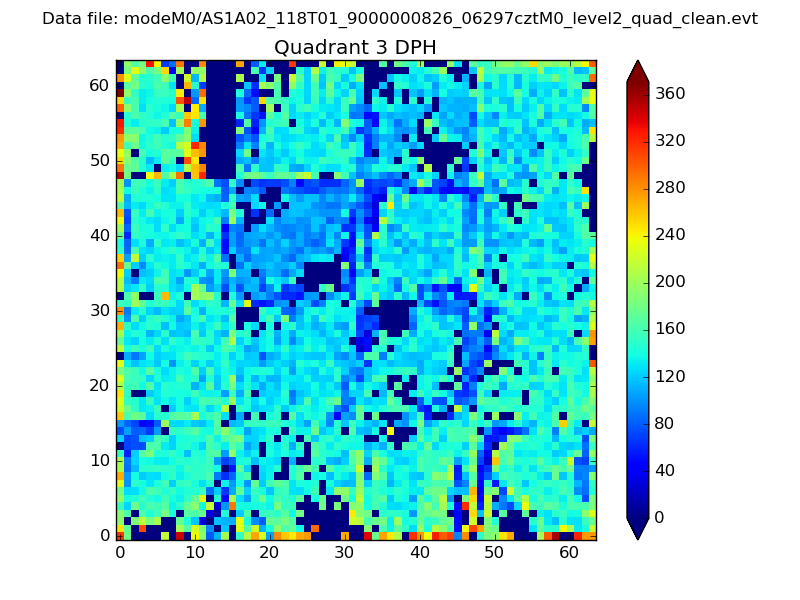 |
 |
Quadrant C |
| Plot type | Count rate plots | Images |
|---|---|---|
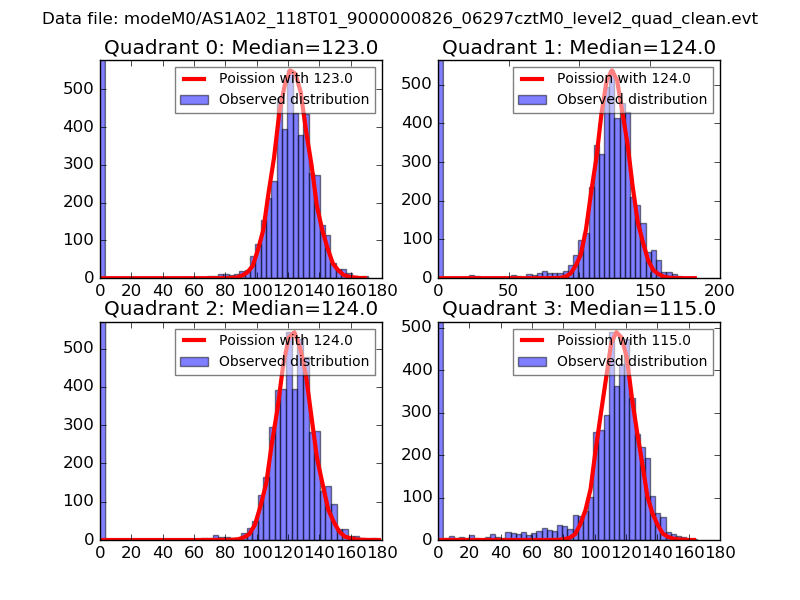
| Comparison with Poisson distribution Blue bars denote a histogram of data divided into 1 sec bins. Red curve is a Poisson curve with rate = median count rate of data. |
 |
 |
| Quadrant-wise count rates Data is divided into 100 sec bins |
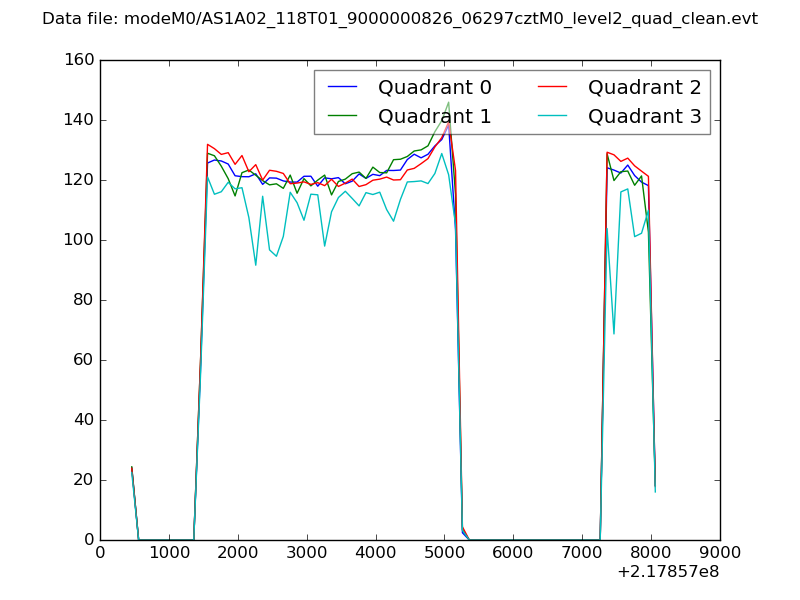 |
|
| Module-wise count rates for Quadrant A Data is divided into 100 sec bins |
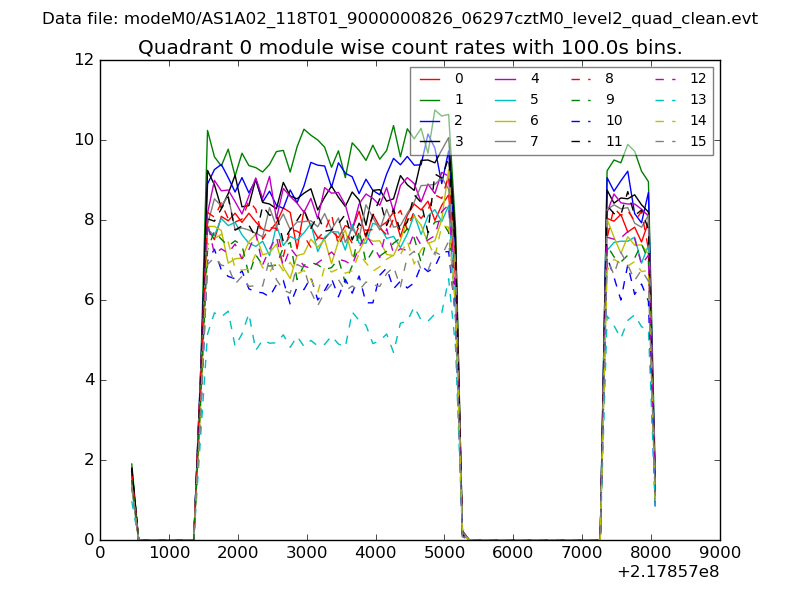 |
 |
| Module-wise count rates for Quadrant B Data is divided into 100 sec bins |
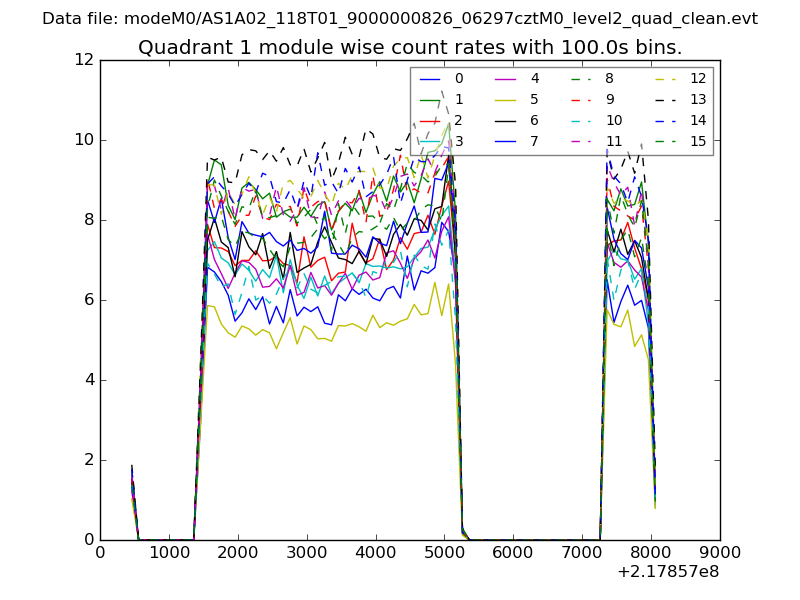 |
 |
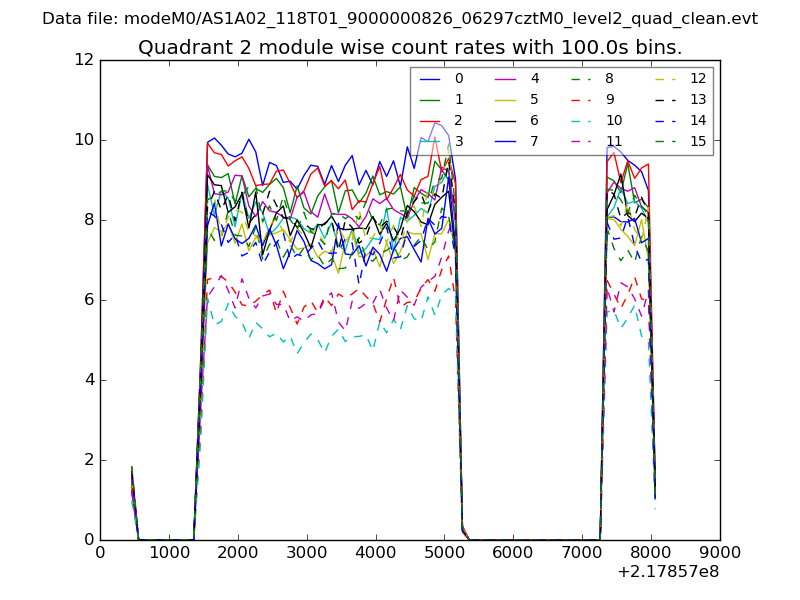
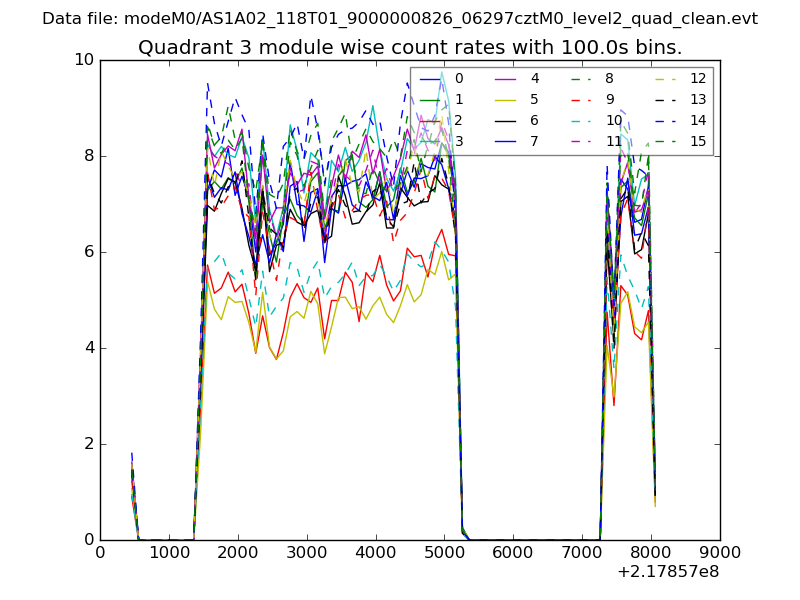
| Module-wise count rates for Quadrant C Data is divided into 100 sec bins |
 |
 |
| Module-wise count rates for Quadrant D Data is divided into 100 sec bins |
 |
 |
| Parameter | Plot |
|---|---|
| CZT HV Monitor | 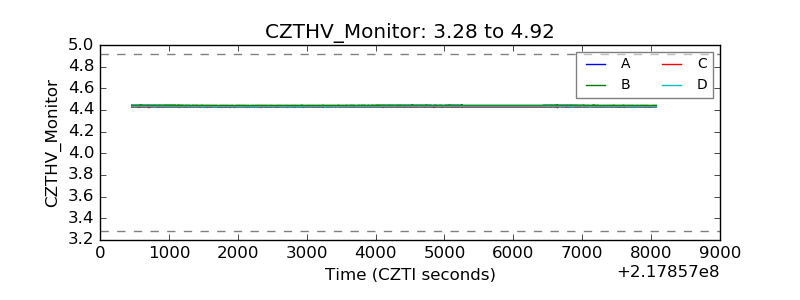 |
| D_VDD | 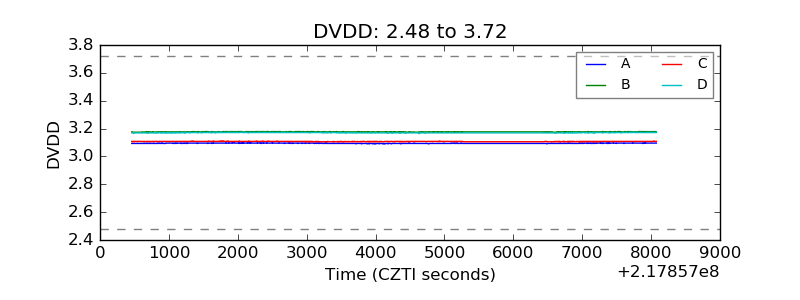 |
| Temperature 1 | 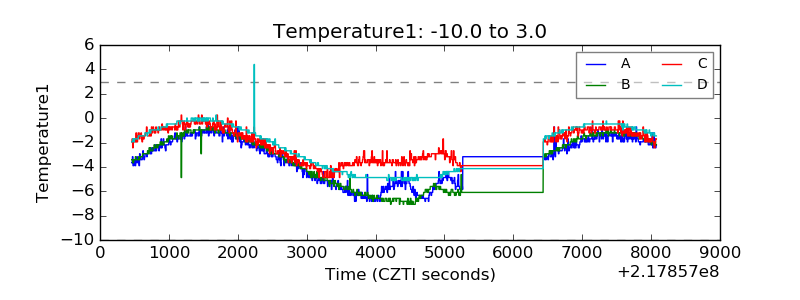 |
| Veto HV Monitor | 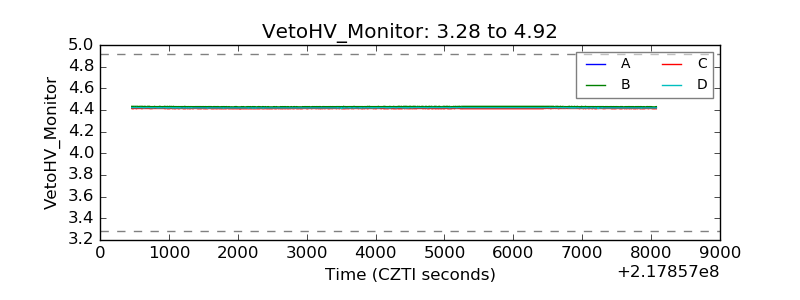 |
| Veto LLD | 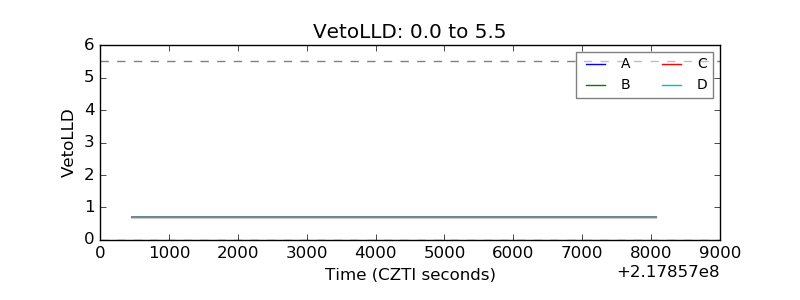 |
| Alpha Counter | 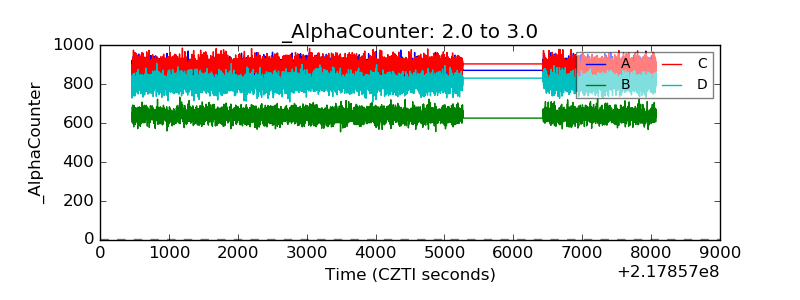 |
| _CPM_Rate | 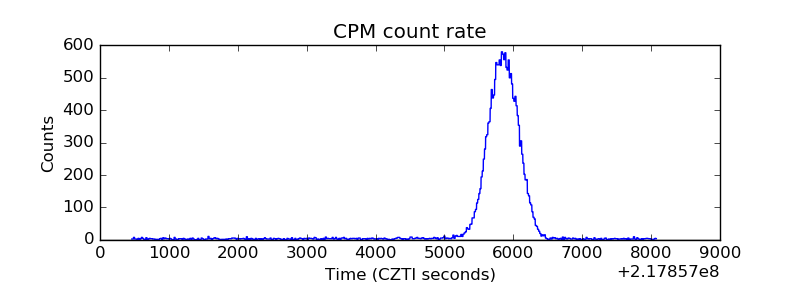 |
| CZT Counter | 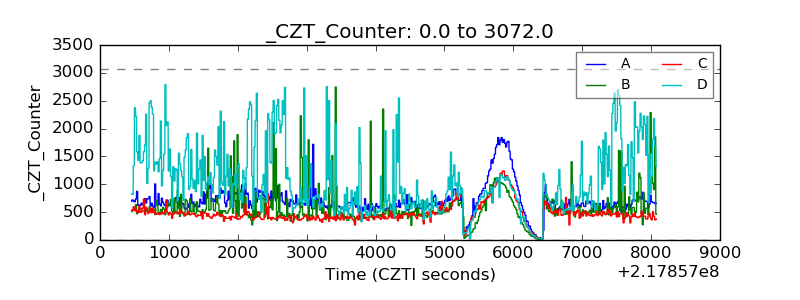 |
| +2.5 Volts monitor |  |
| +5 Volts monitor |  |
| _ROLL_ROT | 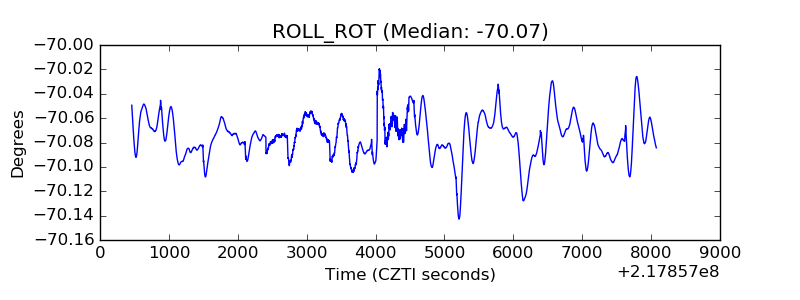 |
| _Roll_DEC | 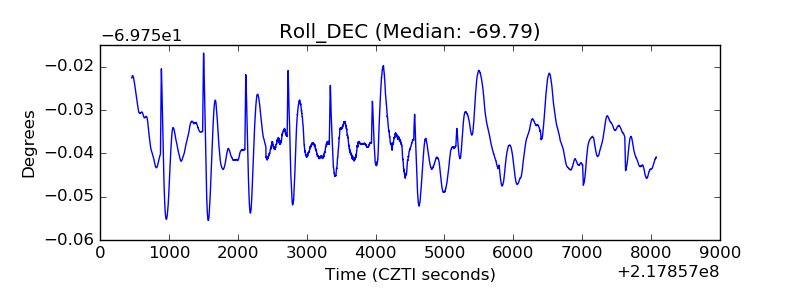 |
| _Roll_RA | 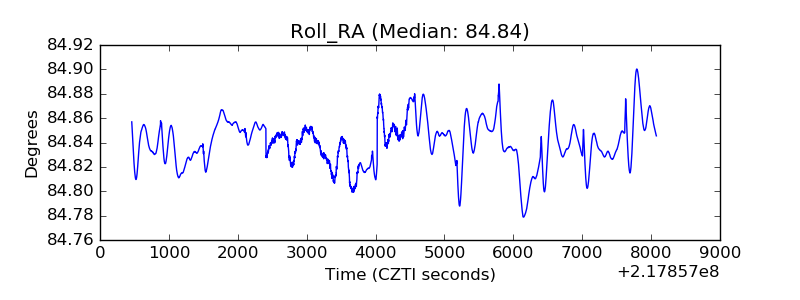 |
| Veto Counter | 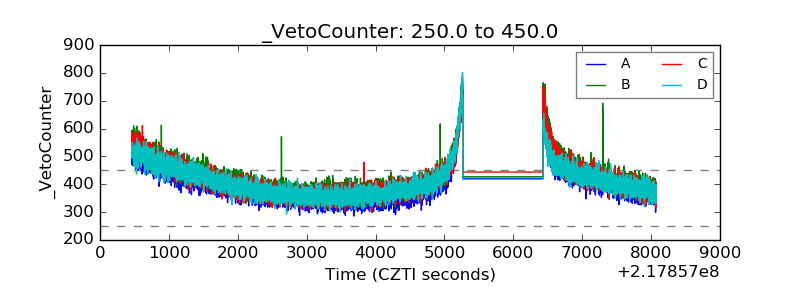 |