| Param | Original file | Final file |
|---|---|---|
| Filename | modeM0/AS1A02_118T01_9000000826_06300cztM0_level2.evt | modeM0/AS1A02_118T01_9000000826_06300cztM0_level2_quad_clean.evt |
| Size (bytes) | 580,959,360 | 96,177,600 |
| Size | 554.0 MB | 91.7 MB |
| Events in quadrant A | 3,573,761 | 647,110 |
| Events in quadrant B | 3,427,750 | 645,349 |
| Events in quadrant C | 2,553,252 | 648,754 |
| Events in quadrant D | 7,635,994 | 554,770 |
| Mode M9 | |||
|---|---|---|---|
| Quadrant | BADHDUFLAG | Total packets | Discarded packets |
| A | 0 | 6 | 0 |
| B | 0 | 6 | 0 |
| C | 0 | 6 | 0 |
| D | 0 | 6 | 0 |
| Mode SS | |||
|---|---|---|---|
| Quadrant | BADHDUFLAG | Total packets | Discarded packets |
| A | 0 | 122 | 0 |
| B | 0 | 122 | 0 |
| C | 0 | 122 | 0 |
| D | 0 | 122 | 0 |
| Mode M0 | |||
|---|---|---|---|
| Quadrant | BADHDUFLAG | Total packets | Discarded packets |
| A | 0 | 14518 | 1 |
| B | 0 | 14302 | 1 |
| C | 0 | 12111 | 1 |
| D | 0 | 26840 | 1 |
| Quadrant | Total seconds | Saturated seconds | Saturation percentage |
|---|---|---|---|
| A | 5954 | 108 | 1.813907% |
| B | 5954 | 250 | 4.198858% |
| C | 5954 | 26 | 0.436681% |
| D | 5954 | 1459 | 24.504535% |
Noise dominated data is calculated using 1-second bins in cleaned event files. If a bin has >2000 counts, and if more than 50% of those come from <1% of pixels, then it is considered to be noise-dominated and hence unusable.
| Quadrant | # 1 sec bins | Bins with >0 counts | Bins with >2000 counts | High rate bins dominated by noise | Noise dominated (total time) | Noise dominated (detector-on time) | Marked lightcurve |
|---|---|---|---|---|---|---|---|
| A | 6594 | 5954 | 3 | 3 | 0.05% | 0.05% | 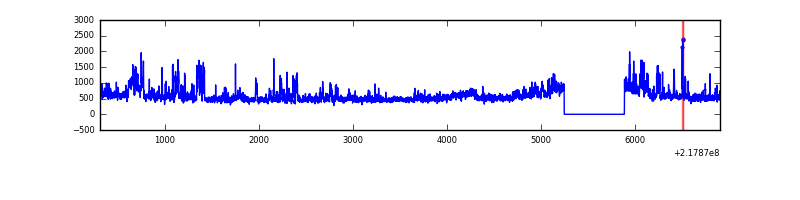 |
| B | 6594 | 5954 | 141 | 141 | 2.14% | 2.37% |  |
| C | 6594 | 5954 | 0 | 0 | 0.00% | 0.00% | 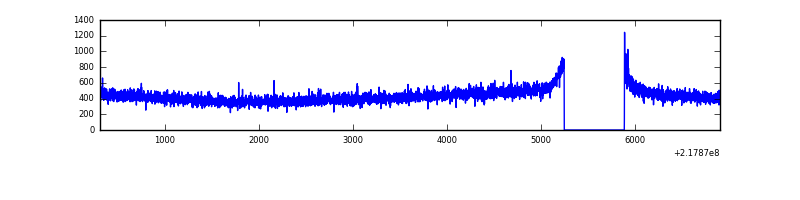 |
| D | 6594 | 5955 | 1436 | 1436 | 21.78% | 24.11% | 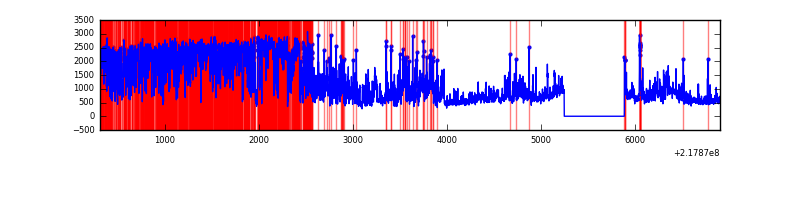 |
Top three noisy pixels from each quadrant. If the there are fewer than three noisy pixels in the level2.evt file, extra rows are filled as -1
| Pixel properties | Quadrant properties | ||||||
|---|---|---|---|---|---|---|---|
| Quadrant | DetID | PixID | Counts | Sigma | Mean | Median | Sigma |
| A | 8 | 15 | 701235 | 5108.93 | 667 | 651 | 137.1 |
| A | 15 | 236 | 173269 | 1258.8 | 667 | 651 | 137.1 |
| A | 13 | 251 | 118016 | 855.87 | 667 | 651 | 137.1 |
| B | 3 | 64 | 438154 | 3427.21 | 668 | 653 | 127.7 |
| B | 0 | 219 | 283126 | 2212.78 | 668 | 653 | 127.7 |
| B | 4 | 81 | 56685 | 438.93 | 668 | 653 | 127.7 |
| C | 1 | 16 | 12103 | 75.51 | 650 | 652 | 151.6 |
| C | 13 | 61 | 5280 | 30.52 | 650 | 652 | 151.6 |
| C | 8 | 222 | 4112 | 22.82 | 650 | 652 | 151.6 |
| D | 2 | 63 | 4616816 | 31815.81 | 599 | 581 | 145.1 |
| D | 12 | 220 | 400112 | 2753.63 | 599 | 581 | 145.1 |
| D | 11 | 241 | 129294 | 887.11 | 599 | 581 | 145.1 |
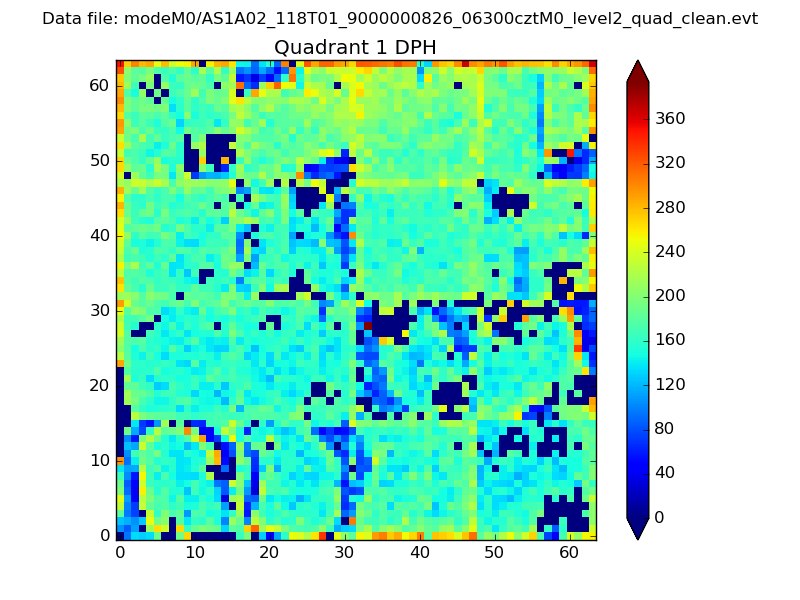
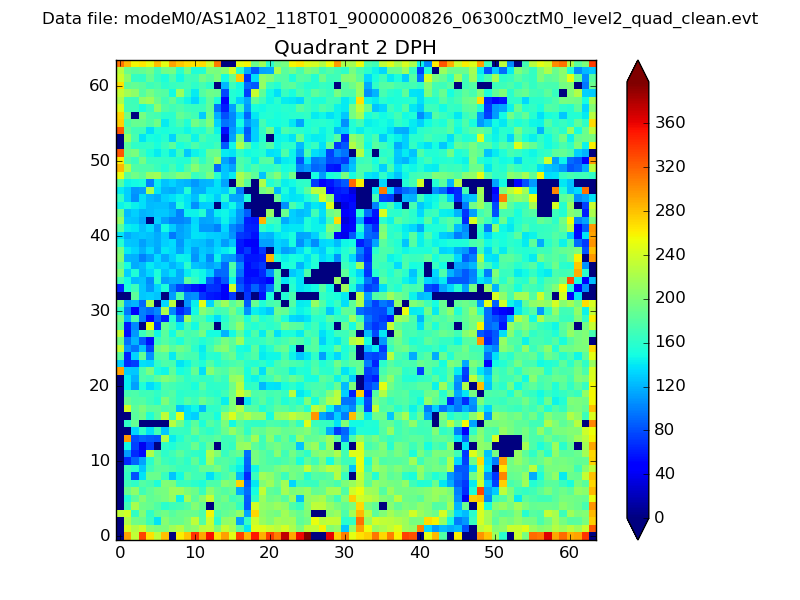
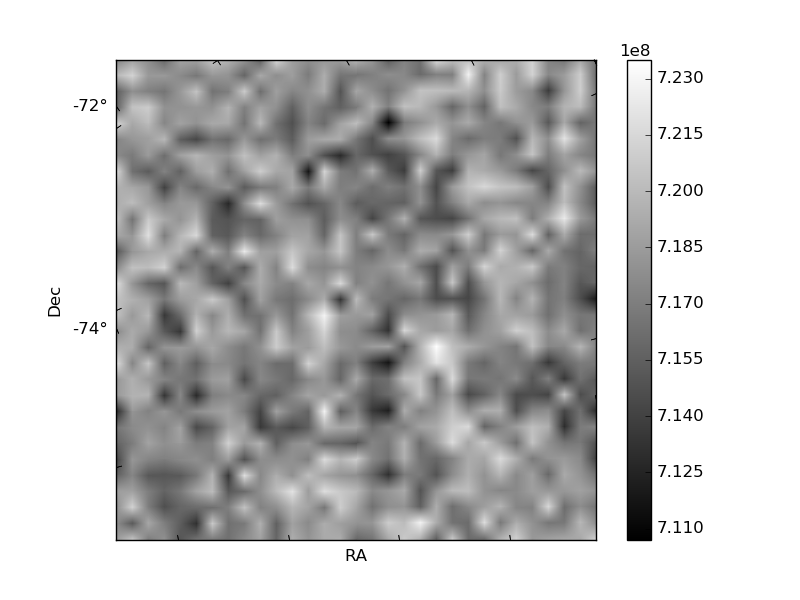
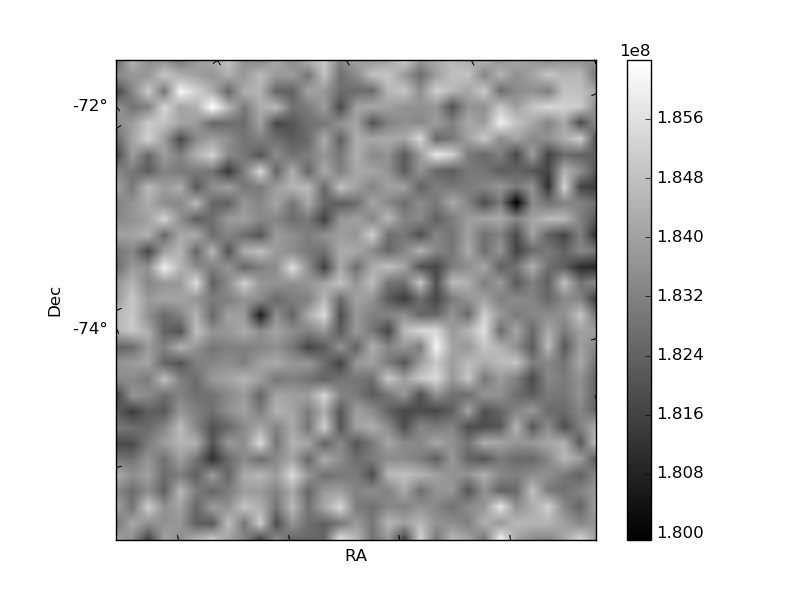
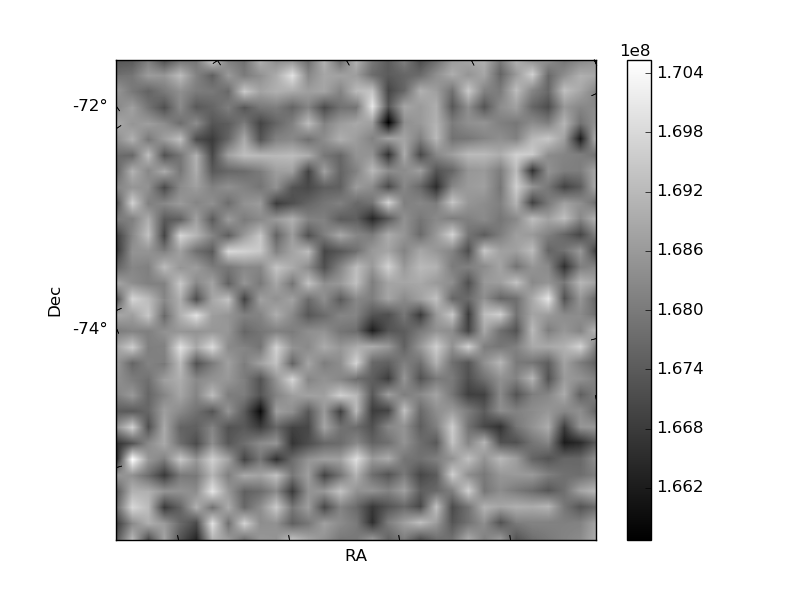
Histogram calculated using DETX and DETY for each event in the final _common_clean file
| Quadrant A | 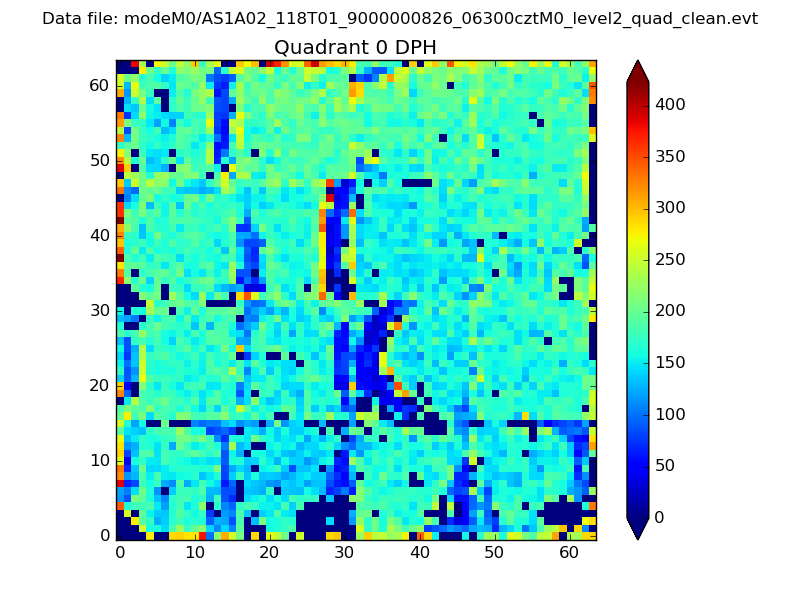 |
 |
Quadrant B |
|---|---|---|---|
| Quadrant D | 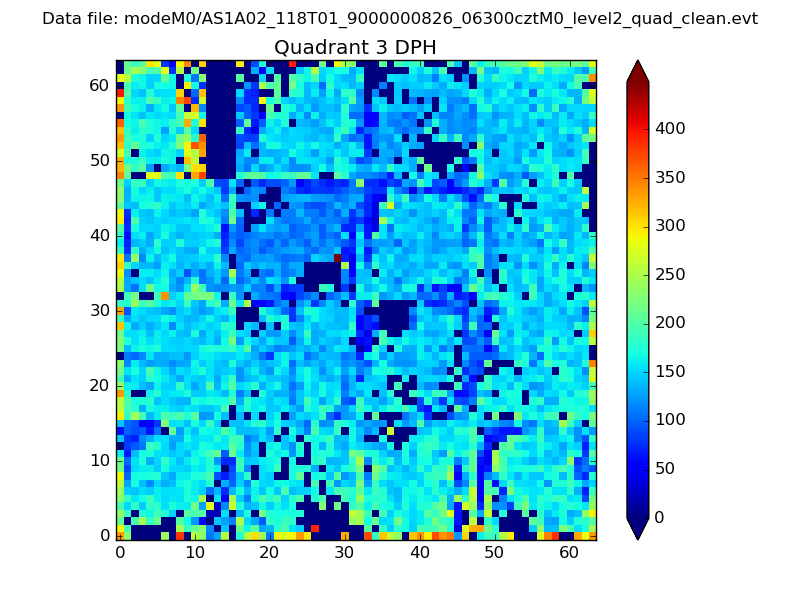 |
 |
Quadrant C |
| Plot type | Count rate plots | Images |
|---|---|---|
| Comparison with Poisson distribution Blue bars denote a histogram of data divided into 1 sec bins. Red curve is a Poisson curve with rate = median count rate of data. |
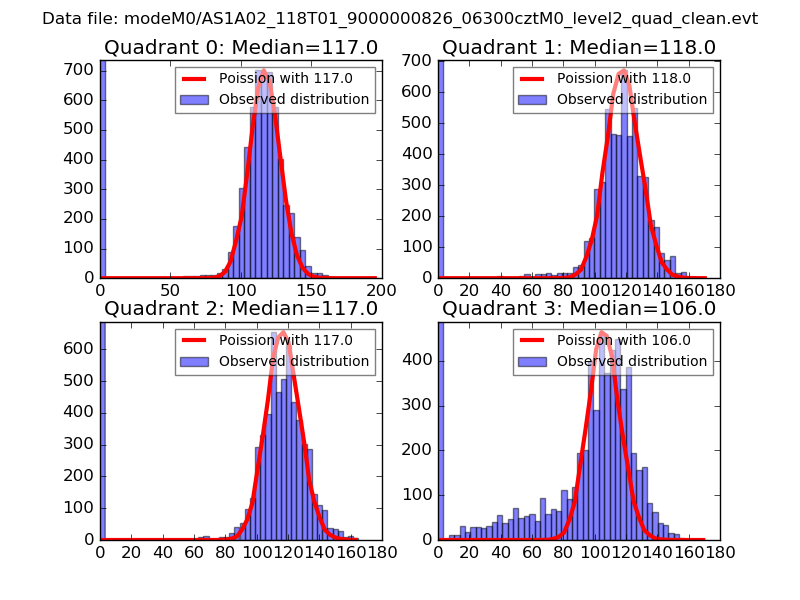 |
 |
| Quadrant-wise count rates Data is divided into 100 sec bins |
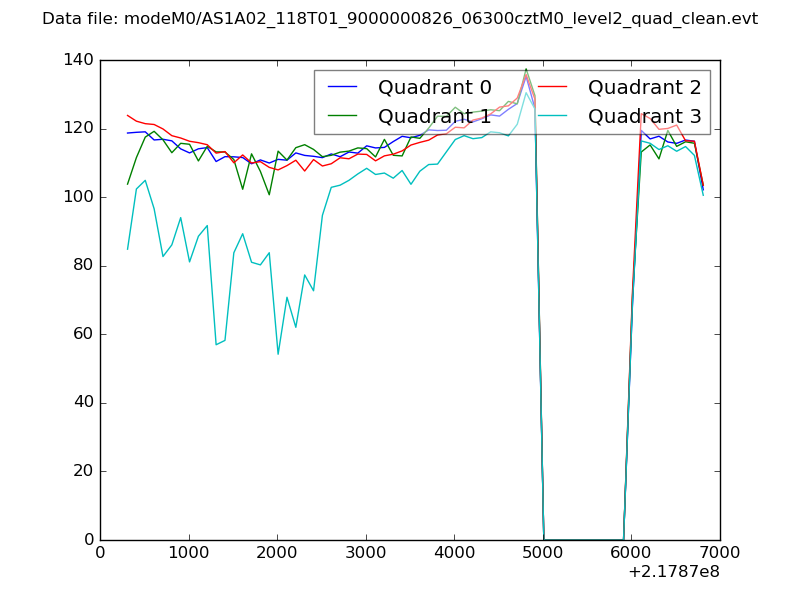 |
|
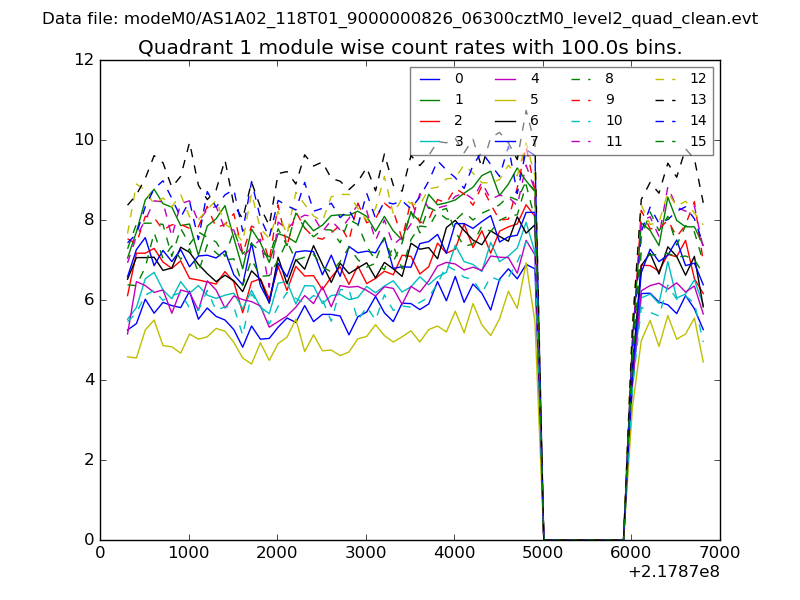
| Module-wise count rates for Quadrant A Data is divided into 100 sec bins |
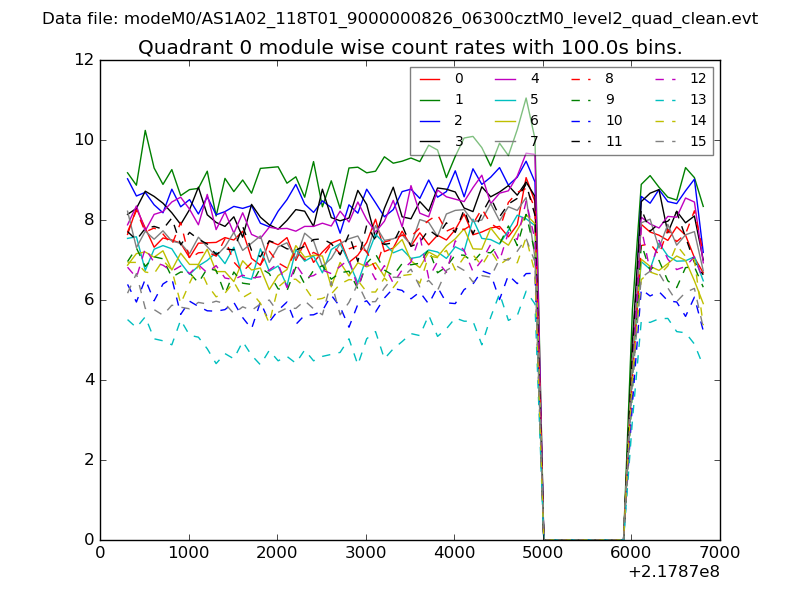 |
 |
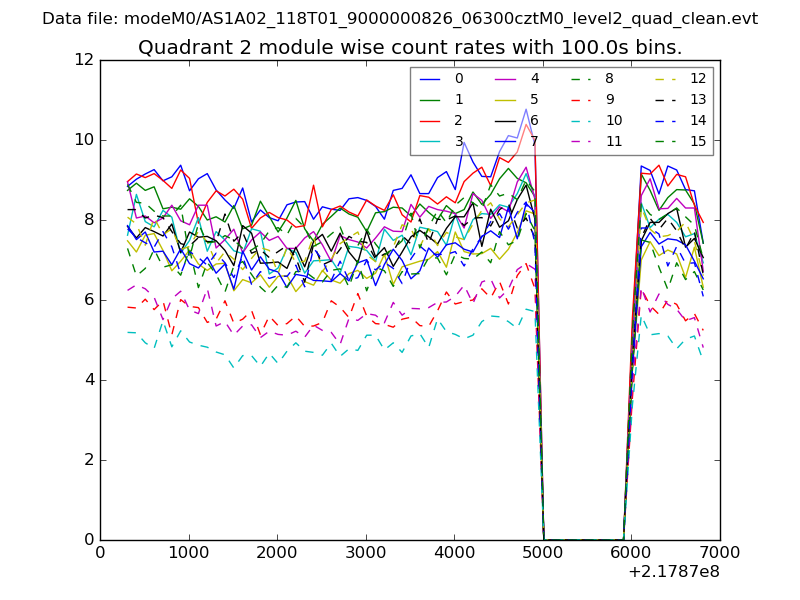
| Module-wise count rates for Quadrant B Data is divided into 100 sec bins |
 |
 |
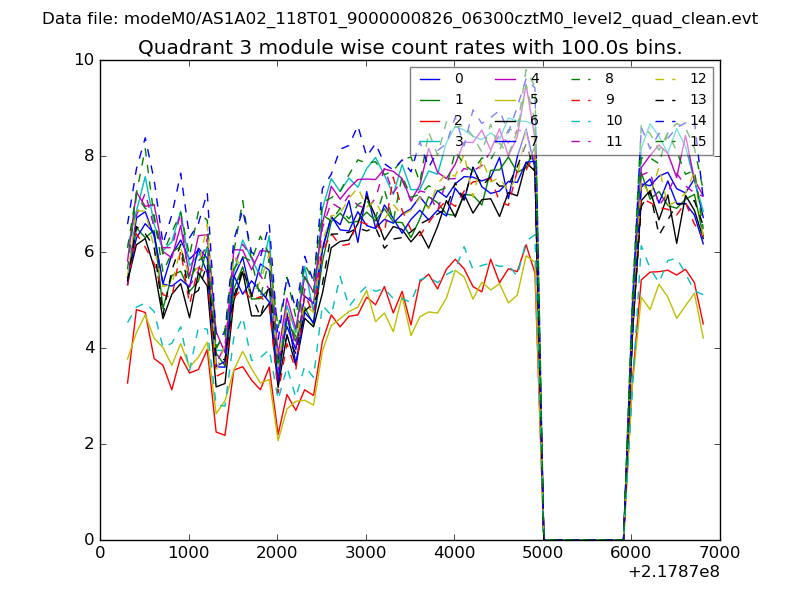
| Module-wise count rates for Quadrant C Data is divided into 100 sec bins |
 |
 |
| Module-wise count rates for Quadrant D Data is divided into 100 sec bins |
 |
 |
| Parameter | Plot |
|---|---|
| CZT HV Monitor | 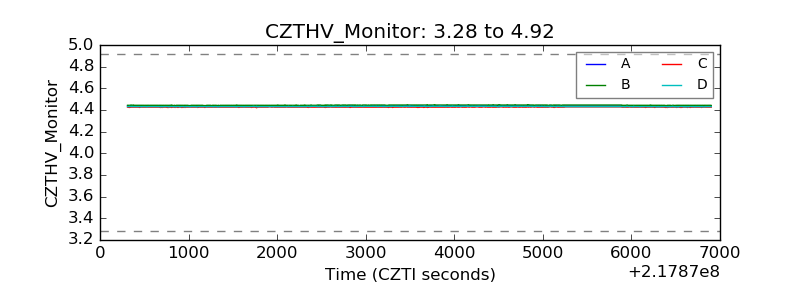 |
| D_VDD | 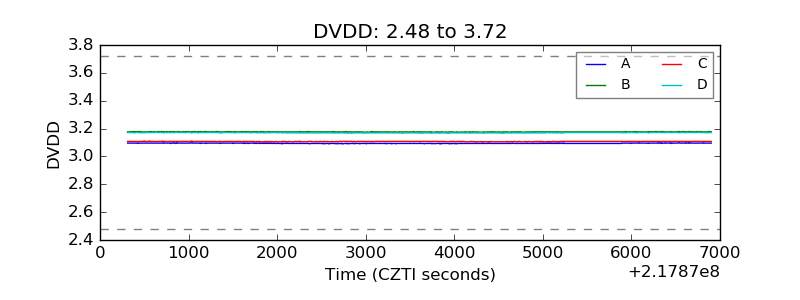 |
| Temperature 1 | 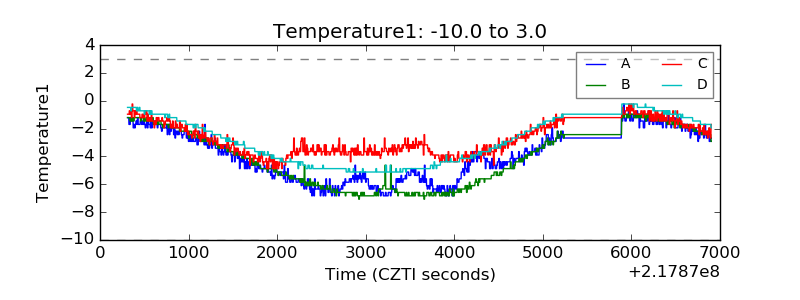 |
| Veto HV Monitor | 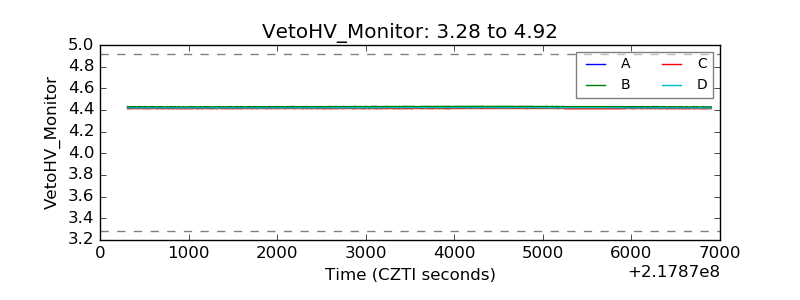 |
| Veto LLD | 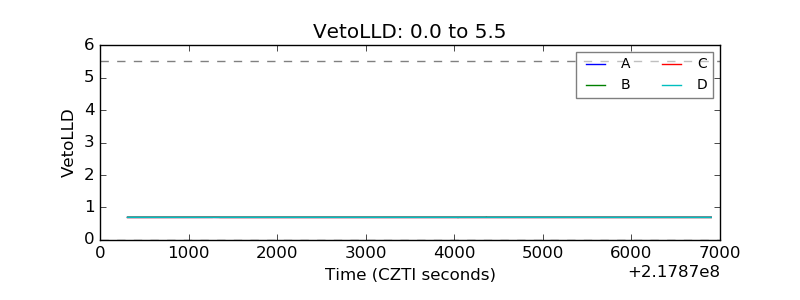 |
| Alpha Counter | 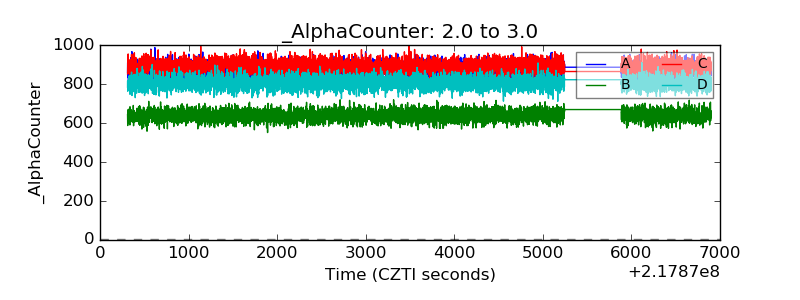 |
| _CPM_Rate | 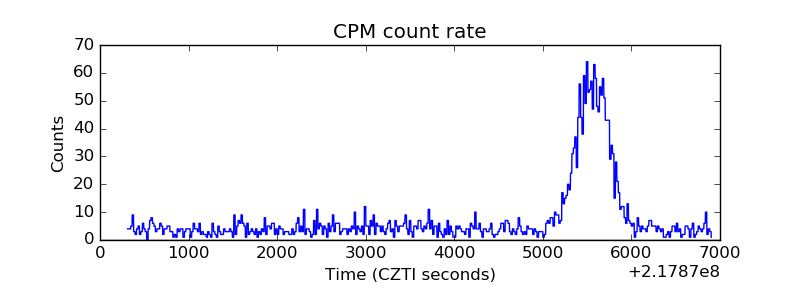 |
| CZT Counter | 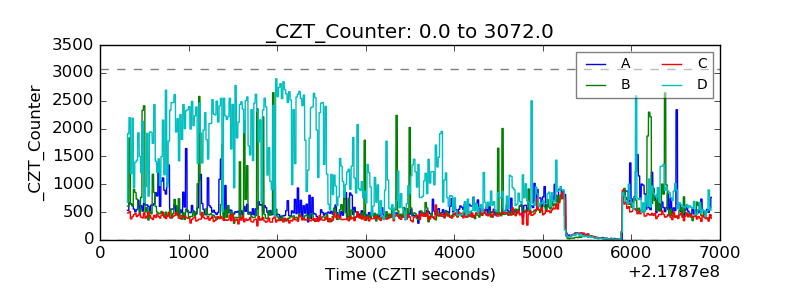 |
| +2.5 Volts monitor | 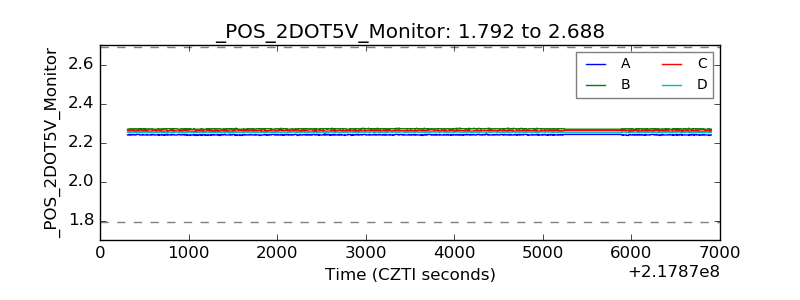 |
| +5 Volts monitor |  |
| _ROLL_ROT | 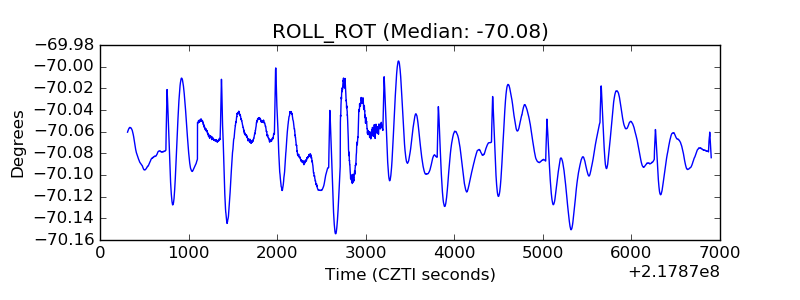 |
| _Roll_DEC | 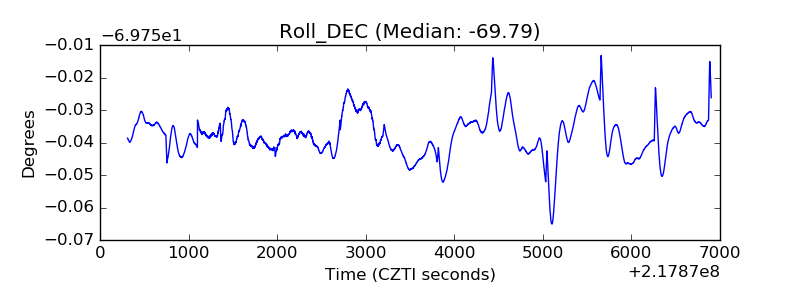 |
| _Roll_RA | 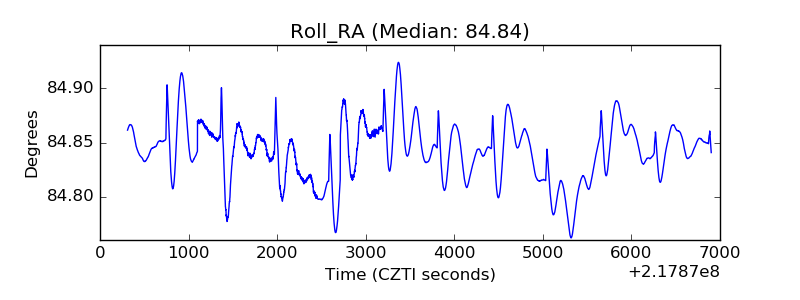 |
| Veto Counter | 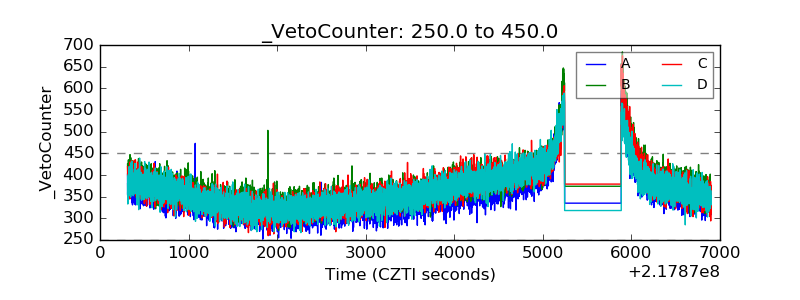 |