| Param | Original file | Final file |
|---|---|---|
| Filename | modeM0/AS1A02_070T01_9000000832_06304cztM0_level2.evt | modeM0/AS1A02_070T01_9000000832_06304cztM0_level2_quad_clean.evt |
| Size (bytes) | 1,210,907,520 | 119,877,120 |
| Size | 1.1 GB | 114.3 MB |
| Events in quadrant A | 6,577,499 | 741,305 |
| Events in quadrant B | 7,002,834 | 747,055 |
| Events in quadrant C | 5,222,091 | 761,777 |
| Events in quadrant D | 17,059,994 | 547,572 |
| Mode M9 | |||
|---|---|---|---|
| Quadrant | BADHDUFLAG | Total packets | Discarded packets |
| A | 0 | 13 | 0 |
| B | 0 | 13 | 0 |
| C | 0 | 13 | 0 |
| D | 0 | 13 | 0 |
| Mode SS | |||
|---|---|---|---|
| Quadrant | BADHDUFLAG | Total packets | Discarded packets |
| A | 0 | 244 | 0 |
| B | 0 | 244 | 0 |
| C | 0 | 244 | 0 |
| D | 0 | 244 | 0 |
| Mode M0 | |||
|---|---|---|---|
| Quadrant | BADHDUFLAG | Total packets | Discarded packets |
| A | 0 | 26733 | 3 |
| B | 0 | 28888 | 2 |
| C | 0 | 24307 | 2 |
| D | 0 | 58995 | 2 |
| Quadrant | Total seconds | Saturated seconds | Saturation percentage |
|---|---|---|---|
| A | 12012 | 115 | 0.957376% |
| B | 12012 | 419 | 3.488178% |
| C | 12012 | 32 | 0.266400% |
| D | 12012 | 3785 | 31.510157% |
Noise dominated data is calculated using 1-second bins in cleaned event files. If a bin has >2000 counts, and if more than 50% of those come from <1% of pixels, then it is considered to be noise-dominated and hence unusable.
| Quadrant | # 1 sec bins | Bins with >0 counts | Bins with >2000 counts | High rate bins dominated by noise | Noise dominated (total time) | Noise dominated (detector-on time) | Marked lightcurve |
|---|---|---|---|---|---|---|---|
| A | 13337 | 12012 | 47 | 47 | 0.35% | 0.39% | 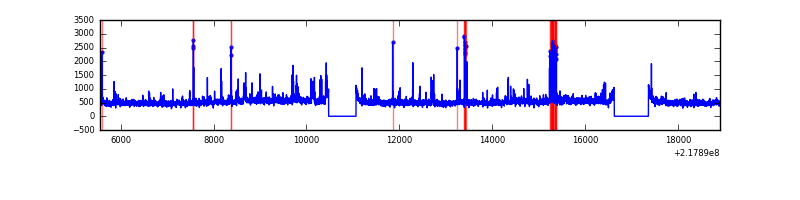 |
| B | 13337 | 12012 | 259 | 259 | 1.94% | 2.16% | 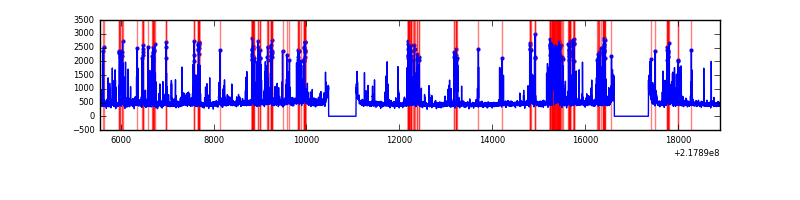 |
| C | 13337 | 12013 | 0 | 0 | 0.00% | 0.00% | 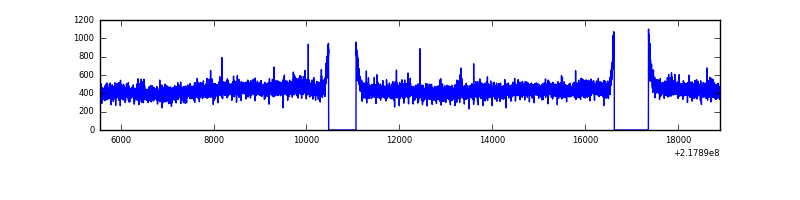 |
| D | 13337 | 12012 | 3581 | 3581 | 26.85% | 29.81% | 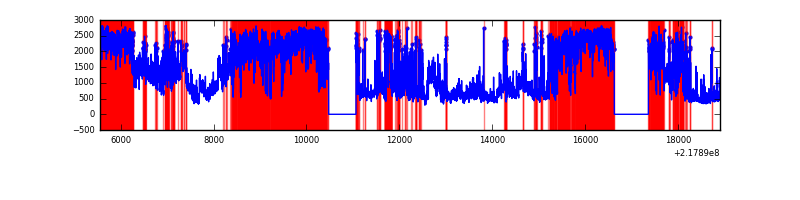 |
Top three noisy pixels from each quadrant. If the there are fewer than three noisy pixels in the level2.evt file, extra rows are filled as -1
| Pixel properties | Quadrant properties | ||||||
|---|---|---|---|---|---|---|---|
| Quadrant | DetID | PixID | Counts | Sigma | Mean | Median | Sigma |
| A | 8 | 15 | 838145 | 2993.5 | 1363 | 1332 | 279.5 |
| A | 13 | 251 | 236828 | 842.43 | 1363 | 1332 | 279.5 |
| A | 8 | 50 | 125151 | 442.93 | 1363 | 1332 | 279.5 |
| B | 3 | 64 | 1318053 | 5032.25 | 1370 | 1336 | 261.7 |
| B | 0 | 219 | 304401 | 1158.26 | 1370 | 1336 | 261.7 |
| B | 4 | 81 | 51157 | 190.41 | 1370 | 1336 | 261.7 |
| C | 13 | 61 | 10552 | 29.72 | 1335 | 1340 | 309.9 |
| C | 9 | 54 | 5566 | 13.63 | 1335 | 1340 | 309.9 |
| C | 8 | 222 | 5487 | 13.38 | 1335 | 1340 | 309.9 |
| D | 2 | 63 | 10205187 | 35522.86 | 1171 | 1134 | 287.3 |
| D | 12 | 220 | 1170910 | 4072.28 | 1171 | 1134 | 287.3 |
| D | 12 | 110 | 645592 | 2243.52 | 1171 | 1134 | 287.3 |
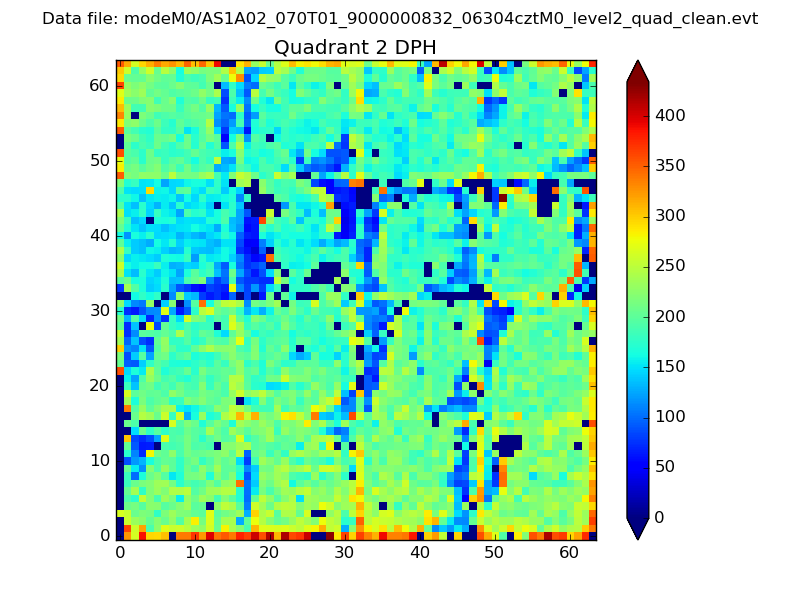
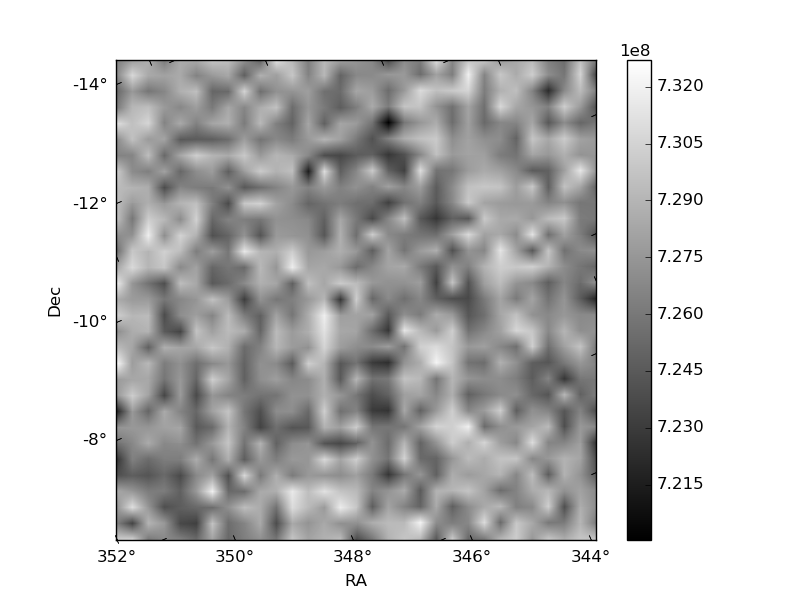
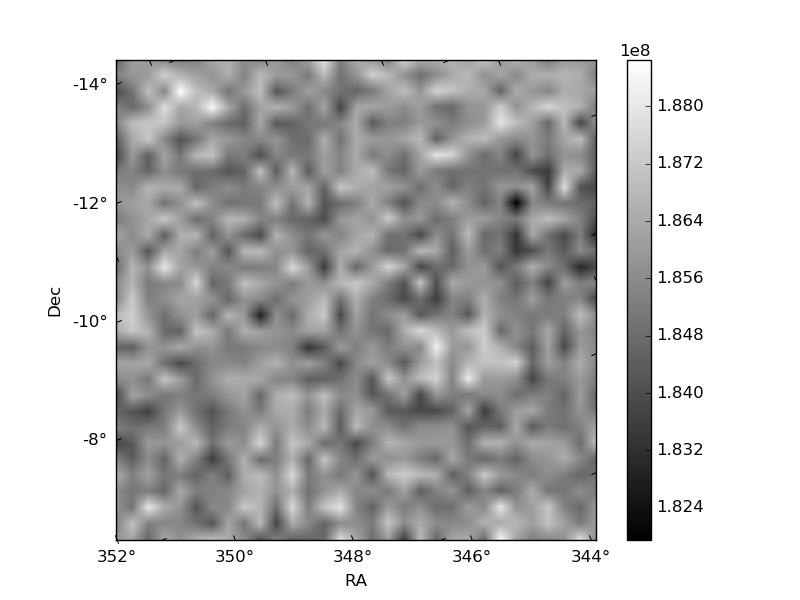
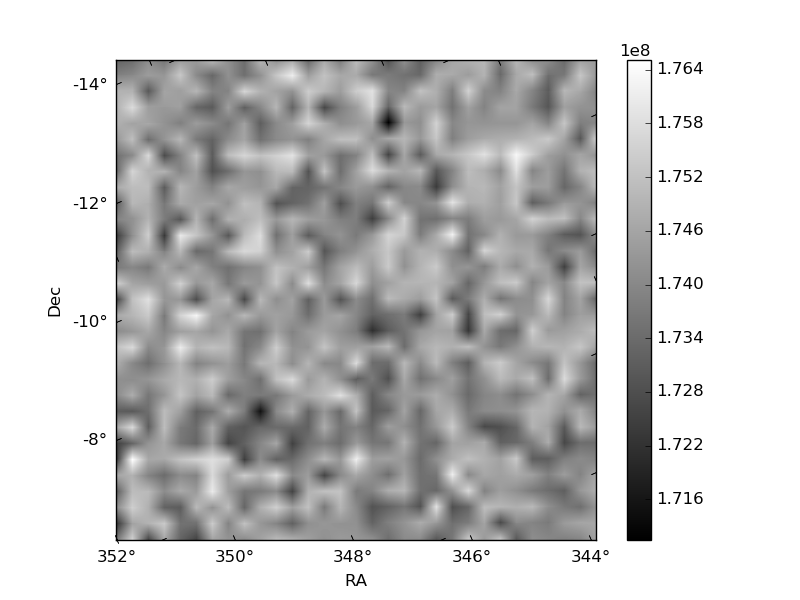
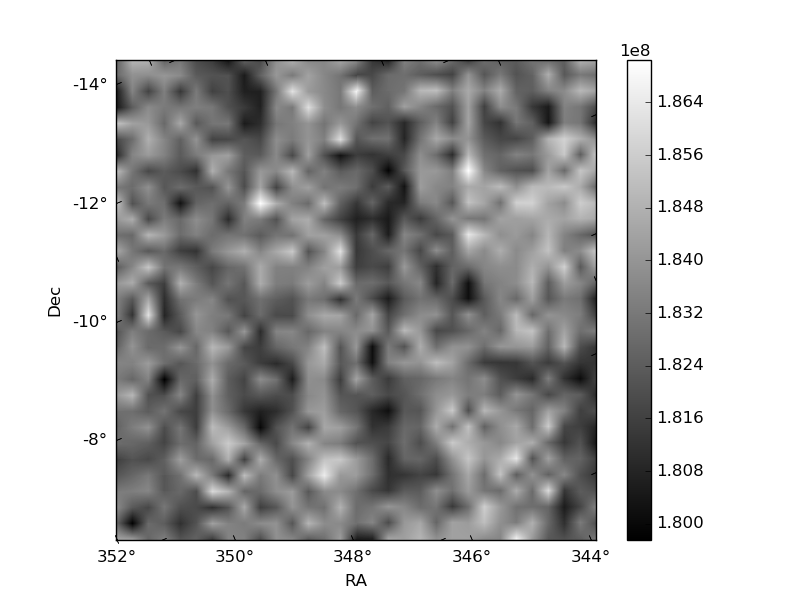
Histogram calculated using DETX and DETY for each event in the final _common_clean file
| Quadrant A | 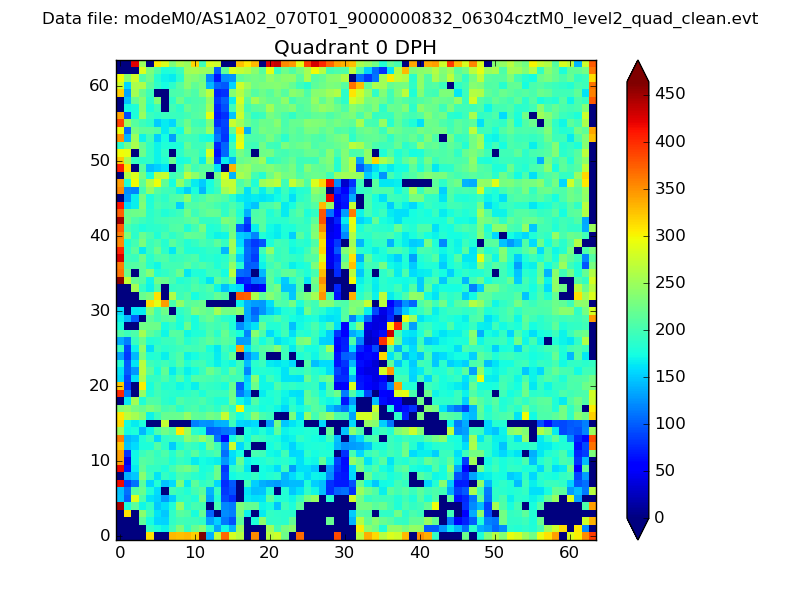 |
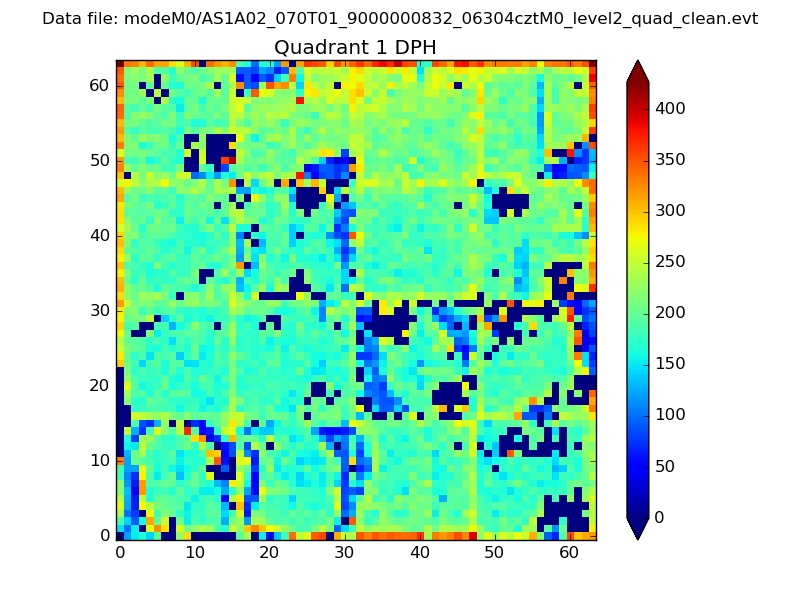 |
Quadrant B |
|---|---|---|---|
| Quadrant D | 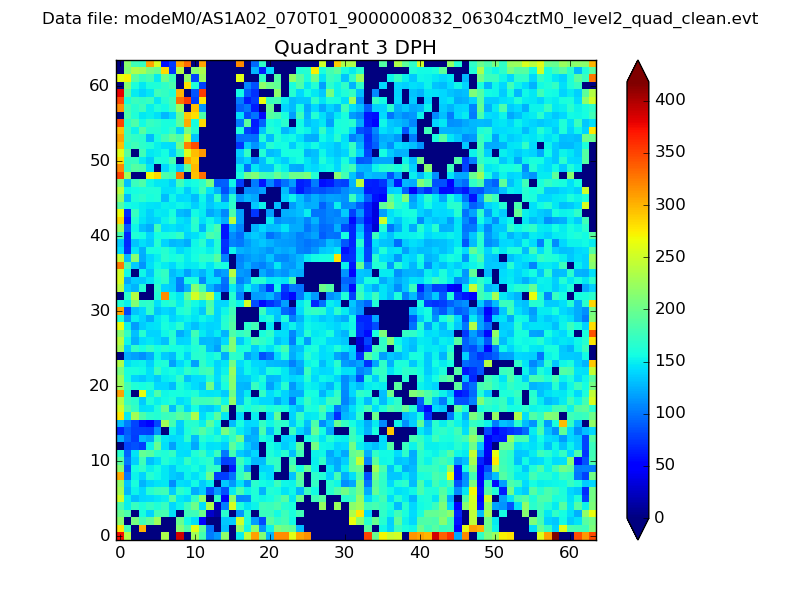 |
 |
Quadrant C |
| Plot type | Count rate plots | Images |
|---|---|---|
| Comparison with Poisson distribution Blue bars denote a histogram of data divided into 1 sec bins. Red curve is a Poisson curve with rate = median count rate of data. |
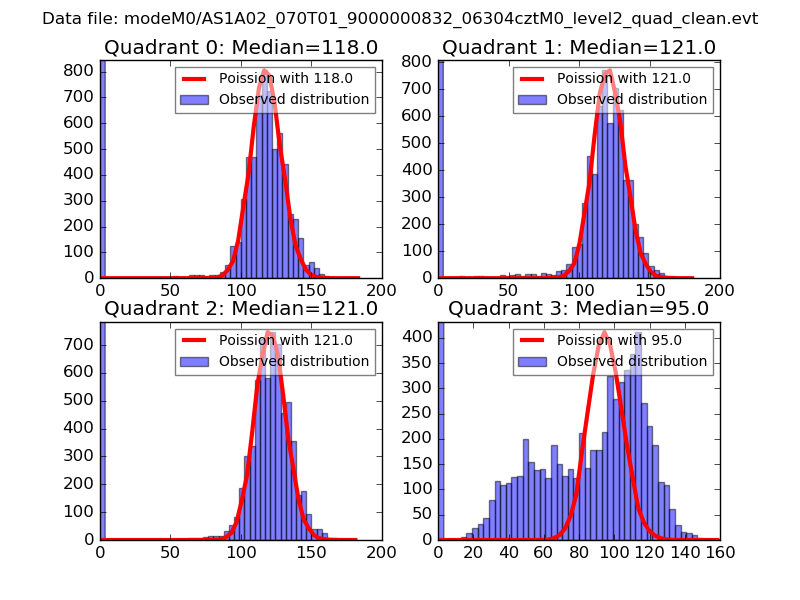 |
 |
| Quadrant-wise count rates Data is divided into 100 sec bins |
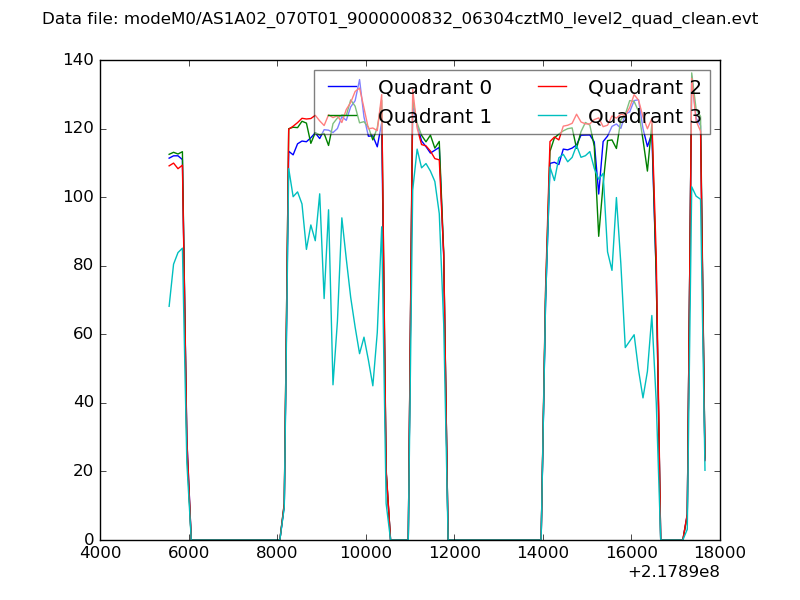 |
|
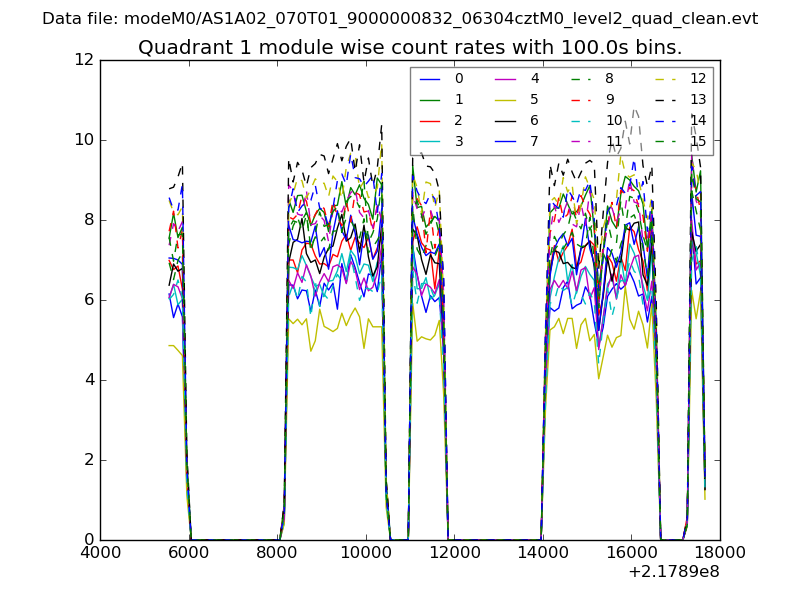
| Module-wise count rates for Quadrant A Data is divided into 100 sec bins |
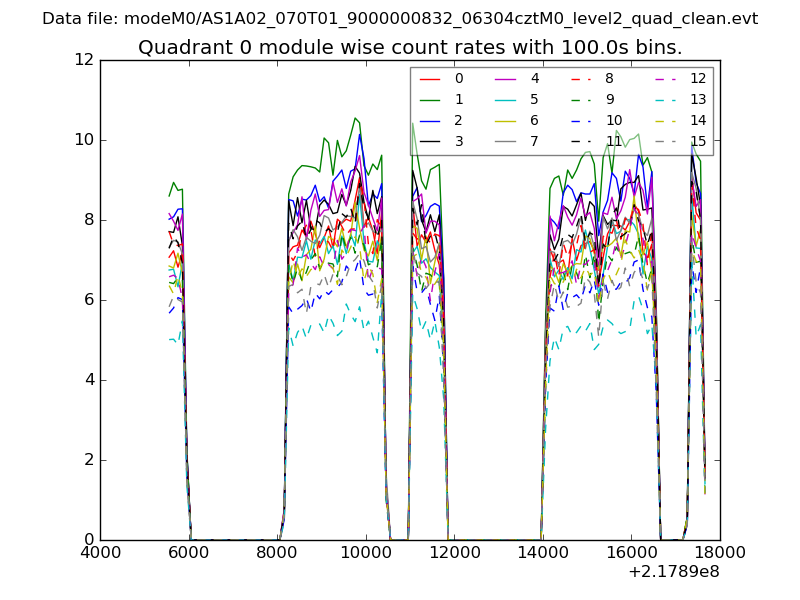 |
 |
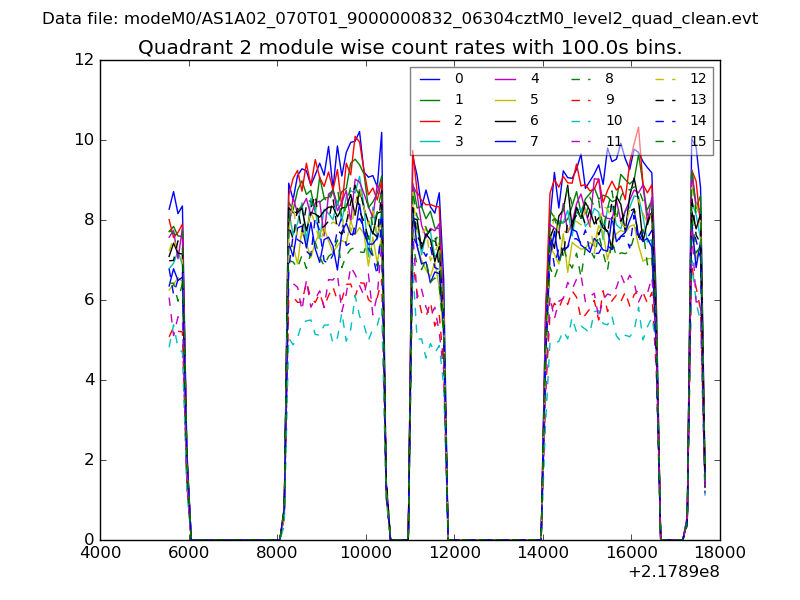
| Module-wise count rates for Quadrant B Data is divided into 100 sec bins |
 |
 |
| Module-wise count rates for Quadrant C Data is divided into 100 sec bins |
 |
 |
| Module-wise count rates for Quadrant D Data is divided into 100 sec bins |
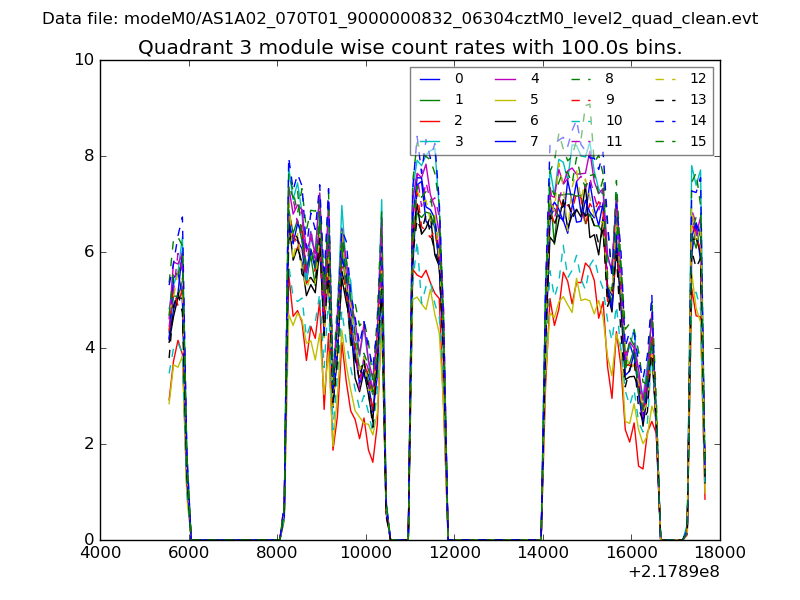 |
 |
| Parameter | Plot |
|---|---|
| CZT HV Monitor | 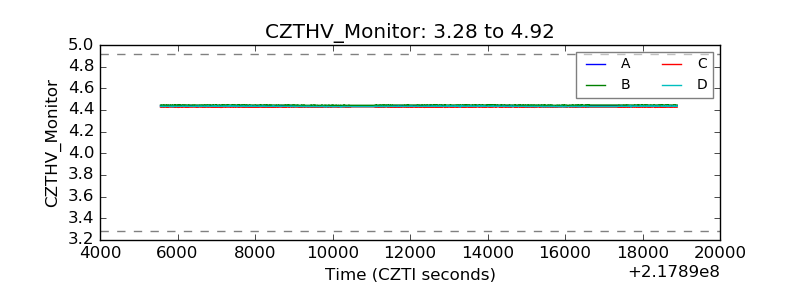 |
| D_VDD | 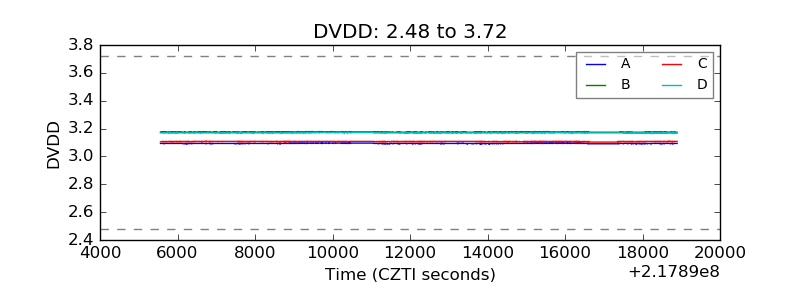 |
| Temperature 1 | 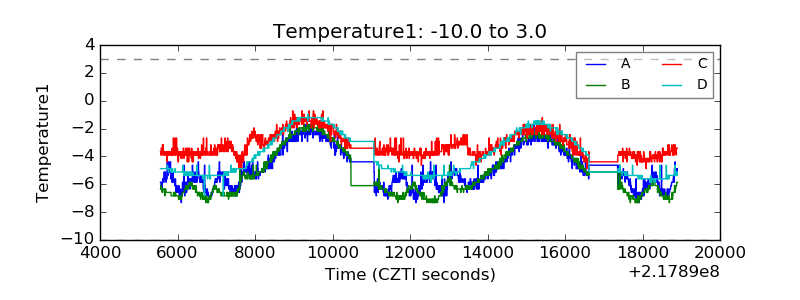 |
| Veto HV Monitor | 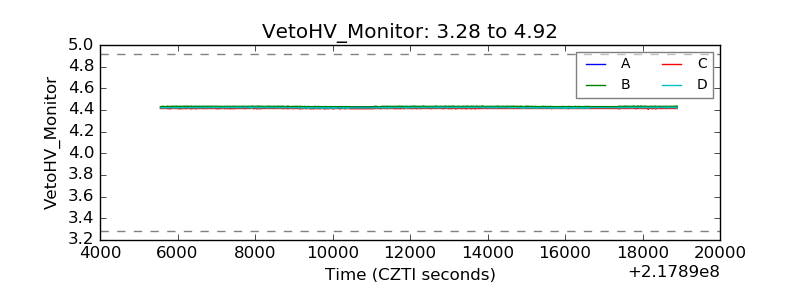 |
| Veto LLD | 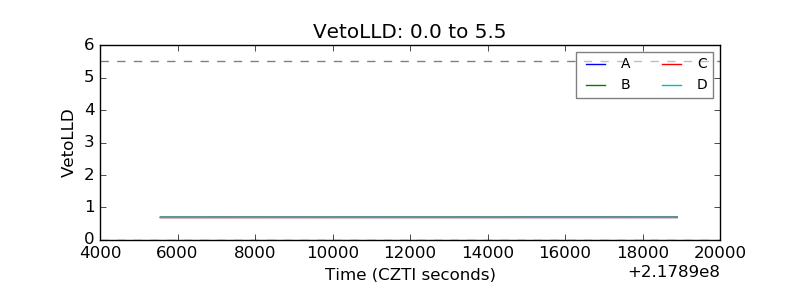 |
| Alpha Counter | 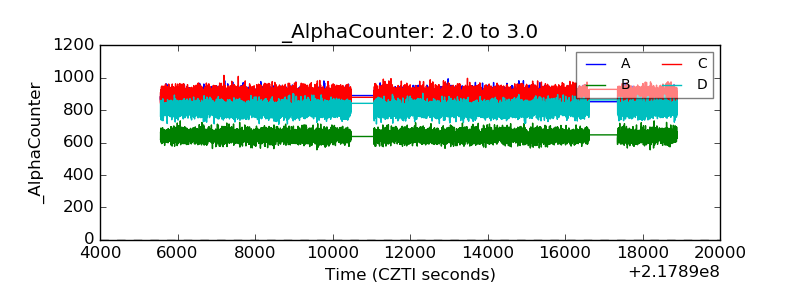 |
| _CPM_Rate | 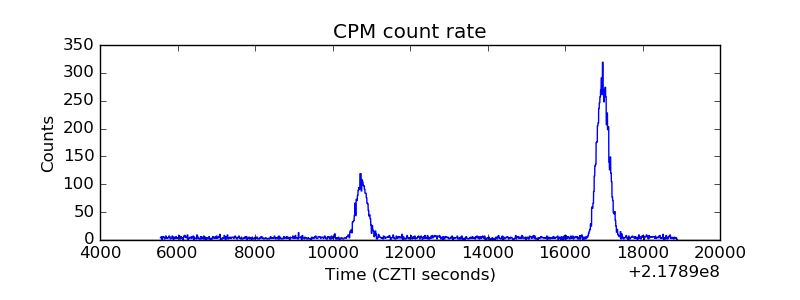 |
| CZT Counter | 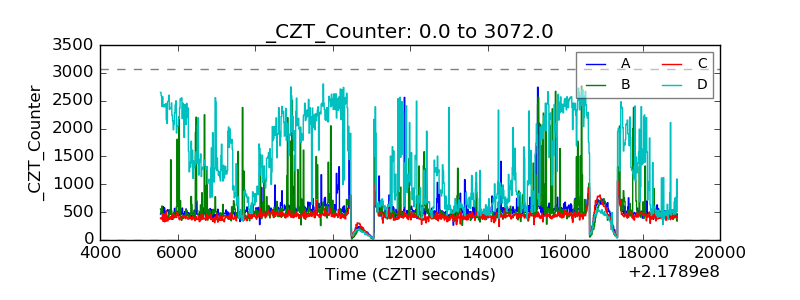 |
| +2.5 Volts monitor |  |
| +5 Volts monitor |  |
| _ROLL_ROT | 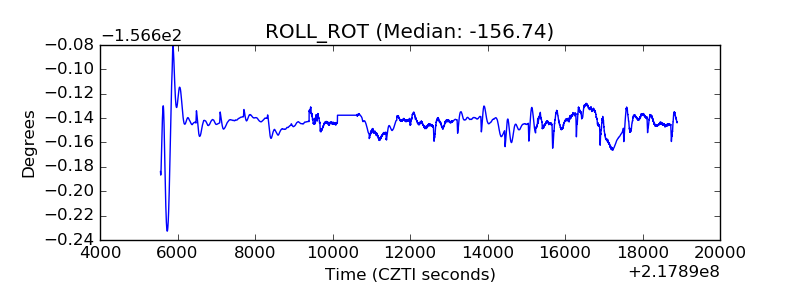 |
| _Roll_DEC | 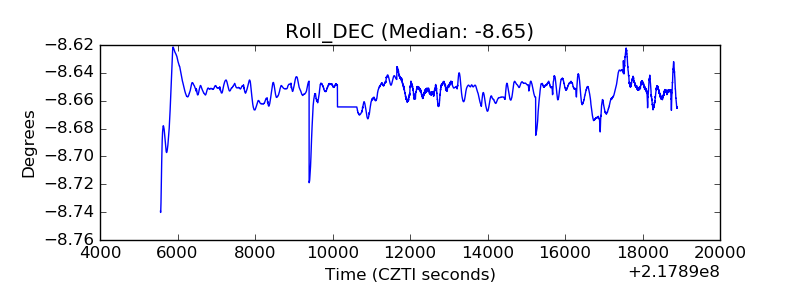 |
| _Roll_RA | 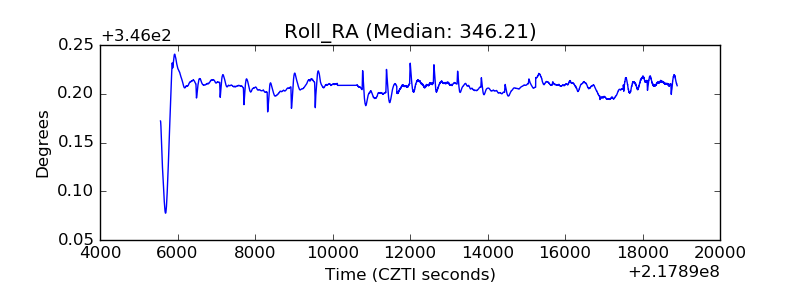 |
| Veto Counter | 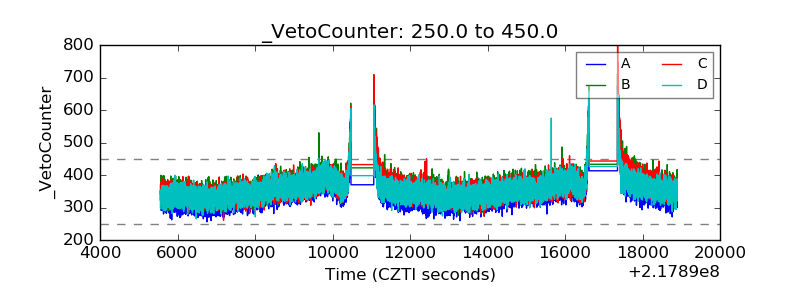 |