| Param | Original file | Final file |
|---|---|---|
| Filename | modeM0/AS1A02_070T01_9000000832_06305cztM0_level2.evt | modeM0/AS1A02_070T01_9000000832_06305cztM0_level2_quad_clean.evt |
| Size (bytes) | 583,439,040 | 66,263,040 |
| Size | 556.4 MB | 63.2 MB |
| Events in quadrant A | 3,712,011 | 382,373 |
| Events in quadrant B | 3,799,795 | 388,080 |
| Events in quadrant C | 3,152,106 | 392,952 |
| Events in quadrant D | 6,534,217 | 357,879 |
| Mode M9 | |||
|---|---|---|---|
| Quadrant | BADHDUFLAG | Total packets | Discarded packets |
| A | 0 | 16 | 0 |
| B | 0 | 16 | 0 |
| C | 0 | 16 | 0 |
| D | 0 | 16 | 0 |
| Mode SS | |||
|---|---|---|---|
| Quadrant | BADHDUFLAG | Total packets | Discarded packets |
| A | 0 | 144 | 0 |
| B | 0 | 144 | 0 |
| C | 0 | 144 | 0 |
| D | 0 | 144 | 0 |
| Mode M0 | |||
|---|---|---|---|
| Quadrant | BADHDUFLAG | Total packets | Discarded packets |
| A | 0 | 15213 | 3 |
| B | 0 | 15894 | 2 |
| C | 0 | 14291 | 2 |
| D | 0 | 24129 | 2 |
| Quadrant | Total seconds | Saturated seconds | Saturation percentage |
|---|---|---|---|
| A | 6956 | 69 | 0.991949% |
| B | 6956 | 165 | 2.372053% |
| C | 6956 | 40 | 0.575043% |
| D | 6956 | 634 | 9.114434% |
Noise dominated data is calculated using 1-second bins in cleaned event files. If a bin has >2000 counts, and if more than 50% of those come from <1% of pixels, then it is considered to be noise-dominated and hence unusable.
| Quadrant | # 1 sec bins | Bins with >0 counts | Bins with >2000 counts | High rate bins dominated by noise | Noise dominated (total time) | Noise dominated (detector-on time) | Marked lightcurve |
|---|---|---|---|---|---|---|---|
| A | 8591 | 6956 | 2 | 2 | 0.02% | 0.03% | 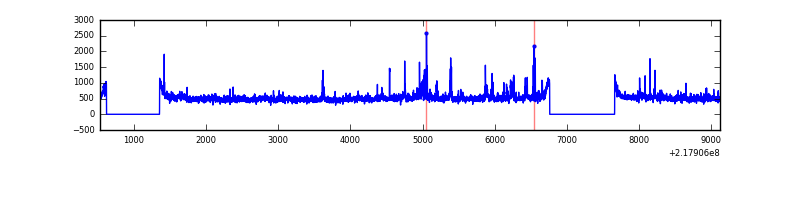 |
| B | 8591 | 6956 | 65 | 65 | 0.76% | 0.93% | 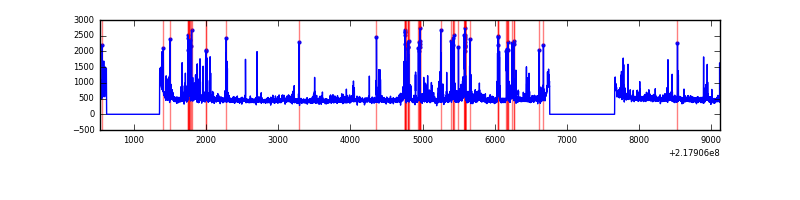 |
| C | 8591 | 6956 | 0 | 0 | 0.00% | 0.00% | 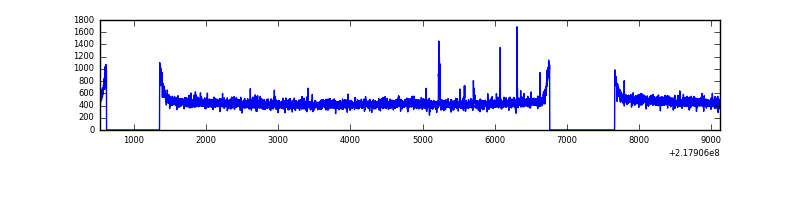 |
| D | 8591 | 6956 | 489 | 489 | 5.69% | 7.03% | 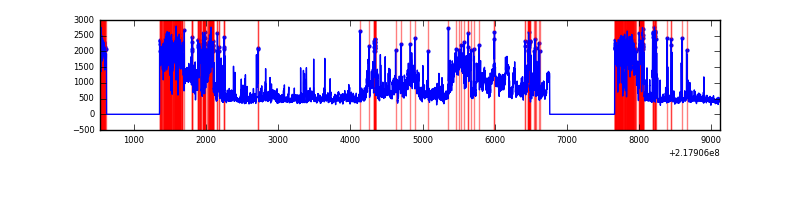 |
Top three noisy pixels from each quadrant. If the there are fewer than three noisy pixels in the level2.evt file, extra rows are filled as -1
| Pixel properties | Quadrant properties | ||||||
|---|---|---|---|---|---|---|---|
| Quadrant | DetID | PixID | Counts | Sigma | Mean | Median | Sigma |
| A | 8 | 15 | 458267 | 2734.56 | 814 | 795 | 167.3 |
| A | 15 | 174 | 70156 | 414.61 | 814 | 795 | 167.3 |
| A | 13 | 251 | 34218 | 199.79 | 814 | 795 | 167.3 |
| B | 3 | 64 | 419560 | 2621.48 | 824 | 803 | 159.7 |
| B | 4 | 81 | 97586 | 605.87 | 824 | 803 | 159.7 |
| B | 0 | 219 | 63826 | 394.53 | 824 | 803 | 159.7 |
| C | 9 | 16 | 24555 | 126.93 | 798 | 802 | 187.1 |
| C | 13 | 61 | 6361 | 29.71 | 798 | 802 | 187.1 |
| C | 9 | 54 | 6172 | 28.7 | 798 | 802 | 187.1 |
| D | 2 | 63 | 2447177 | 12933.45 | 768 | 744 | 189.2 |
| D | 12 | 220 | 394806 | 2083.27 | 768 | 744 | 189.2 |
| D | 12 | 110 | 365672 | 1929.25 | 768 | 744 | 189.2 |
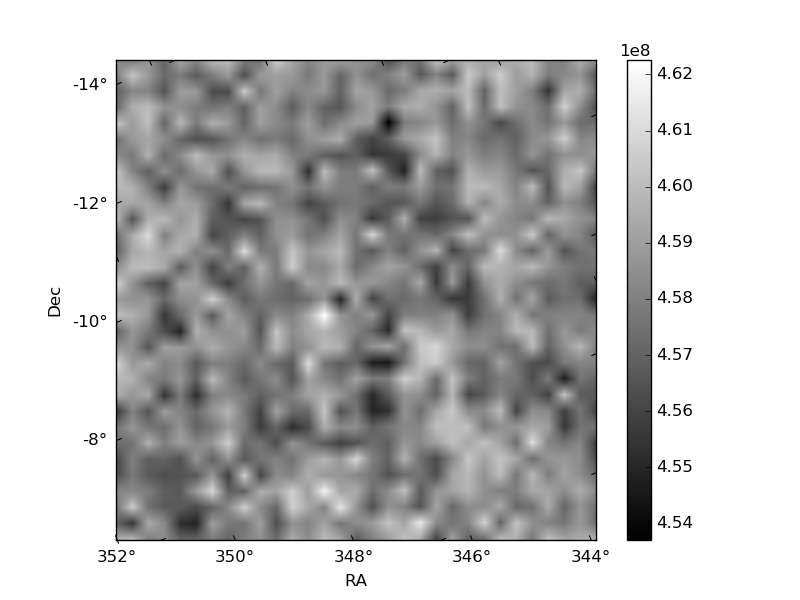
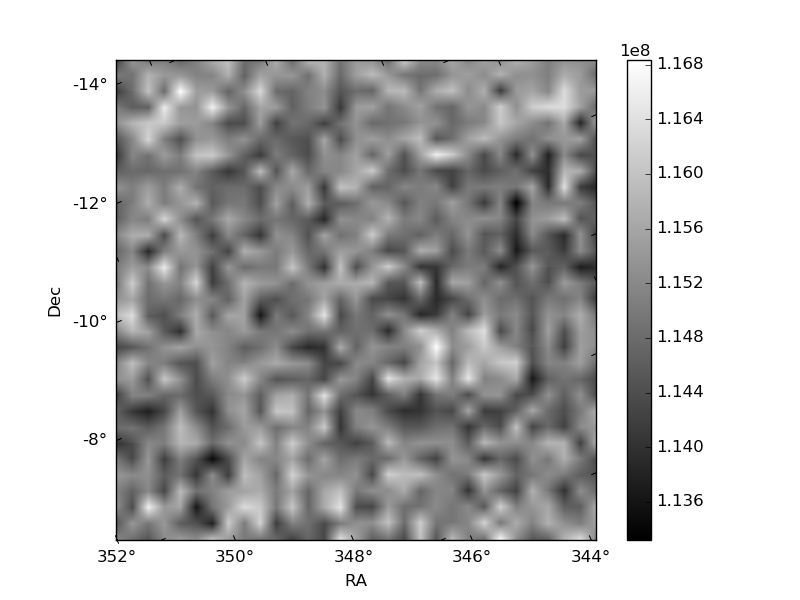
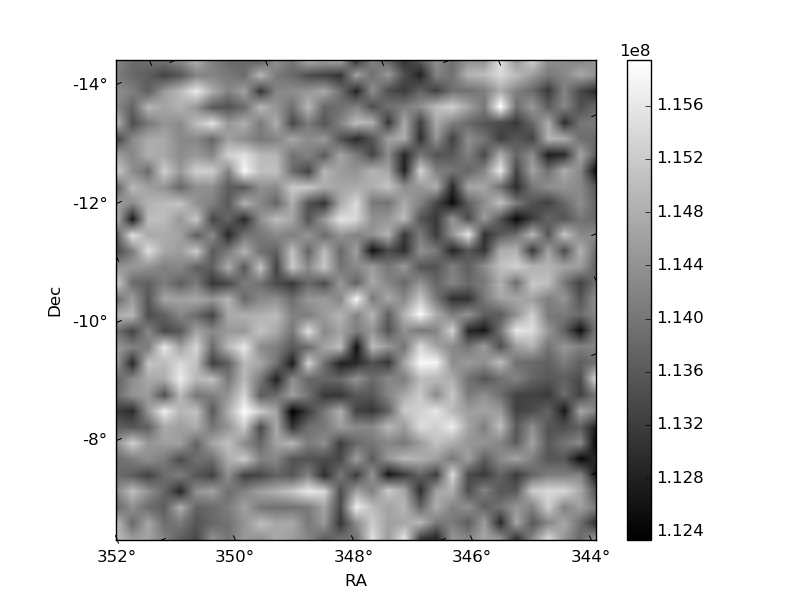
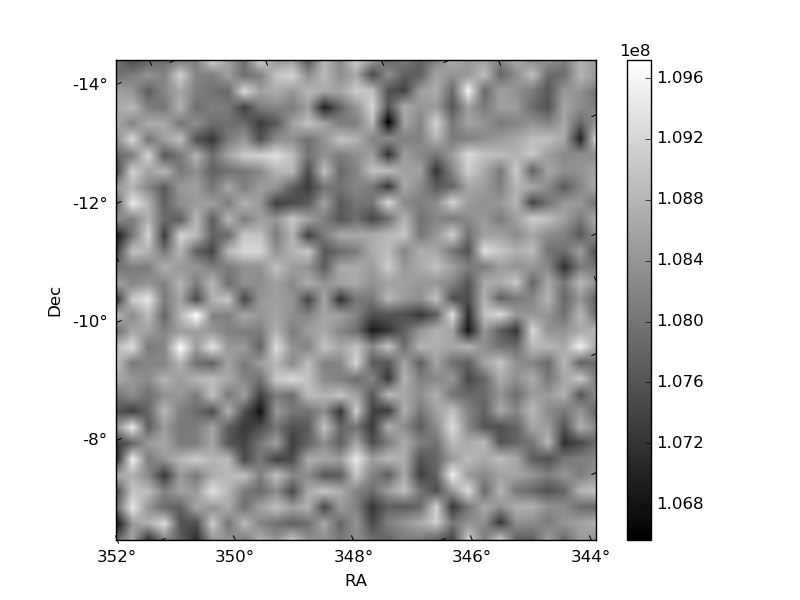
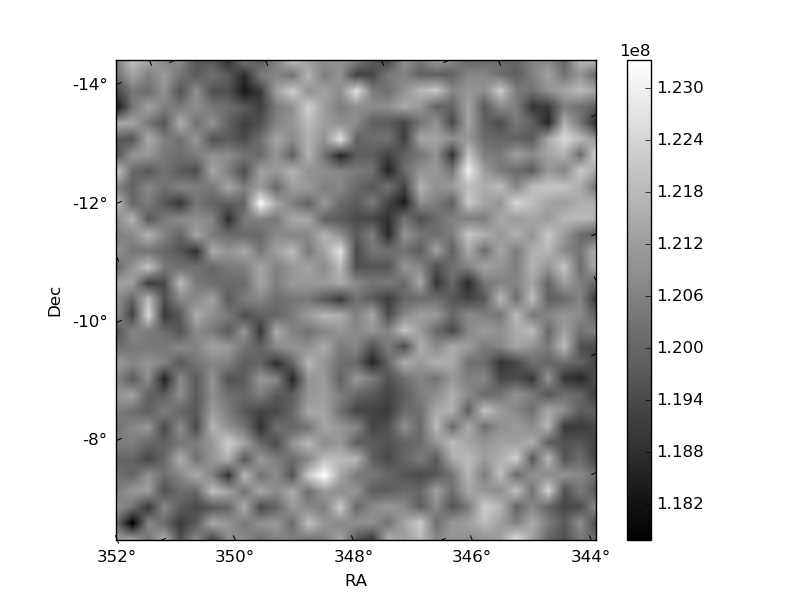
Histogram calculated using DETX and DETY for each event in the final _common_clean file
| Quadrant A | 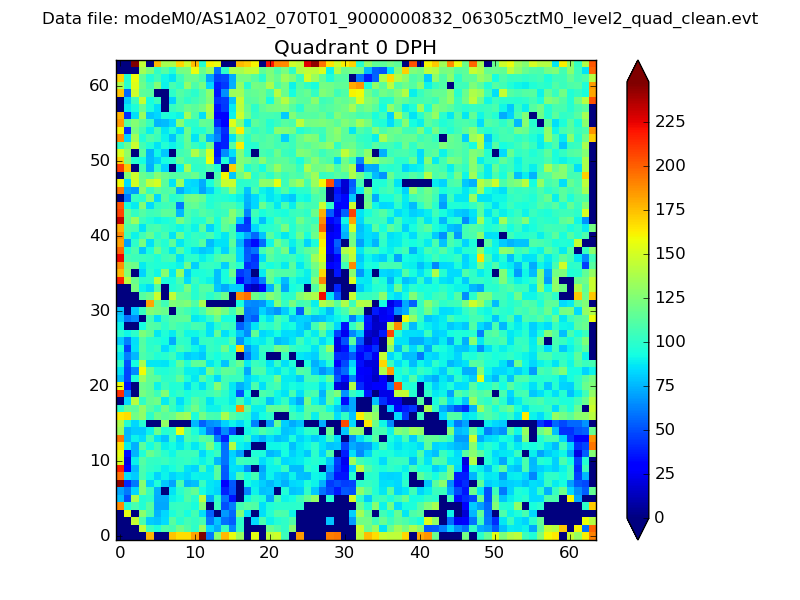 |
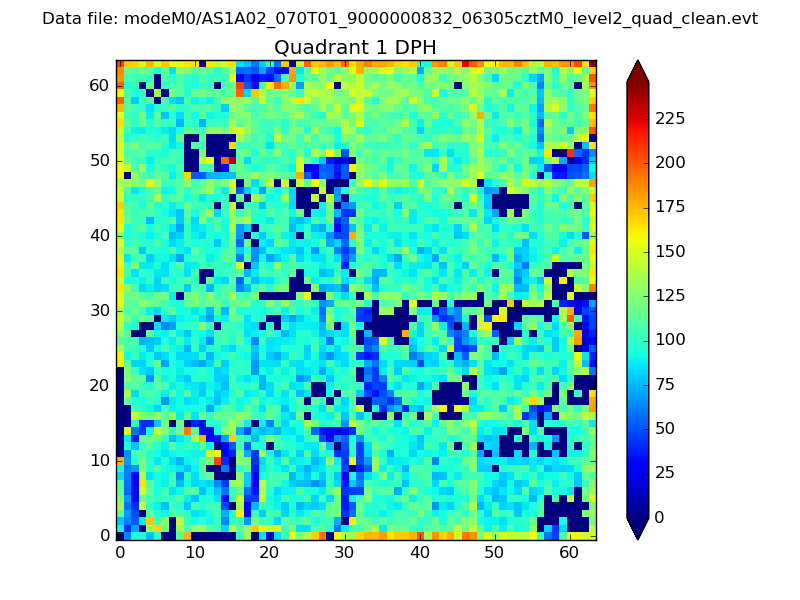 |
Quadrant B |
|---|---|---|---|
| Quadrant D | 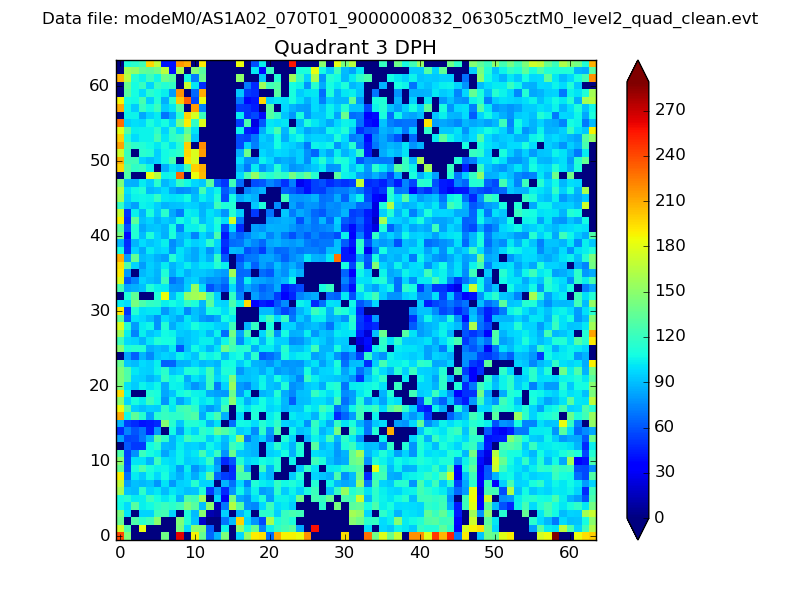 |
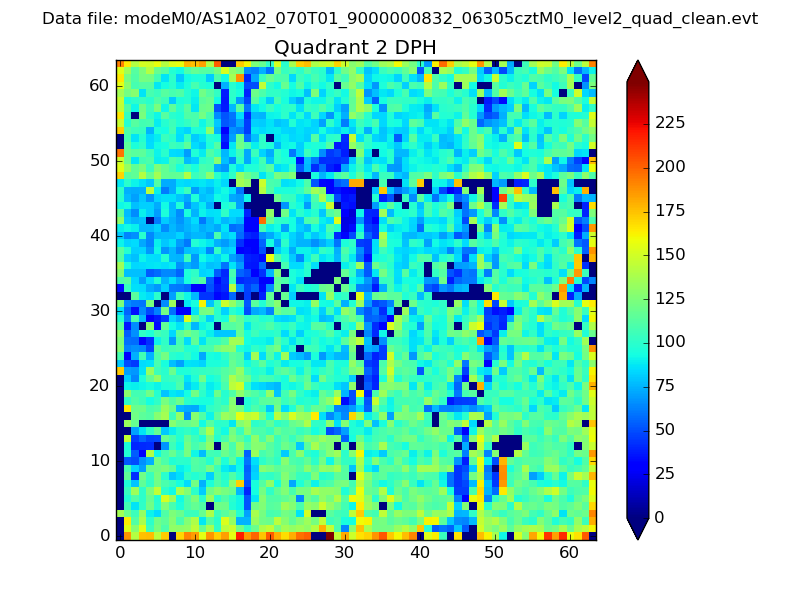 |
Quadrant C |
| Plot type | Count rate plots | Images |
|---|---|---|
| Comparison with Poisson distribution Blue bars denote a histogram of data divided into 1 sec bins. Red curve is a Poisson curve with rate = median count rate of data. |
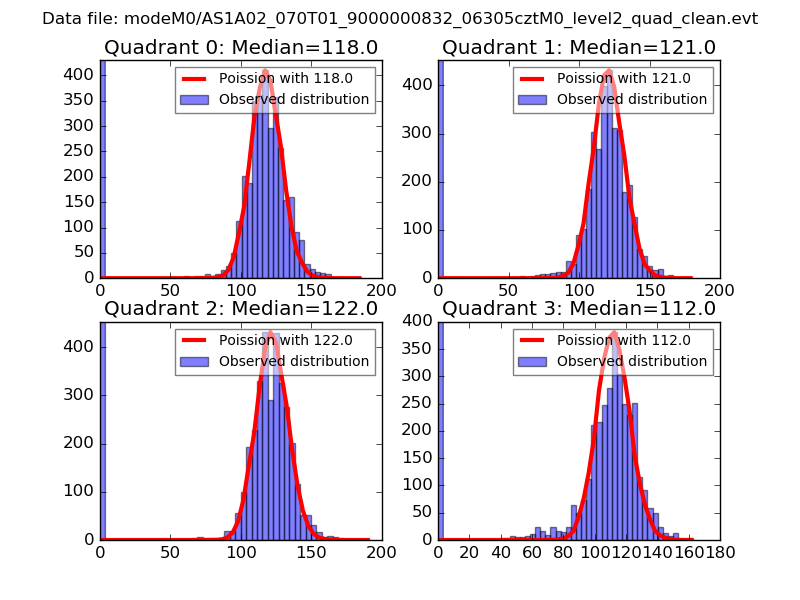 |
 |
| Quadrant-wise count rates Data is divided into 100 sec bins |
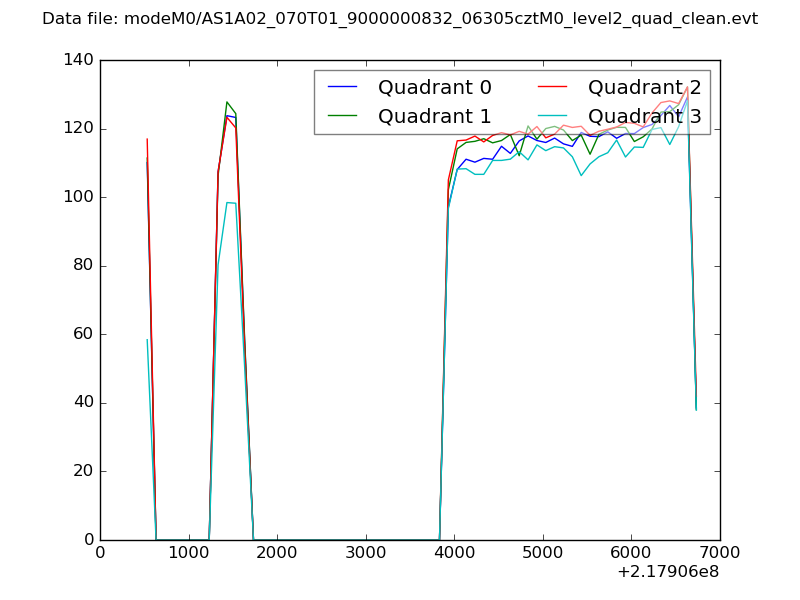 |
|
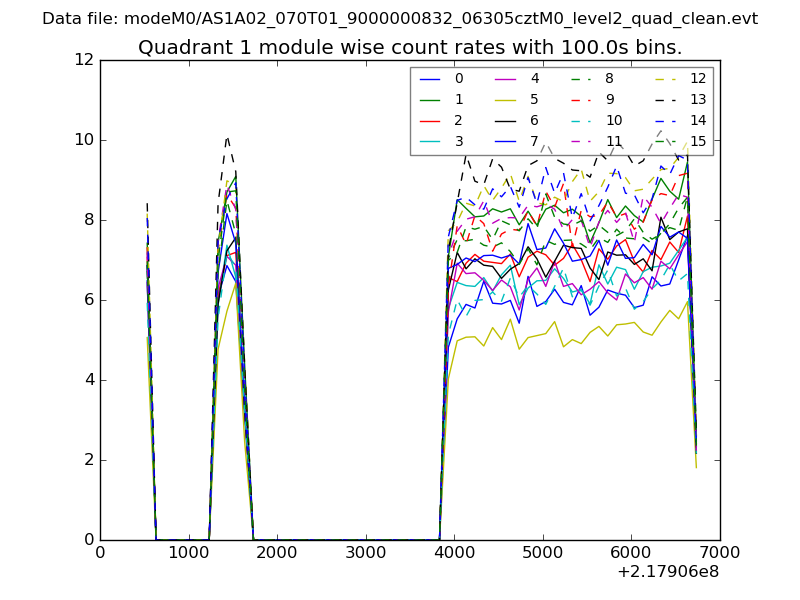
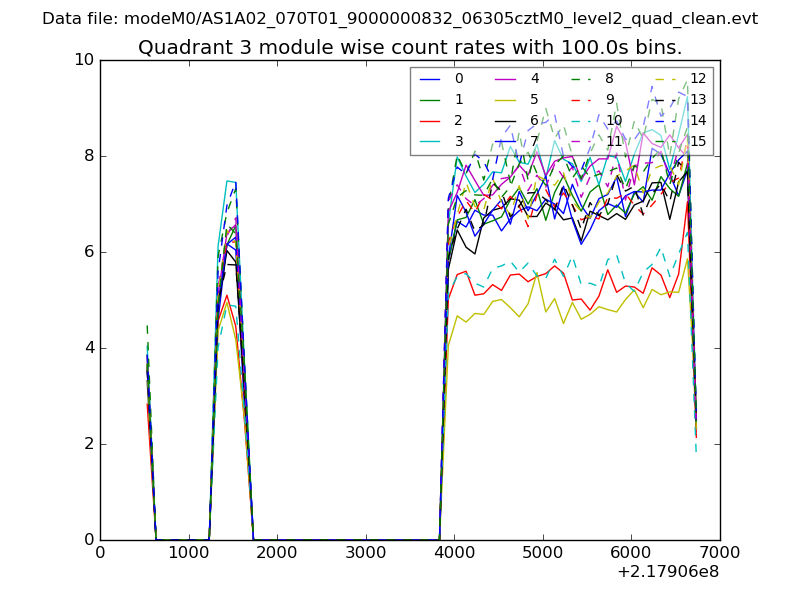
| Module-wise count rates for Quadrant A Data is divided into 100 sec bins |
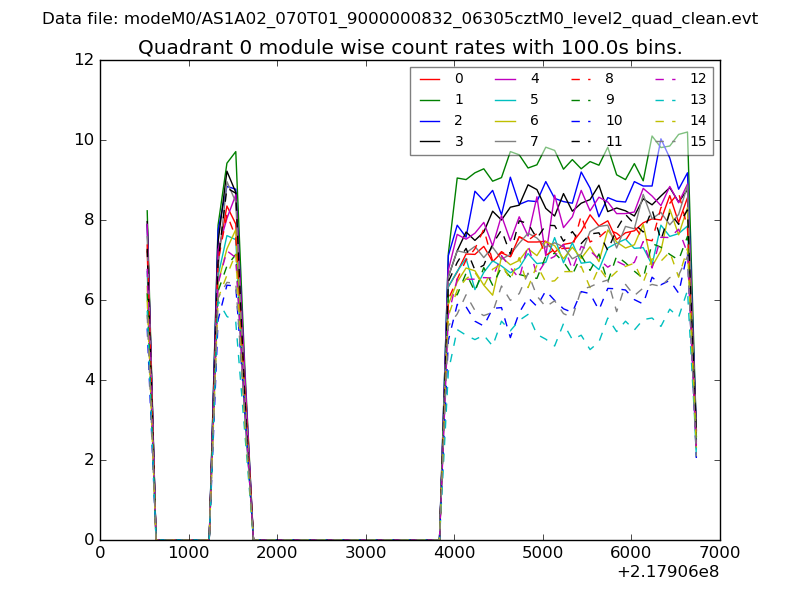 |
 |
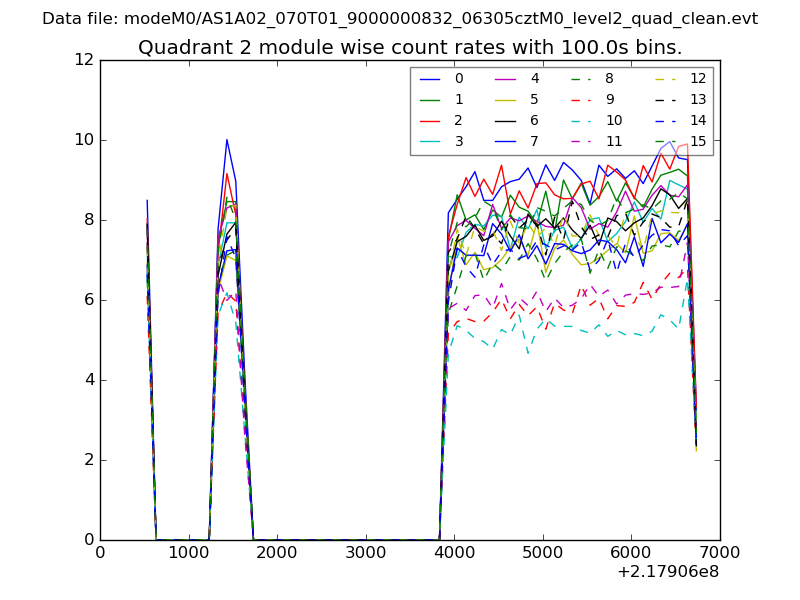
| Module-wise count rates for Quadrant B Data is divided into 100 sec bins |
 |
 |
| Module-wise count rates for Quadrant C Data is divided into 100 sec bins |
 |
 |
| Module-wise count rates for Quadrant D Data is divided into 100 sec bins |
 |
 |
| Parameter | Plot |
|---|---|
| CZT HV Monitor | 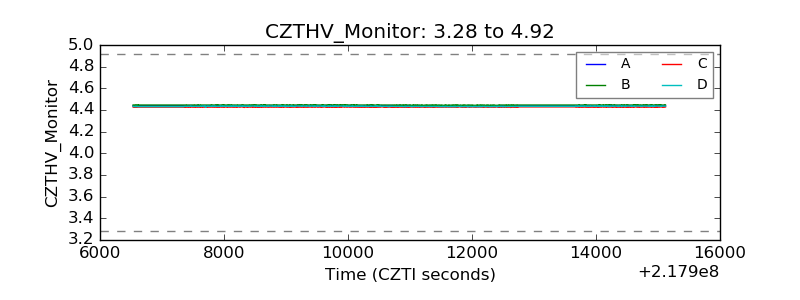 |
| D_VDD | 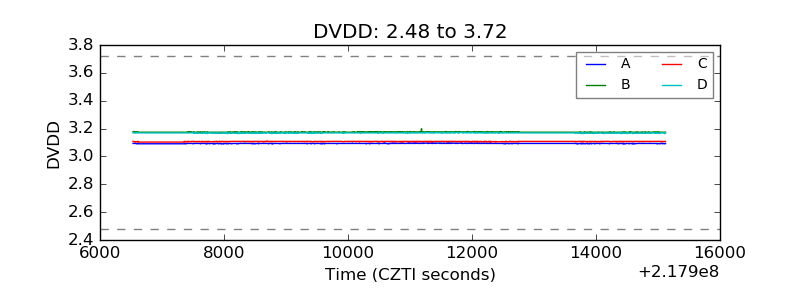 |
| Temperature 1 | 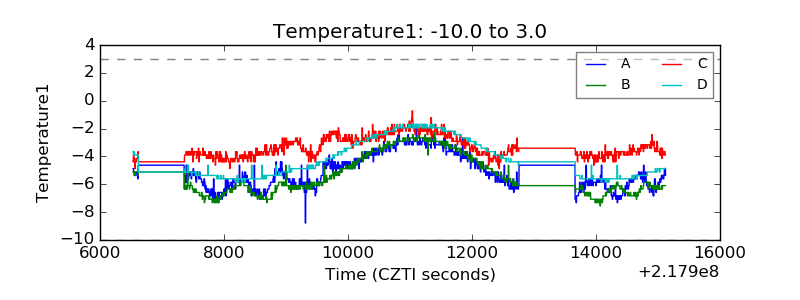 |
| Veto HV Monitor | 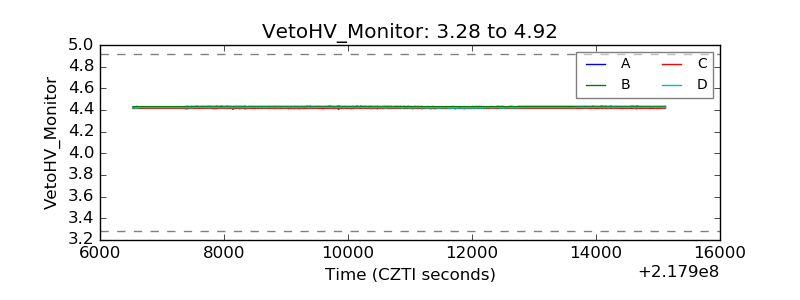 |
| Veto LLD | 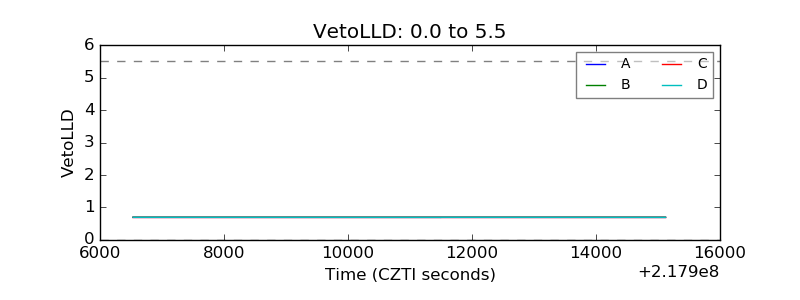 |
| Alpha Counter | 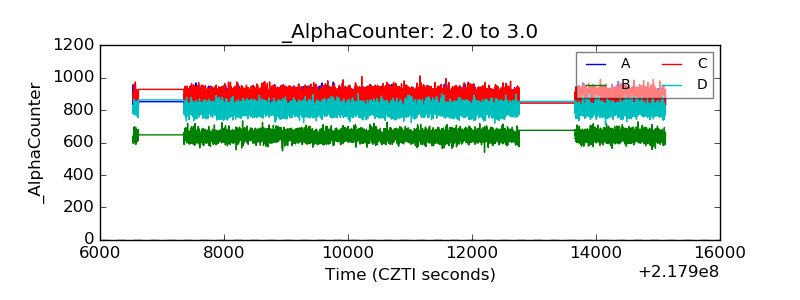 |
| _CPM_Rate | 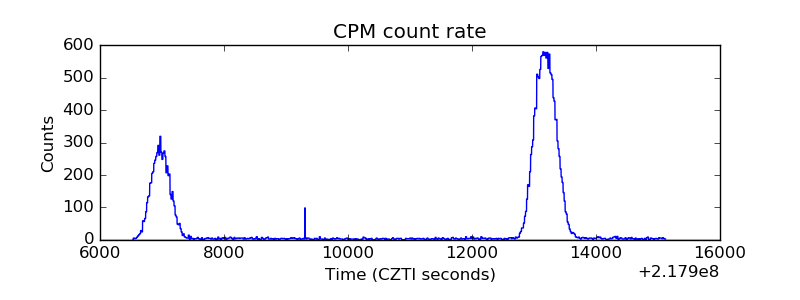 |
| CZT Counter | 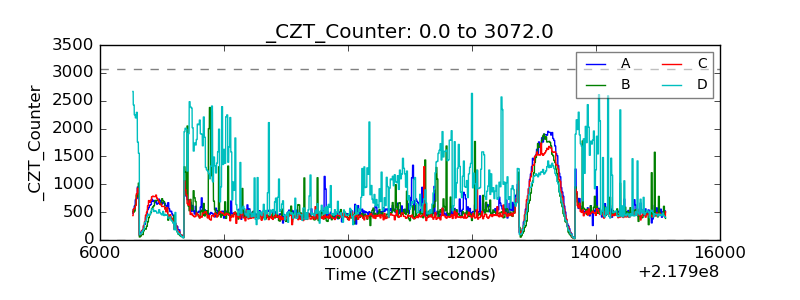 |
| +2.5 Volts monitor |  |
| +5 Volts monitor |  |
| _ROLL_ROT | 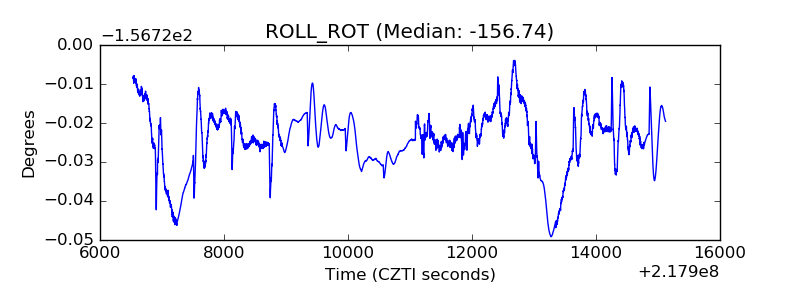 |
| _Roll_DEC | 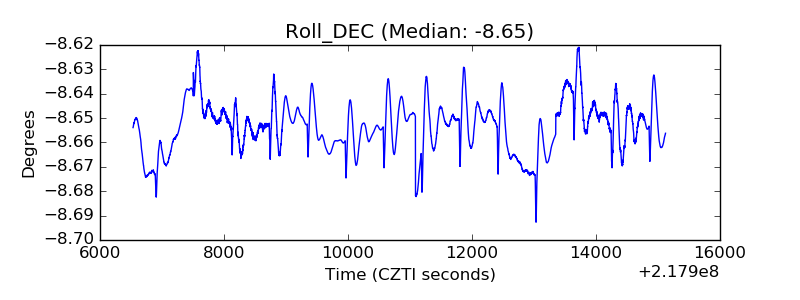 |
| _Roll_RA | 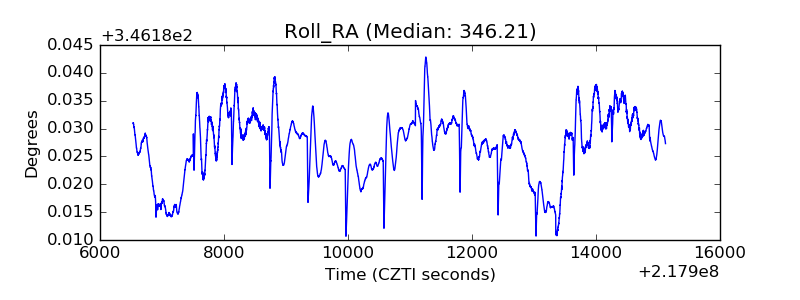 |
| Veto Counter | 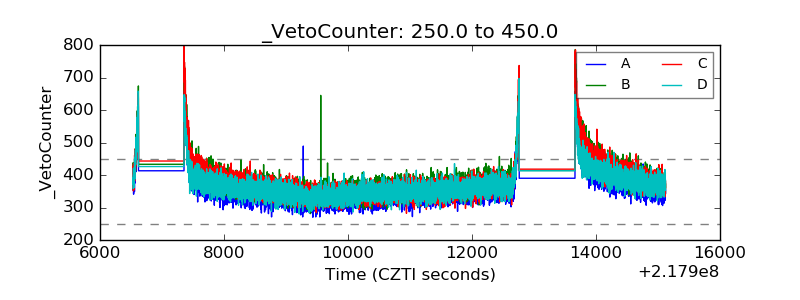 |