| Param | Original file | Final file |
|---|---|---|
| Filename | modeM0/AS1A02_070T01_9000000832_06308cztM0_level2.evt | modeM0/AS1A02_070T01_9000000832_06308cztM0_level2_quad_clean.evt |
| Size (bytes) | 342,840,960 | 47,715,840 |
| Size | 327.0 MB | 45.5 MB |
| Events in quadrant A | 2,122,578 | 298,406 |
| Events in quadrant B | 2,792,763 | 301,859 |
| Events in quadrant C | 1,782,966 | 301,453 |
| Events in quadrant D | 3,431,944 | 280,407 |
| Mode M9 | |||
|---|---|---|---|
| Quadrant | BADHDUFLAG | Total packets | Discarded packets |
| A | 0 | 12 | 0 |
| B | 0 | 12 | 0 |
| C | 0 | 12 | 0 |
| D | 0 | 12 | 0 |
| Mode SS | |||
|---|---|---|---|
| Quadrant | BADHDUFLAG | Total packets | Discarded packets |
| A | 0 | 76 | 0 |
| B | 0 | 76 | 0 |
| C | 0 | 76 | 0 |
| D | 0 | 76 | 0 |
| Mode M0 | |||
|---|---|---|---|
| Quadrant | BADHDUFLAG | Total packets | Discarded packets |
| A | 0 | 8639 | 32 |
| B | 0 | 10908 | 19 |
| C | 0 | 7885 | 56 |
| D | 0 | 12959 | 119 |
| Quadrant | Total seconds | Saturated seconds | Saturation percentage |
|---|---|---|---|
| A | 3712 | 43 | 1.158405% |
| B | 3718 | 366 | 9.844002% |
| C | 3703 | 25 | 0.675128% |
| D | 3703 | 241 | 6.508237% |
Noise dominated data is calculated using 1-second bins in cleaned event files. If a bin has >2000 counts, and if more than 50% of those come from <1% of pixels, then it is considered to be noise-dominated and hence unusable.
| Quadrant | # 1 sec bins | Bins with >0 counts | Bins with >2000 counts | High rate bins dominated by noise | Noise dominated (total time) | Noise dominated (detector-on time) | Marked lightcurve |
|---|---|---|---|---|---|---|---|
| A | 4882 | 3725 | 3 | 3 | 0.06% | 0.08% | 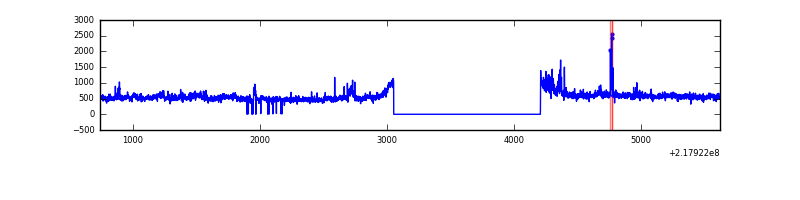 |
| B | 4882 | 3727 | 223 | 223 | 4.57% | 5.98% | 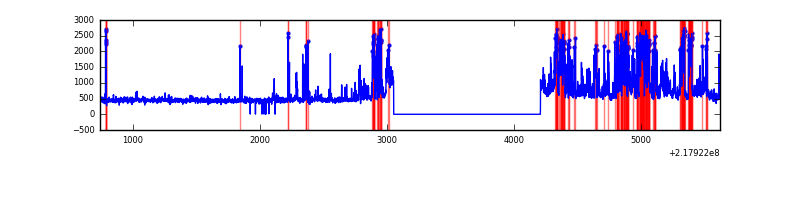 |
| C | 4882 | 3725 | 0 | 0 | 0.00% | 0.00% | 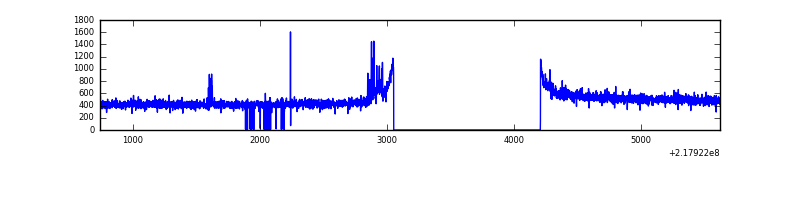 |
| D | 4882 | 3719 | 220 | 220 | 4.51% | 5.92% | 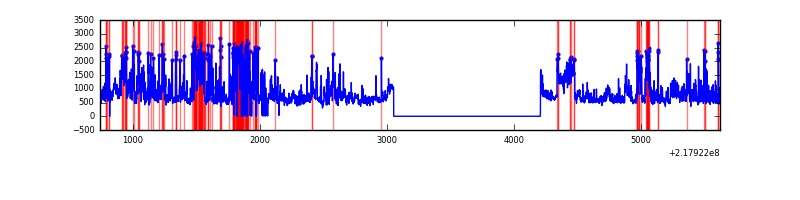 |
Top three noisy pixels from each quadrant. If the there are fewer than three noisy pixels in the level2.evt file, extra rows are filled as -1
| Pixel properties | Quadrant properties | ||||||
|---|---|---|---|---|---|---|---|
| Quadrant | DetID | PixID | Counts | Sigma | Mean | Median | Sigma |
| A | 8 | 15 | 301611 | 3179.69 | 457 | 447 | 94.7 |
| A | 13 | 251 | 56578 | 592.63 | 457 | 447 | 94.7 |
| A | 0 | 226 | 4400 | 41.74 | 457 | 447 | 94.7 |
| B | 3 | 64 | 967418 | 11111.53 | 450 | 439 | 87.0 |
| B | 10 | 213 | 34001 | 385.66 | 450 | 439 | 87.0 |
| B | 4 | 81 | 24622 | 277.89 | 450 | 439 | 87.0 |
| C | 9 | 16 | 30300 | 288.43 | 444 | 446 | 103.5 |
| C | 1 | 16 | 14254 | 133.41 | 444 | 446 | 103.5 |
| C | 9 | 54 | 6235 | 55.93 | 444 | 446 | 103.5 |
| D | 2 | 63 | 931963 | 8569.94 | 438 | 425 | 108.7 |
| D | 12 | 220 | 443985 | 4080.65 | 438 | 425 | 108.7 |
| D | 12 | 110 | 257221 | 2362.47 | 438 | 425 | 108.7 |
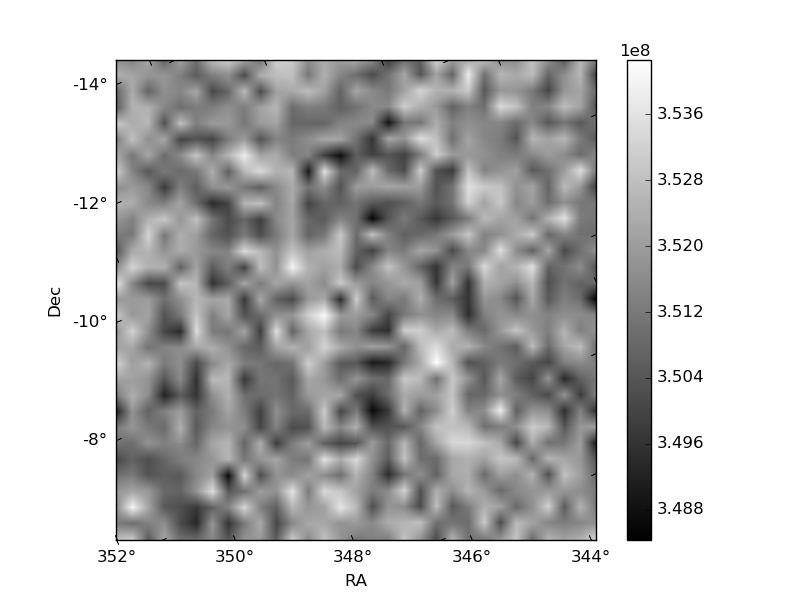
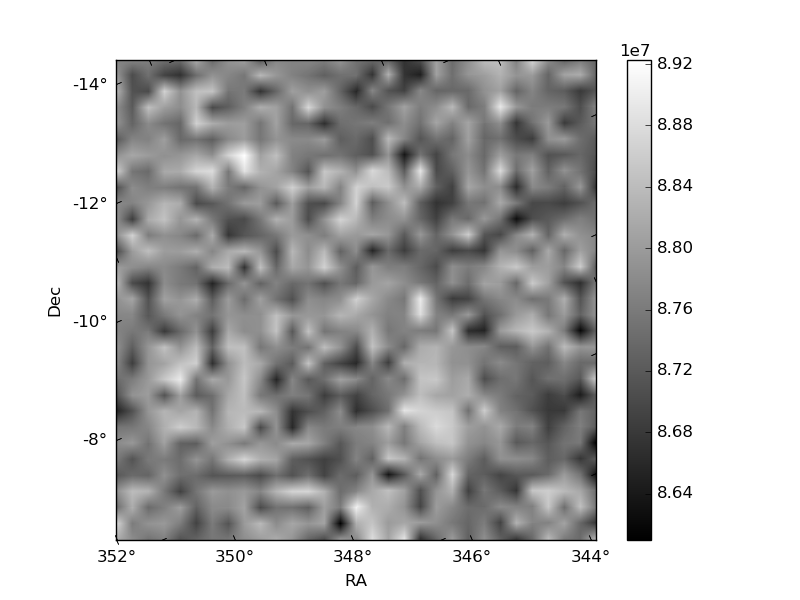
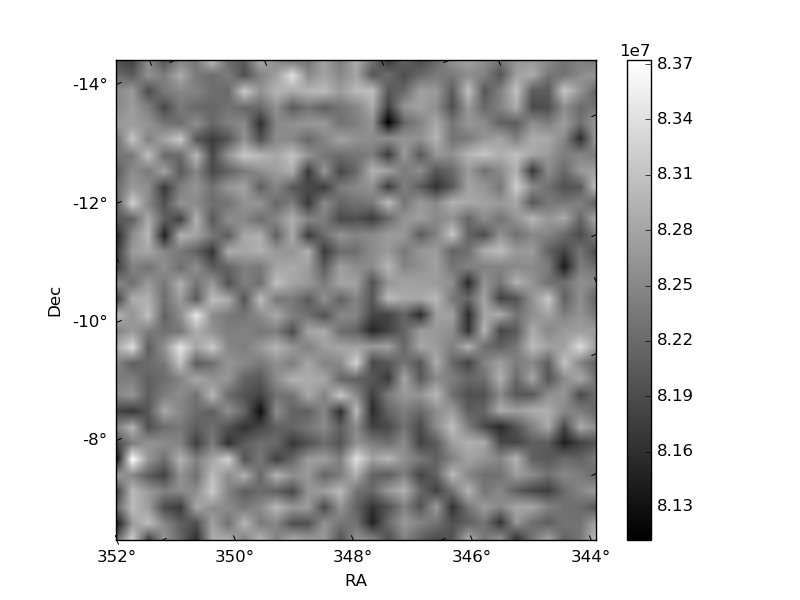
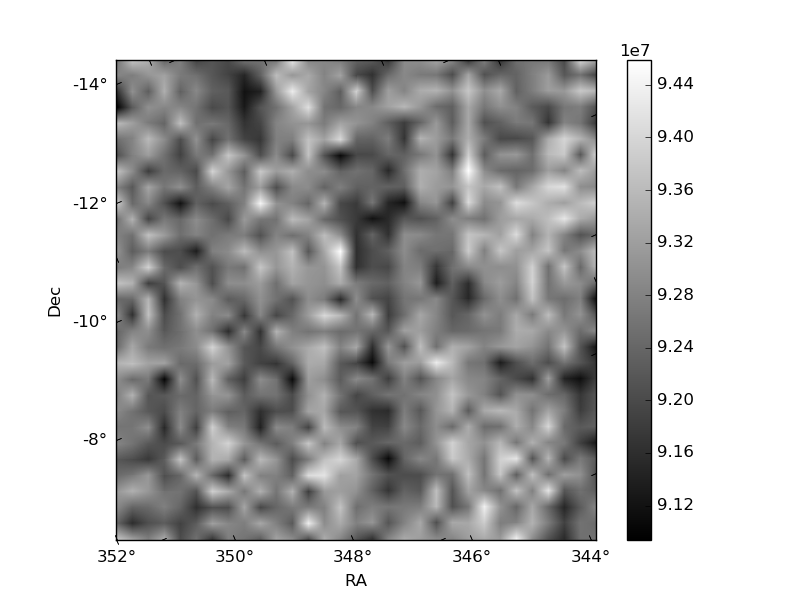
Histogram calculated using DETX and DETY for each event in the final _common_clean file
| Quadrant A | 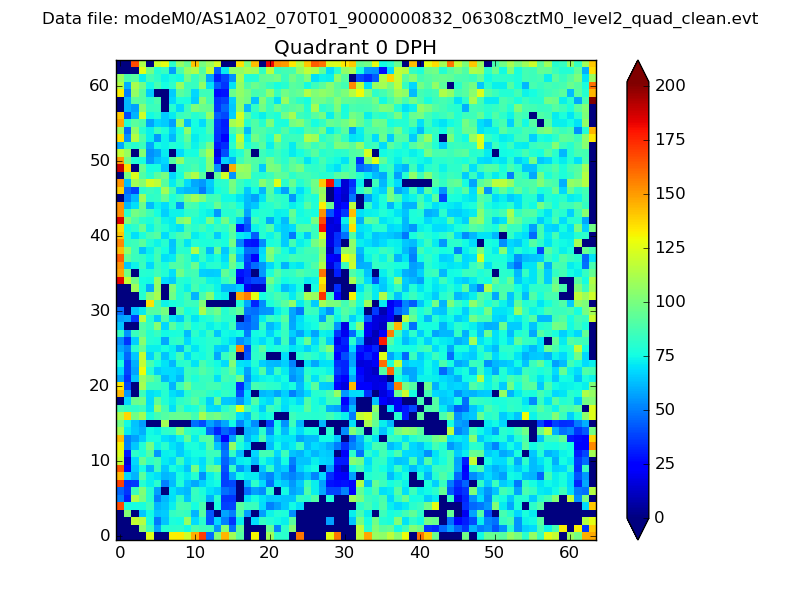 |
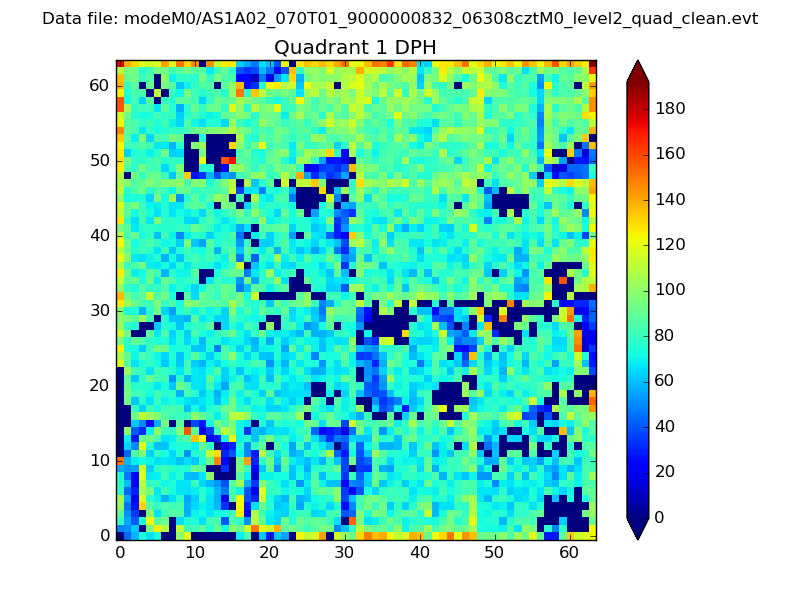 |
Quadrant B |
|---|---|---|---|
| Quadrant D | 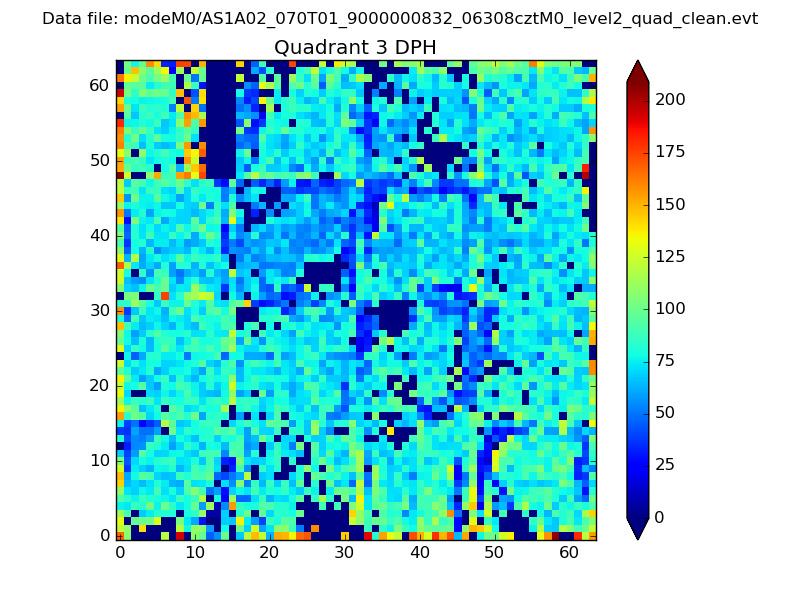 |
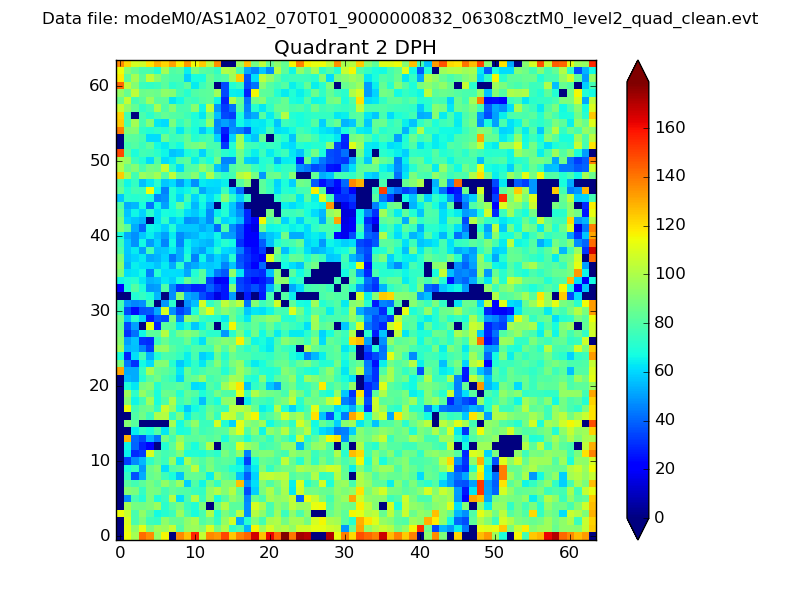 |
Quadrant C |
| Plot type | Count rate plots | Images |
|---|---|---|
| Comparison with Poisson distribution Blue bars denote a histogram of data divided into 1 sec bins. Red curve is a Poisson curve with rate = median count rate of data. |
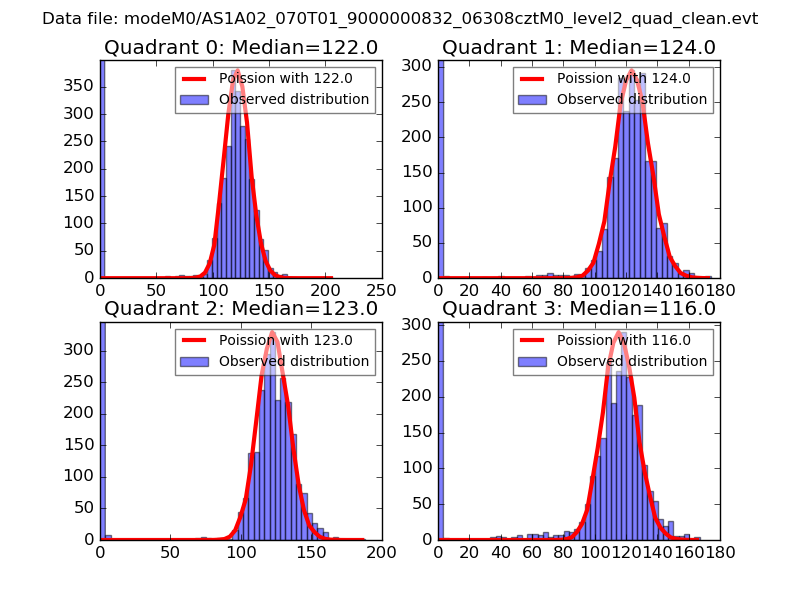 |
 |
| Quadrant-wise count rates Data is divided into 100 sec bins |
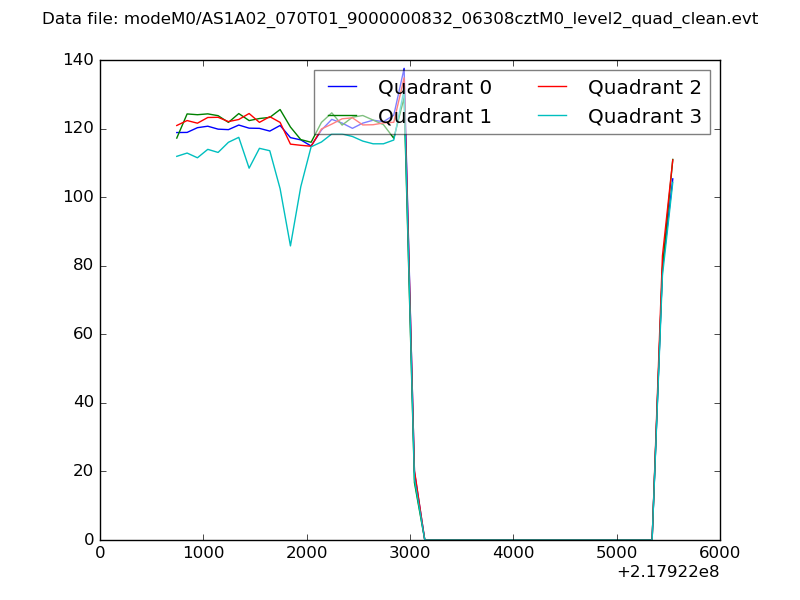 |
|
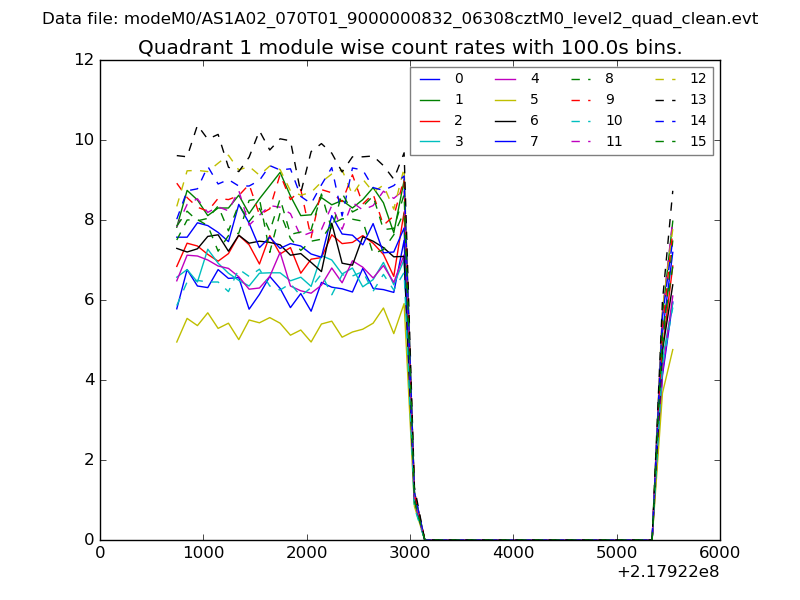
| Module-wise count rates for Quadrant A Data is divided into 100 sec bins |
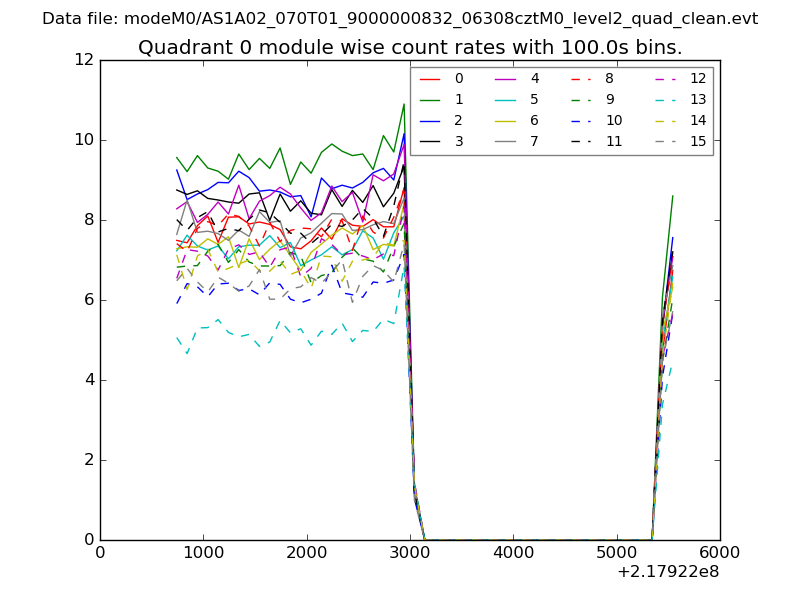 |
 |
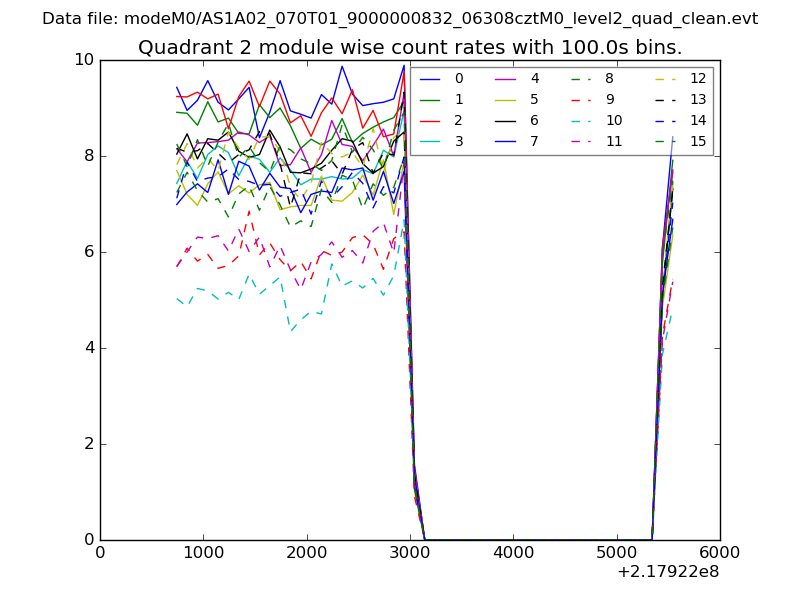
| Module-wise count rates for Quadrant B Data is divided into 100 sec bins |
 |
 |
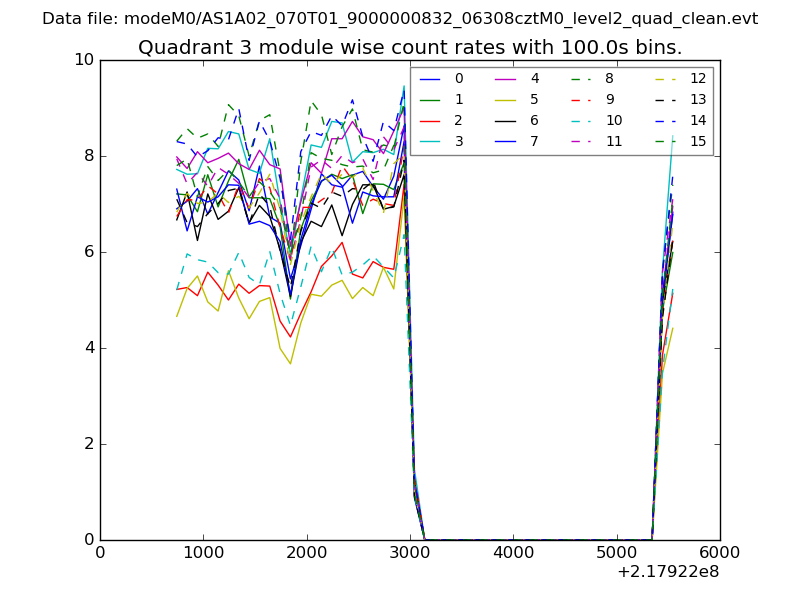
| Module-wise count rates for Quadrant C Data is divided into 100 sec bins |
 |
 |
| Module-wise count rates for Quadrant D Data is divided into 100 sec bins |
 |
 |
| Parameter | Plot |
|---|---|
| CZT HV Monitor | 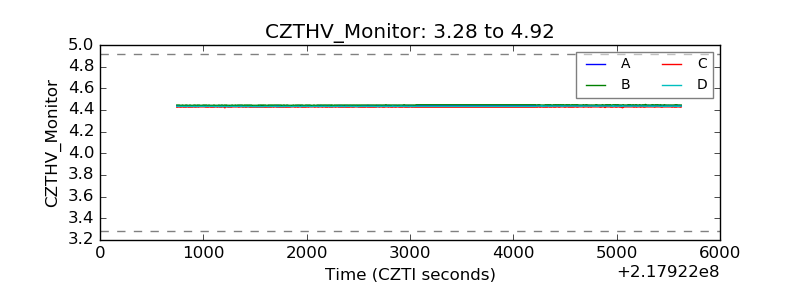 |
| D_VDD | 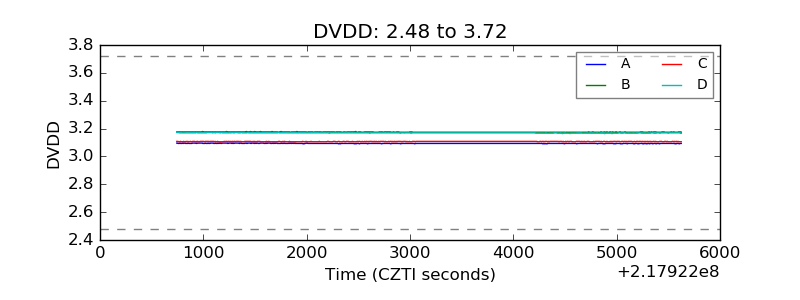 |
| Temperature 1 | 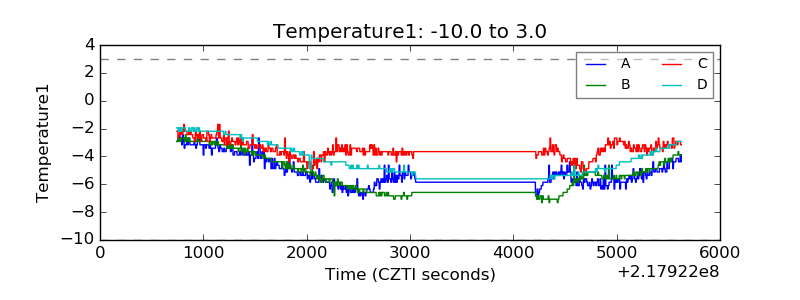 |
| Veto HV Monitor | 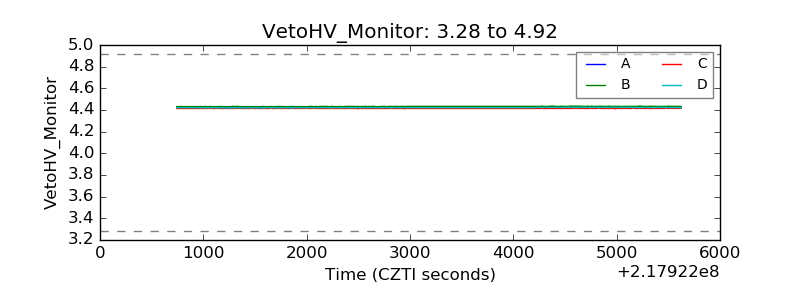 |
| Veto LLD | 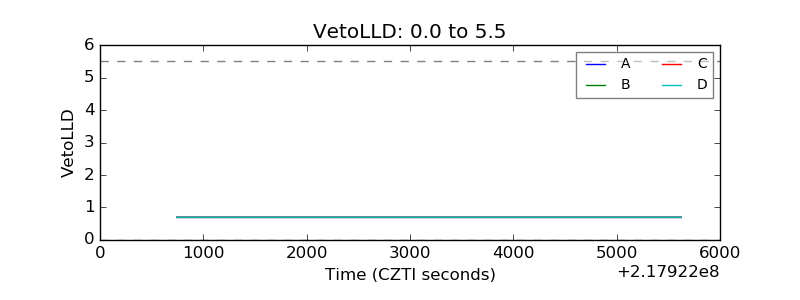 |
| Alpha Counter | 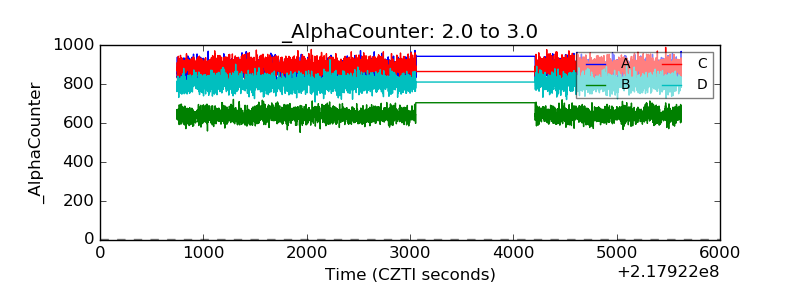 |
| _CPM_Rate | 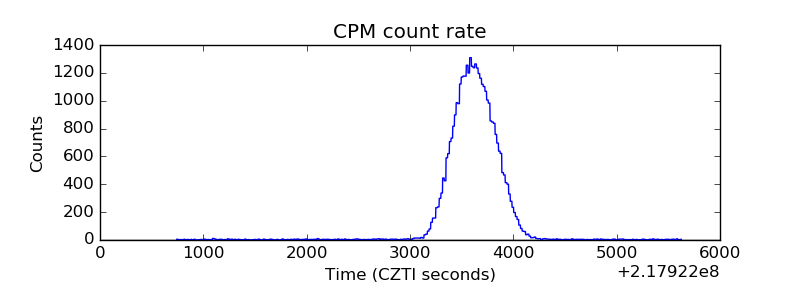 |
| CZT Counter | 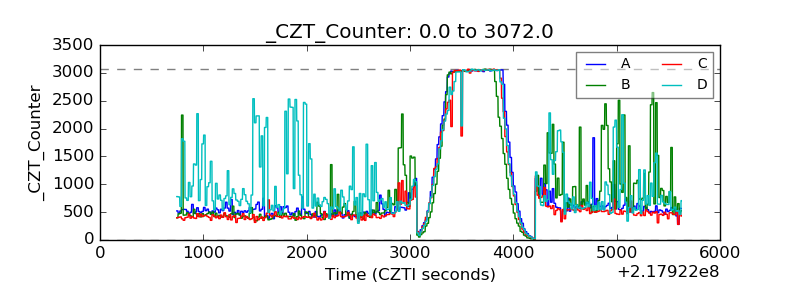 |
| +2.5 Volts monitor |  |
| +5 Volts monitor |  |
| _ROLL_ROT | 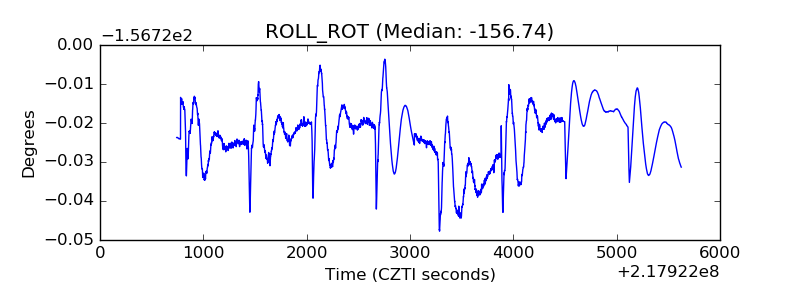 |
| _Roll_DEC | 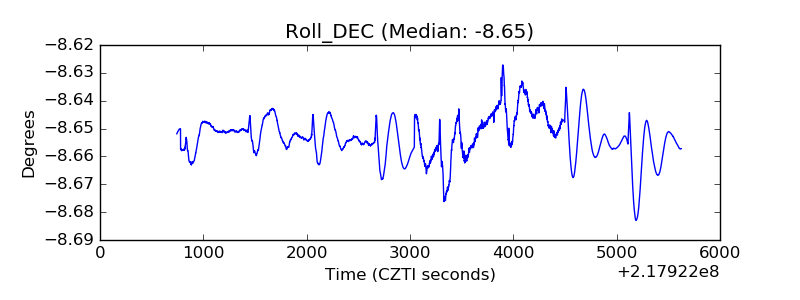 |
| _Roll_RA | 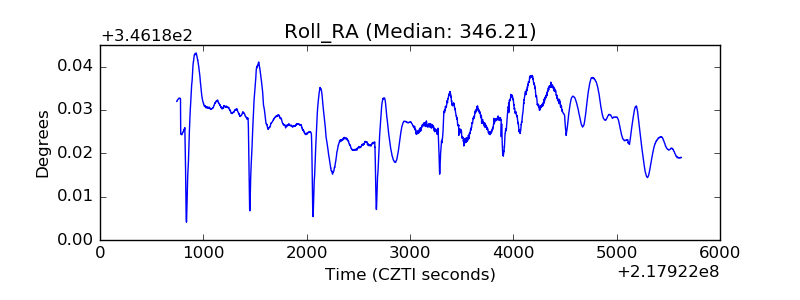 |
| Veto Counter | 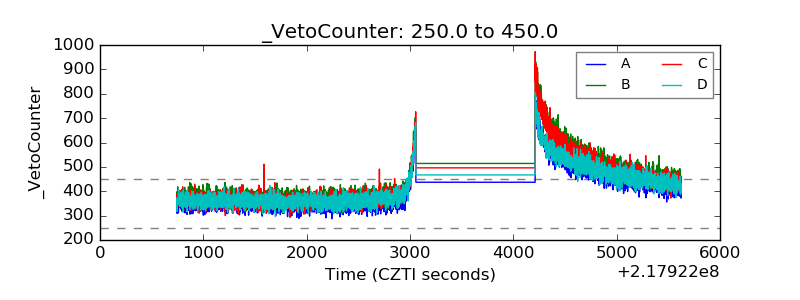 |