| Param | Original file | Final file |
|---|---|---|
| Filename | modeM0/AS1A02_070T01_9000000832_06309cztM0_level2.evt | modeM0/AS1A02_070T01_9000000832_06309cztM0_level2_quad_clean.evt |
| Size (bytes) | 593,916,480 | 82,082,880 |
| Size | 566.4 MB | 78.3 MB |
| Events in quadrant A | 3,674,678 | 518,159 |
| Events in quadrant B | 4,630,108 | 526,147 |
| Events in quadrant C | 3,035,914 | 528,640 |
| Events in quadrant D | 6,218,483 | 471,681 |
| Mode M9 | |||
|---|---|---|---|
| Quadrant | BADHDUFLAG | Total packets | Discarded packets |
| A | 0 | 12 | 0 |
| B | 0 | 12 | 0 |
| C | 0 | 12 | 0 |
| D | 0 | 12 | 0 |
| Mode SS | |||
|---|---|---|---|
| Quadrant | BADHDUFLAG | Total packets | Discarded packets |
| A | 0 | 128 | 0 |
| B | 0 | 128 | 0 |
| C | 0 | 128 | 0 |
| D | 0 | 128 | 0 |
| Mode M0 | |||
|---|---|---|---|
| Quadrant | BADHDUFLAG | Total packets | Discarded packets |
| A | 0 | 14862 | 2 |
| B | 0 | 17877 | 1 |
| C | 0 | 13167 | 1 |
| D | 0 | 22795 | 1 |
| Quadrant | Total seconds | Saturated seconds | Saturation percentage |
|---|---|---|---|
| A | 6315 | 87 | 1.377672% |
| B | 6315 | 512 | 8.107680% |
| C | 6315 | 75 | 1.187648% |
| D | 6315 | 875 | 13.855899% |
Noise dominated data is calculated using 1-second bins in cleaned event files. If a bin has >2000 counts, and if more than 50% of those come from <1% of pixels, then it is considered to be noise-dominated and hence unusable.
| Quadrant | # 1 sec bins | Bins with >0 counts | Bins with >2000 counts | High rate bins dominated by noise | Noise dominated (total time) | Noise dominated (detector-on time) | Marked lightcurve |
|---|---|---|---|---|---|---|---|
| A | 7510 | 6315 | 5 | 5 | 0.07% | 0.08% |  |
| B | 7510 | 6315 | 316 | 316 | 4.21% | 5.00% |  |
| C | 7510 | 6315 | 1 | 1 | 0.01% | 0.02% |  |
| D | 7510 | 6315 | 609 | 609 | 8.11% | 9.64% |  |
Top three noisy pixels from each quadrant. If the there are fewer than three noisy pixels in the level2.evt file, extra rows are filled as -1
| Pixel properties | Quadrant properties | ||||||
|---|---|---|---|---|---|---|---|
| Quadrant | DetID | PixID | Counts | Sigma | Mean | Median | Sigma |
| A | 8 | 15 | 507822 | 3130.62 | 798 | 781 | 162.0 |
| A | 13 | 251 | 85155 | 520.95 | 798 | 781 | 162.0 |
| A | 0 | 226 | 7685 | 42.63 | 798 | 781 | 162.0 |
| B | 3 | 64 | 1442649 | 9665.22 | 788 | 772 | 149.2 |
| B | 10 | 213 | 94207 | 626.32 | 788 | 772 | 149.2 |
| B | 12 | 111 | 14603 | 92.71 | 788 | 772 | 149.2 |
| C | 1 | 16 | 25270 | 137.58 | 772 | 780 | 178.0 |
| C | 13 | 61 | 6136 | 30.09 | 772 | 780 | 178.0 |
| C | 8 | 222 | 2458 | 9.43 | 772 | 780 | 178.0 |
| D | 2 | 63 | 2071293 | 11344.85 | 747 | 726 | 182.5 |
| D | 12 | 220 | 927447 | 5077.6 | 747 | 726 | 182.5 |
| D | 12 | 110 | 113489 | 617.84 | 747 | 726 | 182.5 |
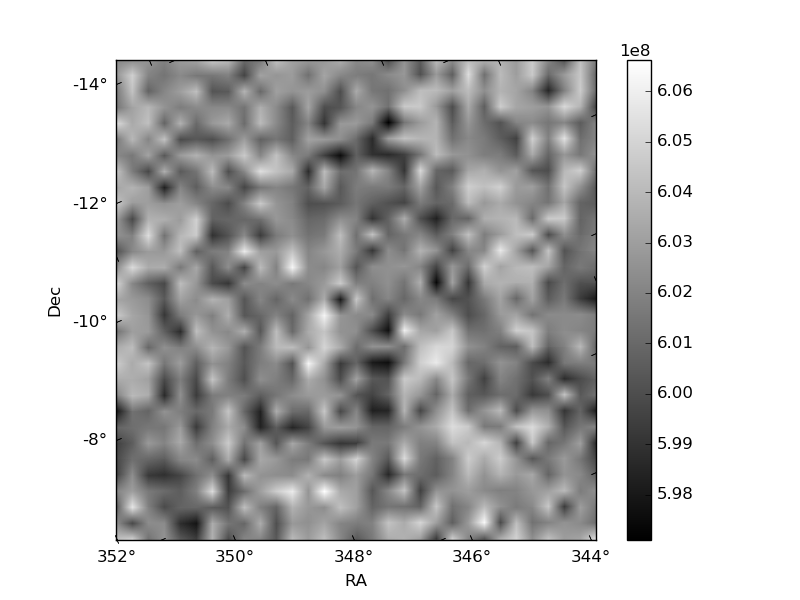
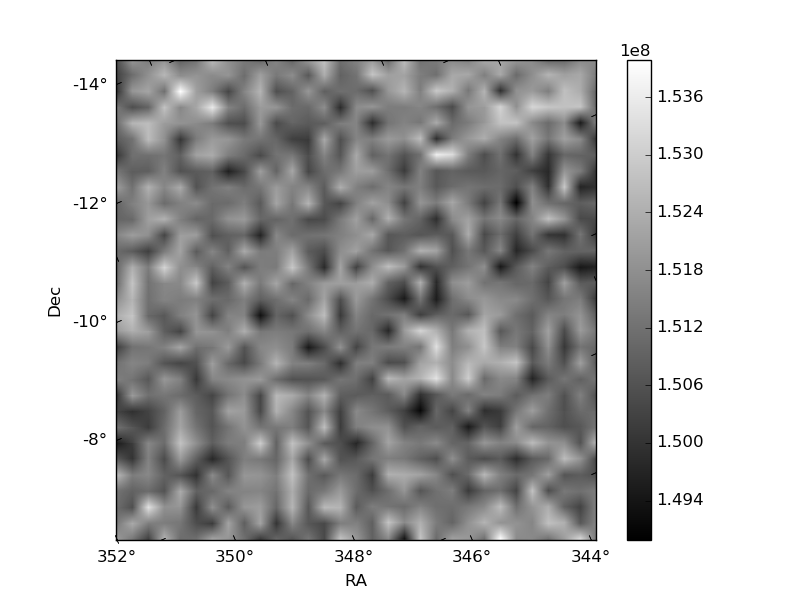
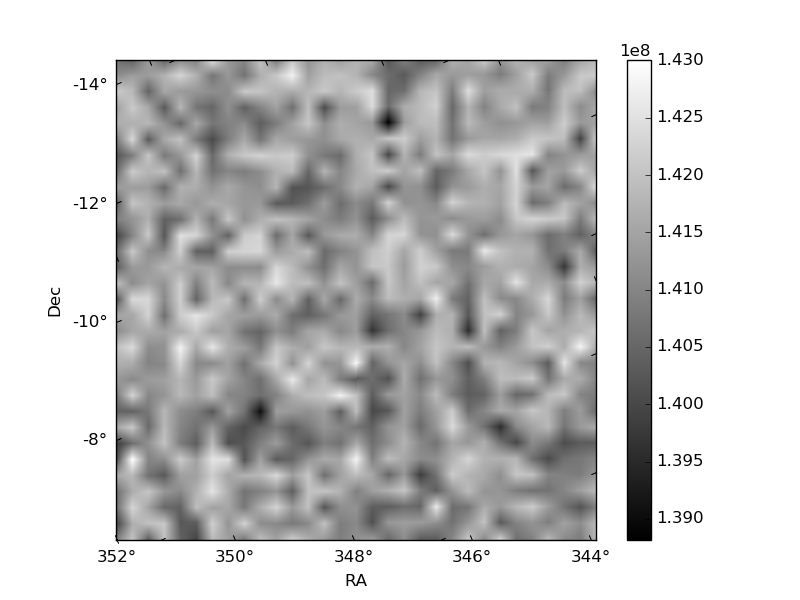
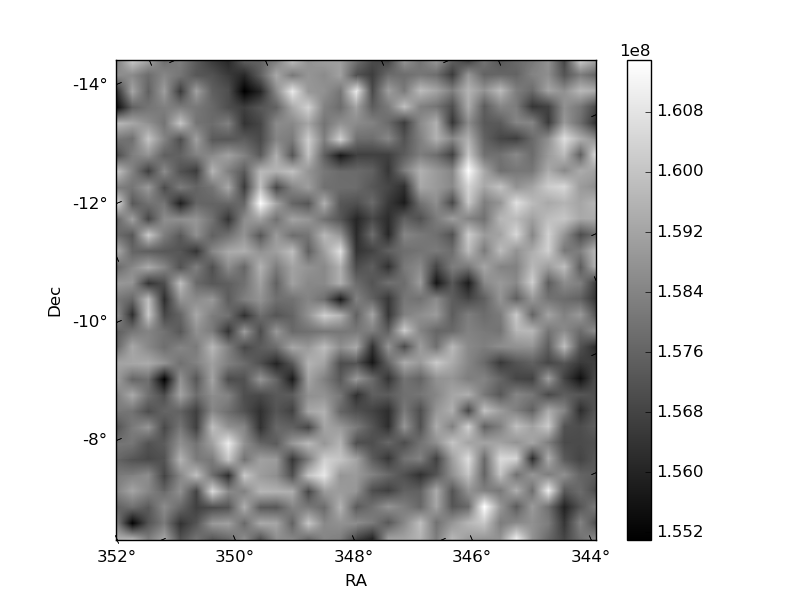
Histogram calculated using DETX and DETY for each event in the final _common_clean file
| Quadrant A | 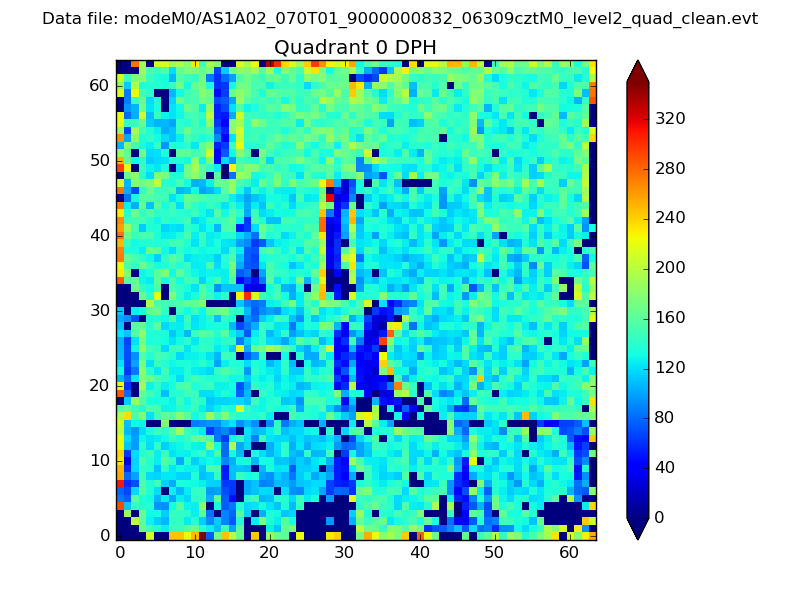 |
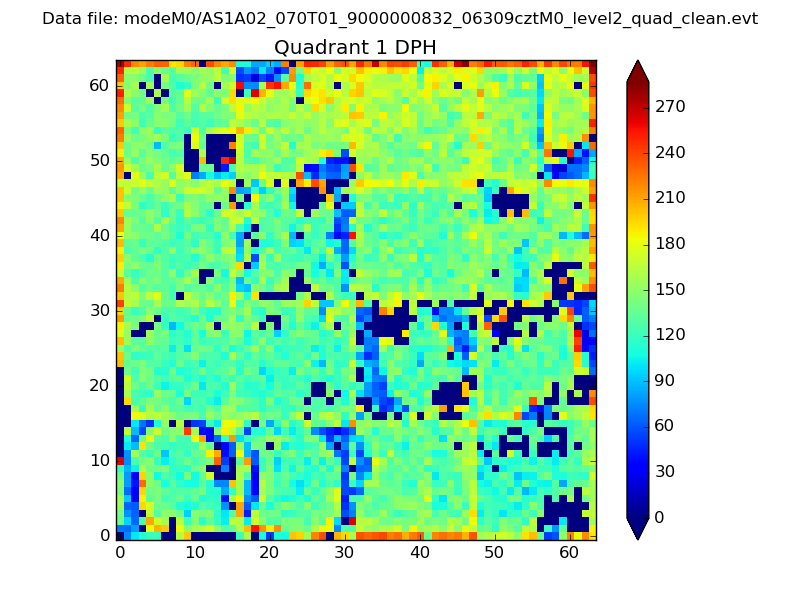 |
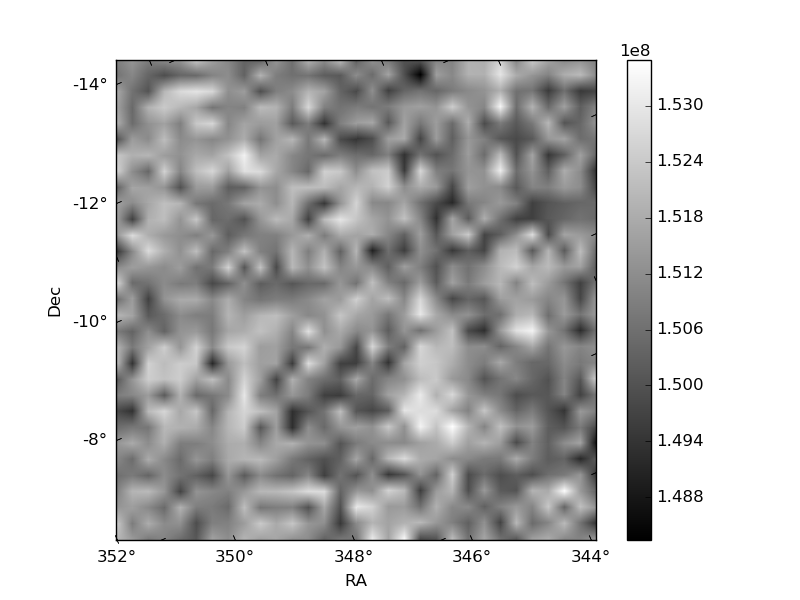
Quadrant B |
|---|---|---|---|
| Quadrant D | 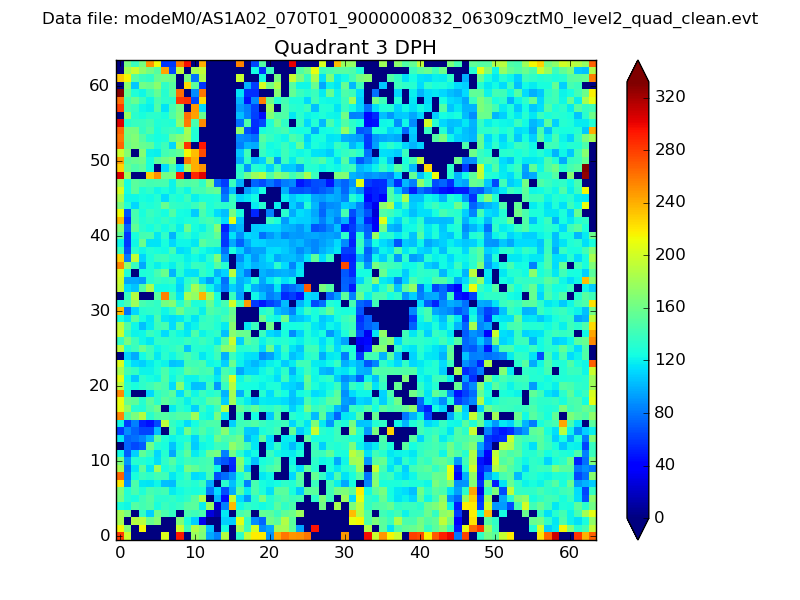 |
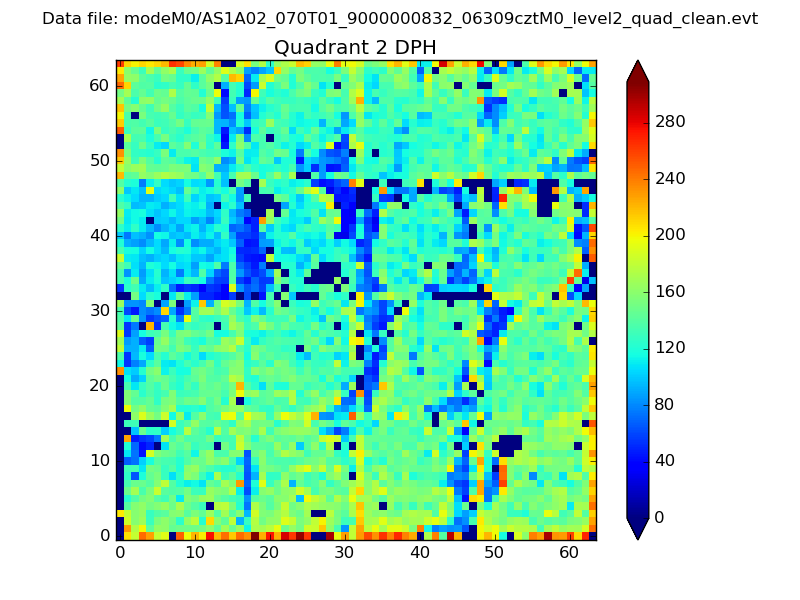 |
Quadrant C |
| Plot type | Count rate plots | Images |
|---|---|---|
| Comparison with Poisson distribution Blue bars denote a histogram of data divided into 1 sec bins. Red curve is a Poisson curve with rate = median count rate of data. |
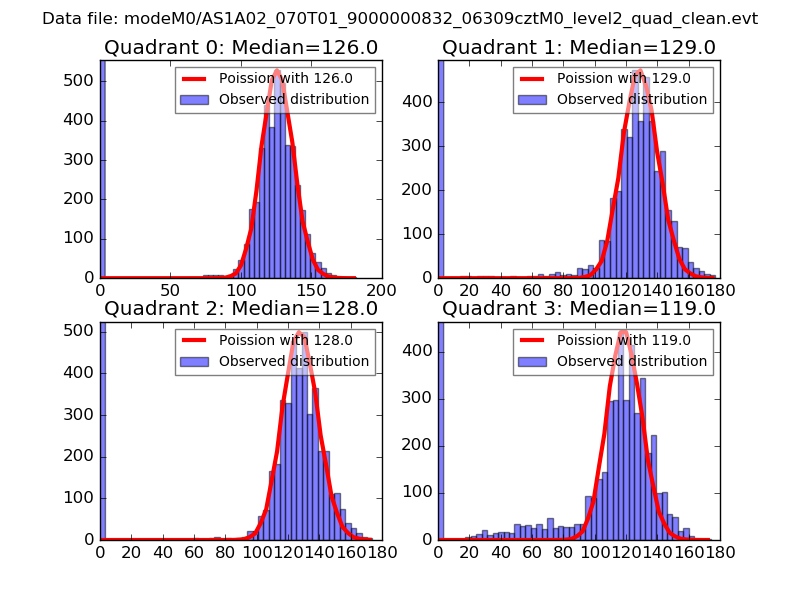 |
 |
| Quadrant-wise count rates Data is divided into 100 sec bins |
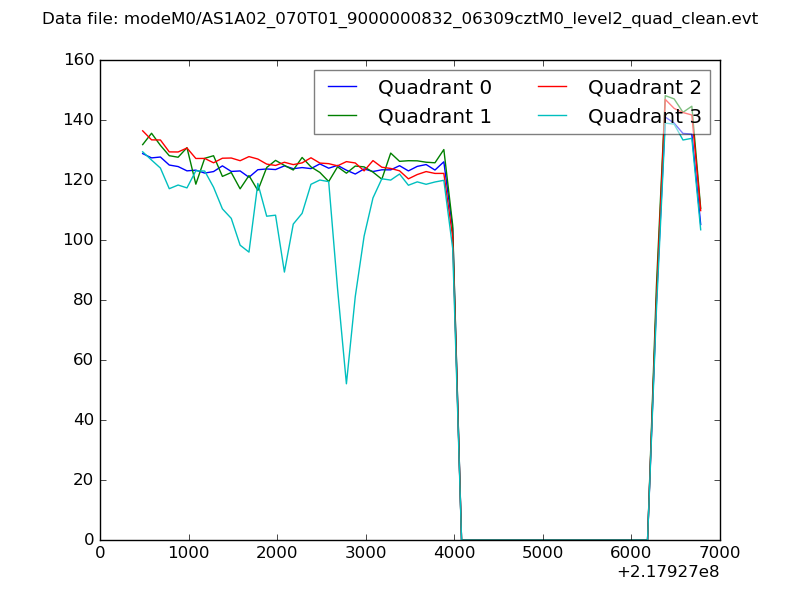 |
|
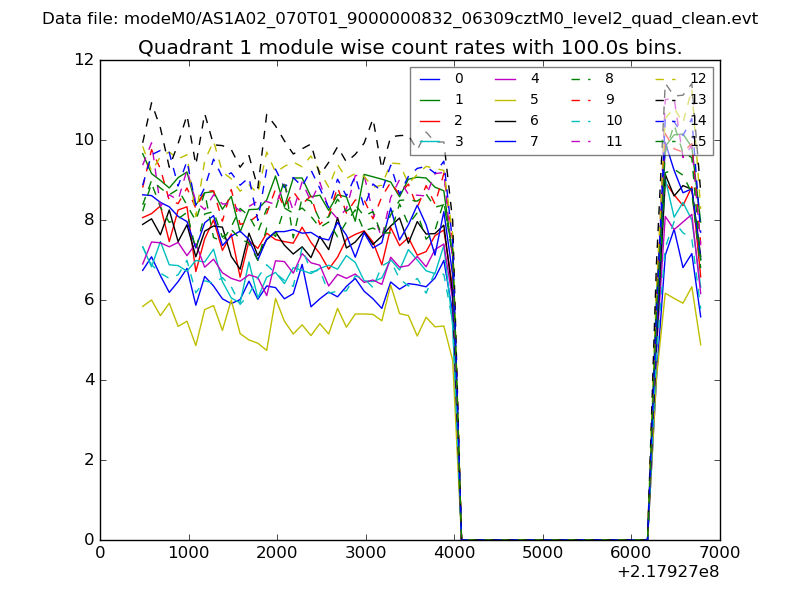
| Module-wise count rates for Quadrant A Data is divided into 100 sec bins |
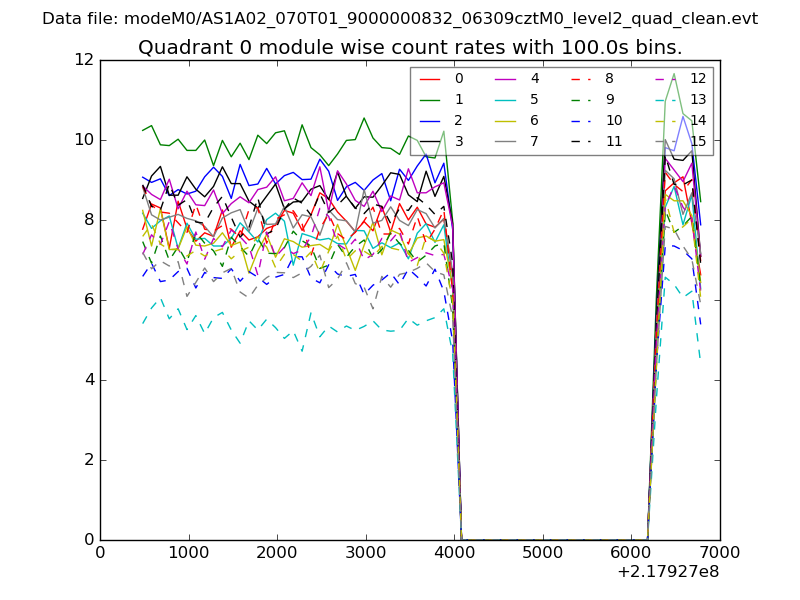 |
 |
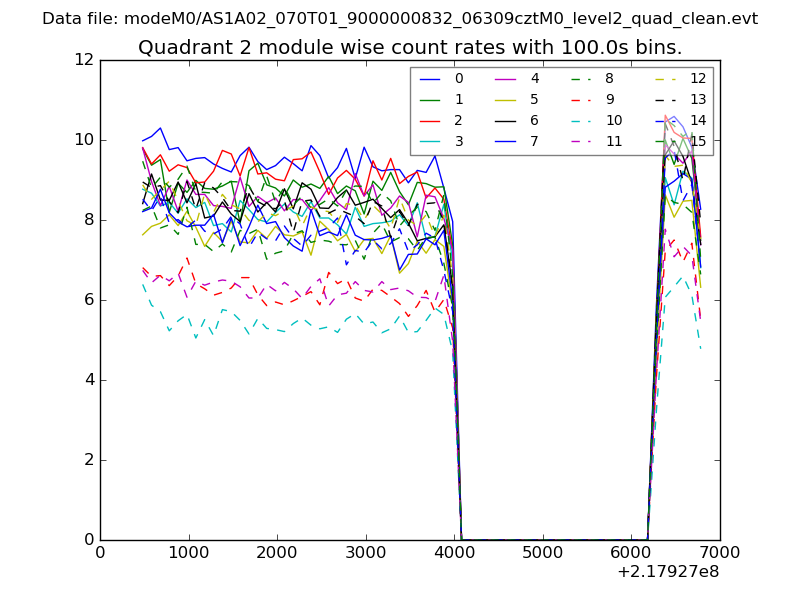
| Module-wise count rates for Quadrant B Data is divided into 100 sec bins |
 |
 |
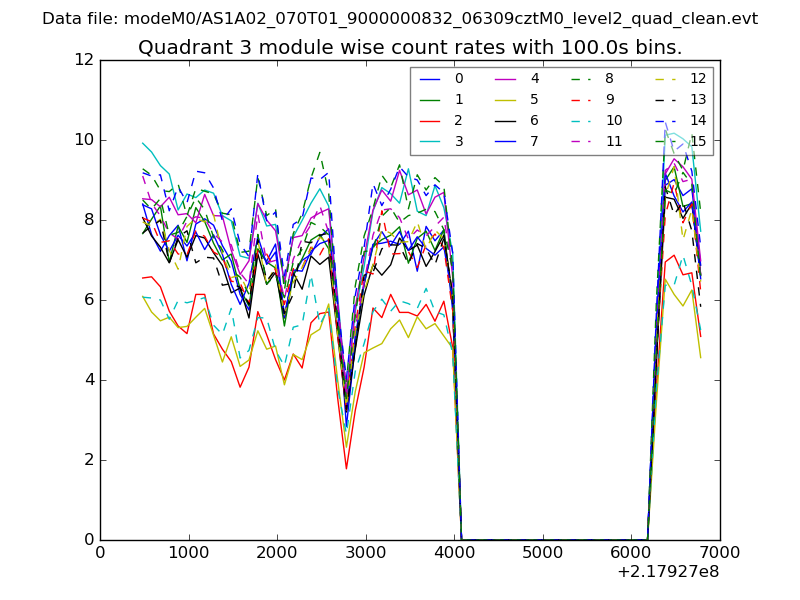
| Module-wise count rates for Quadrant C Data is divided into 100 sec bins |
 |
 |
| Module-wise count rates for Quadrant D Data is divided into 100 sec bins |
 |
 |
| Parameter | Plot |
|---|---|
| CZT HV Monitor | 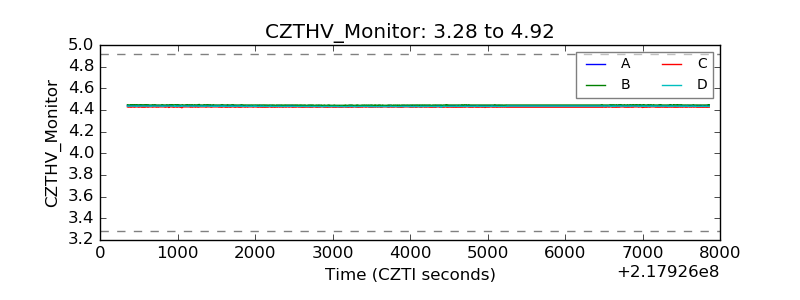 |
| D_VDD | 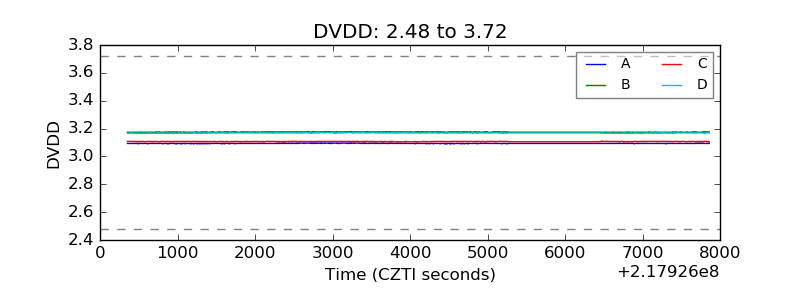 |
| Temperature 1 | 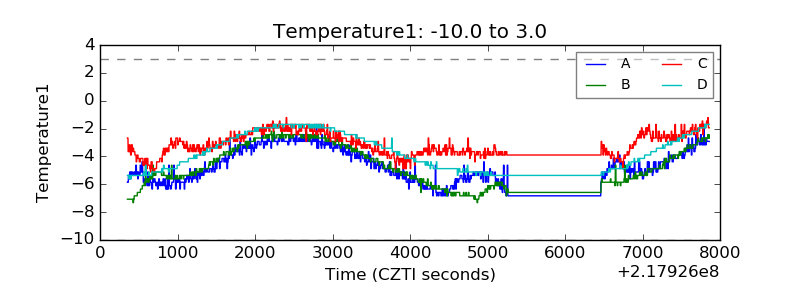 |
| Veto HV Monitor | 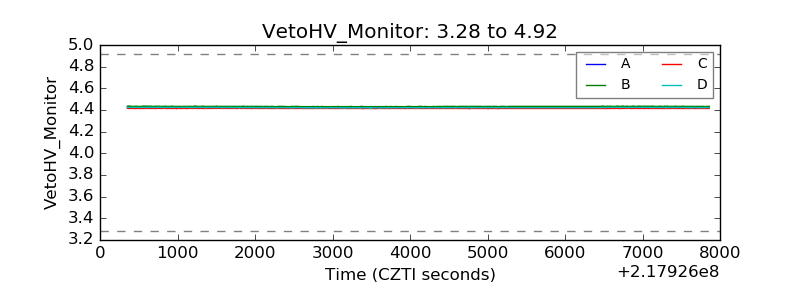 |
| Veto LLD | 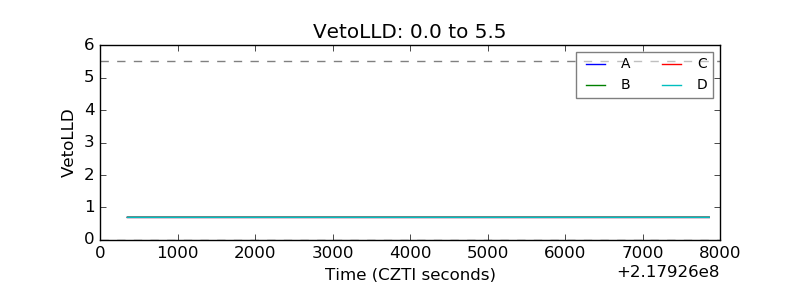 |
| Alpha Counter | 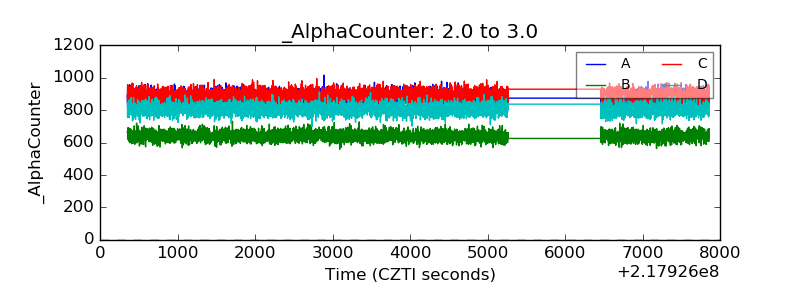 |
| _CPM_Rate | 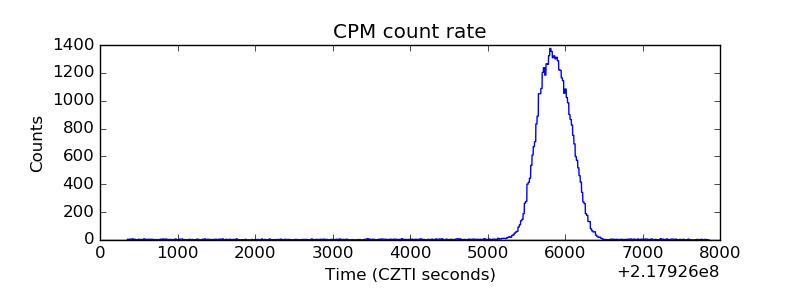 |
| CZT Counter | 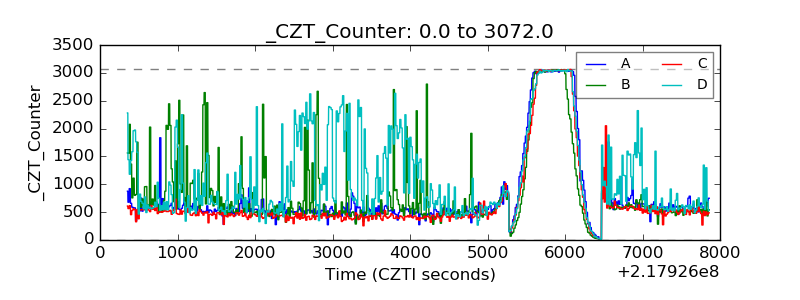 |
| +2.5 Volts monitor |  |
| +5 Volts monitor |  |
| _ROLL_ROT | 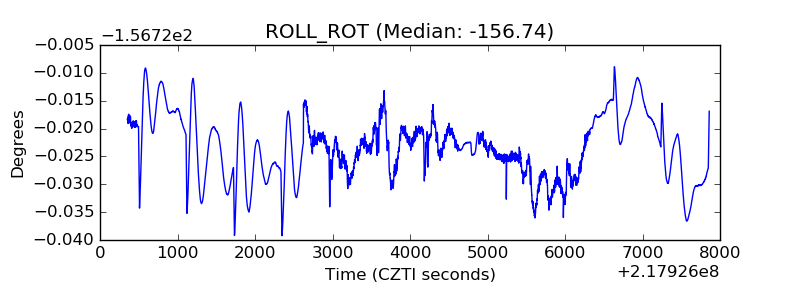 |
| _Roll_DEC | 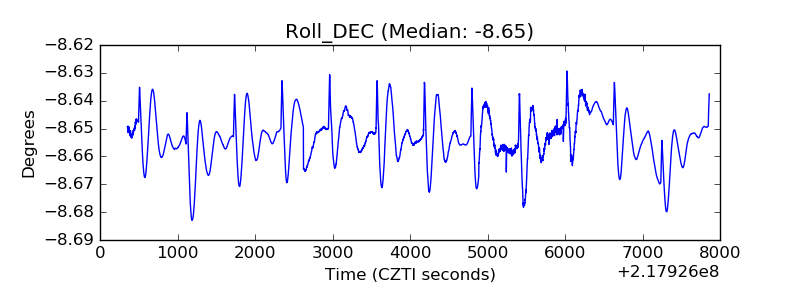 |
| _Roll_RA | 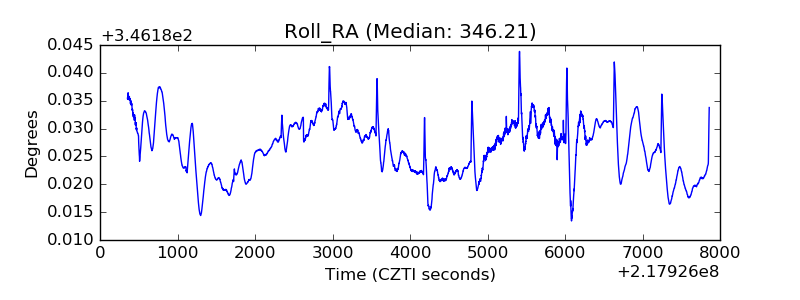 |
| Veto Counter | 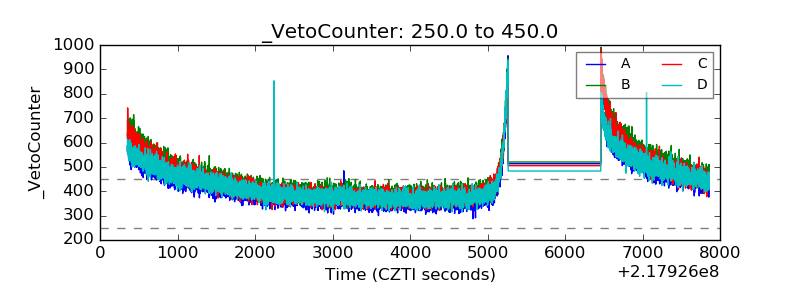 |