| Param | Original file | Final file |
|---|---|---|
| Filename | modeM0/AS1A02_070T01_9000000832_06310cztM0_level2.evt | modeM0/AS1A02_070T01_9000000832_06310cztM0_level2_quad_clean.evt |
| Size (bytes) | 1,603,114,560 | 254,528,640 |
| Size | 1.5 GB | 242.7 MB |
| Events in quadrant A | 10,473,609 | 1,631,607 |
| Events in quadrant B | 11,596,729 | 1,654,959 |
| Events in quadrant C | 8,548,143 | 1,661,562 |
| Events in quadrant D | 16,712,031 | 1,512,701 |
| Mode M9 | |||
|---|---|---|---|
| Quadrant | BADHDUFLAG | Total packets | Discarded packets |
| A | 0 | 47 | 0 |
| B | 0 | 47 | 0 |
| C | 0 | 47 | 0 |
| D | 0 | 47 | 0 |
| Mode SS | |||
|---|---|---|---|
| Quadrant | BADHDUFLAG | Total packets | Discarded packets |
| A | 0 | 368 | 0 |
| B | 0 | 368 | 0 |
| C | 0 | 368 | 0 |
| D | 0 | 368 | 0 |
| Mode M0 | |||
|---|---|---|---|
| Quadrant | BADHDUFLAG | Total packets | Discarded packets |
| A | 0 | 42331 | 5 |
| B | 0 | 46258 | 4 |
| C | 0 | 37729 | 4 |
| D | 0 | 62077 | 4 |
| Quadrant | Total seconds | Saturated seconds | Saturation percentage |
|---|---|---|---|
| A | 18110 | 310 | 1.711761% |
| B | 18110 | 1000 | 5.521811% |
| C | 18110 | 212 | 1.170624% |
| D | 18110 | 1956 | 10.800663% |
Noise dominated data is calculated using 1-second bins in cleaned event files. If a bin has >2000 counts, and if more than 50% of those come from <1% of pixels, then it is considered to be noise-dominated and hence unusable.
| Quadrant | # 1 sec bins | Bins with >0 counts | Bins with >2000 counts | High rate bins dominated by noise | Noise dominated (total time) | Noise dominated (detector-on time) | Marked lightcurve |
|---|---|---|---|---|---|---|---|
| A | 22710 | 18110 | 9 | 9 | 0.04% | 0.05% | 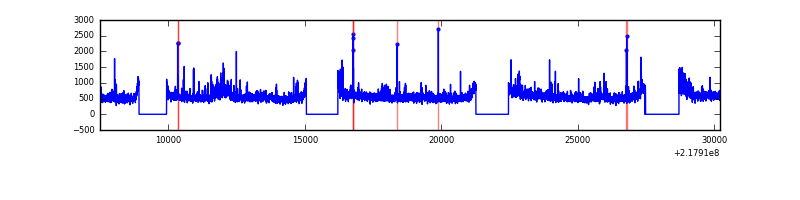 |
| B | 22710 | 18110 | 521 | 521 | 2.29% | 2.88% | 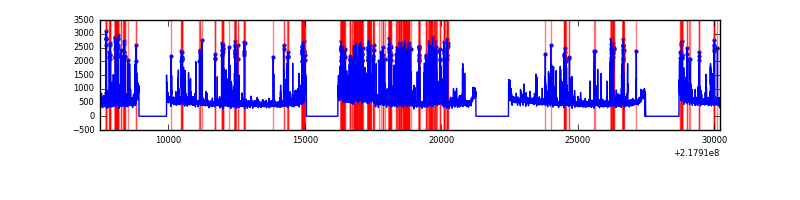 |
| C | 22710 | 18110 | 2 | 2 | 0.01% | 0.01% | 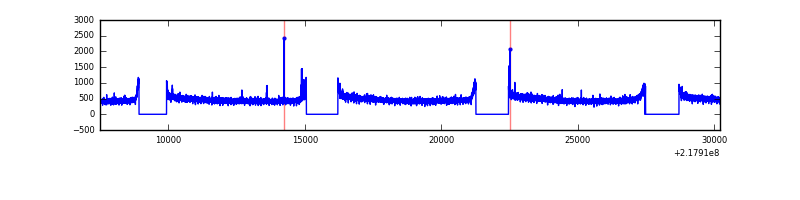 |
| D | 22710 | 18110 | 1476 | 1476 | 6.50% | 8.15% | 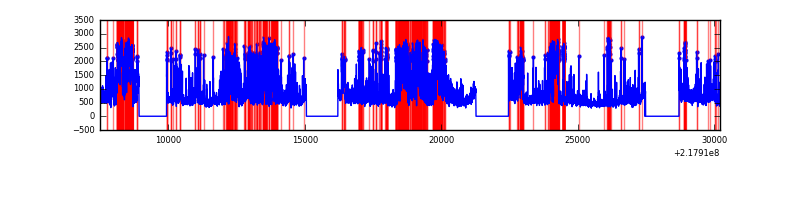 |
Top three noisy pixels from each quadrant. If the there are fewer than three noisy pixels in the level2.evt file, extra rows are filled as -1
| Pixel properties | Quadrant properties | ||||||
|---|---|---|---|---|---|---|---|
| Quadrant | DetID | PixID | Counts | Sigma | Mean | Median | Sigma |
| A | 8 | 15 | 1472523 | 3270.3 | 2237 | 2190 | 449.6 |
| A | 13 | 251 | 199072 | 437.9 | 2237 | 2190 | 449.6 |
| A | 14 | 111 | 157780 | 346.06 | 2237 | 2190 | 449.6 |
| B | 3 | 64 | 2630105 | 6226.81 | 2233 | 2183 | 422.0 |
| B | 4 | 81 | 104317 | 242.0 | 2233 | 2183 | 422.0 |
| B | 10 | 213 | 97278 | 225.33 | 2233 | 2183 | 422.0 |
| C | 1 | 16 | 54139 | 104.85 | 2165 | 2184 | 495.5 |
| C | 9 | 16 | 32263 | 60.7 | 2165 | 2184 | 495.5 |
| C | 13 | 61 | 17007 | 29.91 | 2165 | 2184 | 495.5 |
| D | 2 | 63 | 5573620 | 10831.58 | 2119 | 2056 | 514.4 |
| D | 12 | 220 | 1852128 | 3596.69 | 2119 | 2056 | 514.4 |
| D | 12 | 110 | 495529 | 959.35 | 2119 | 2056 | 514.4 |
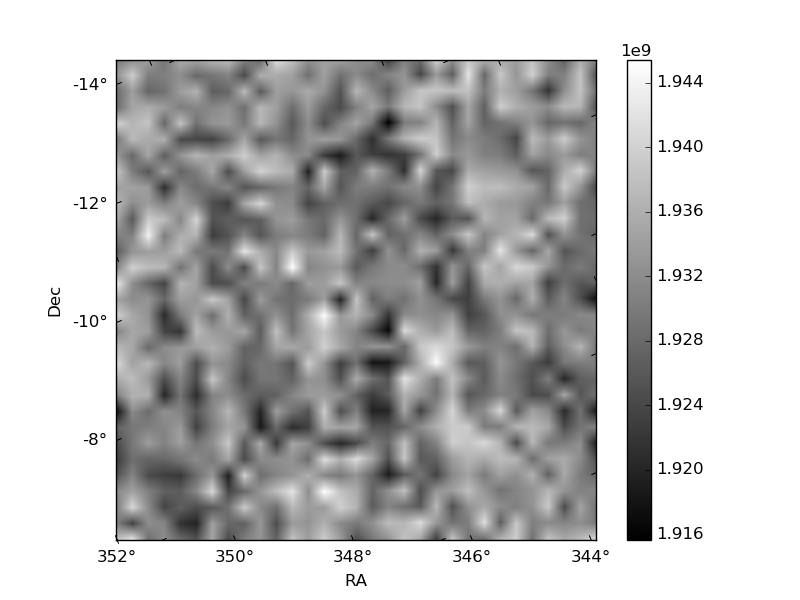
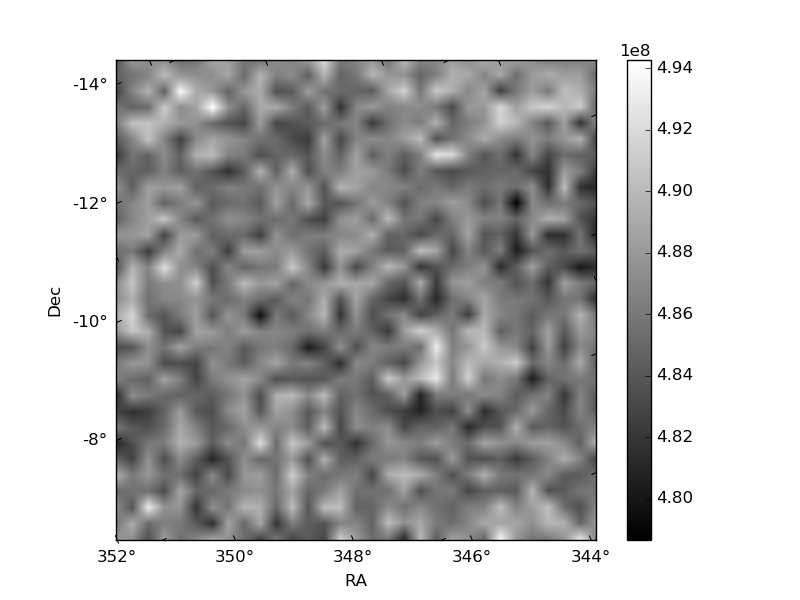
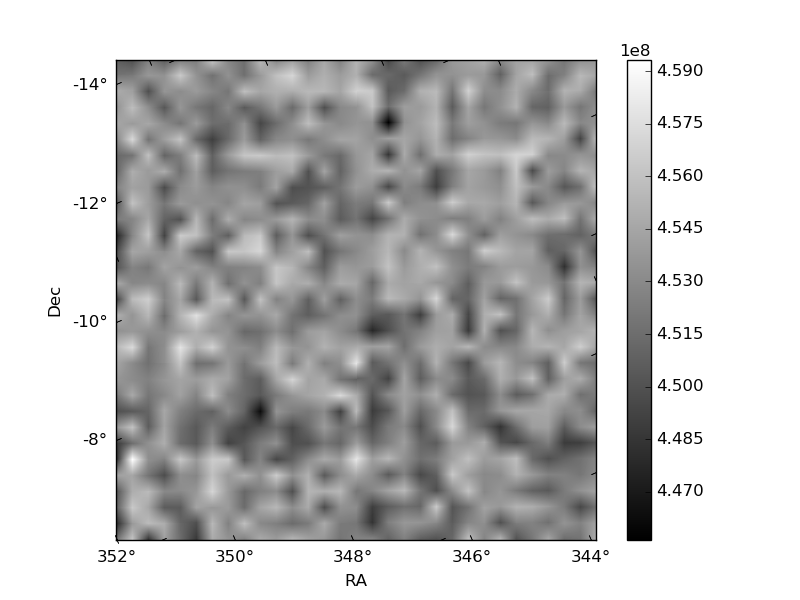
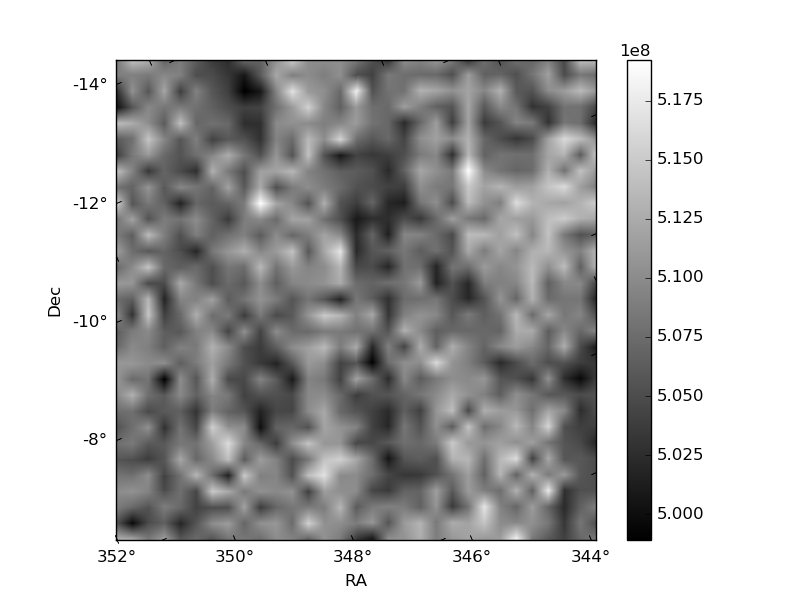
Histogram calculated using DETX and DETY for each event in the final _common_clean file
| Quadrant A | 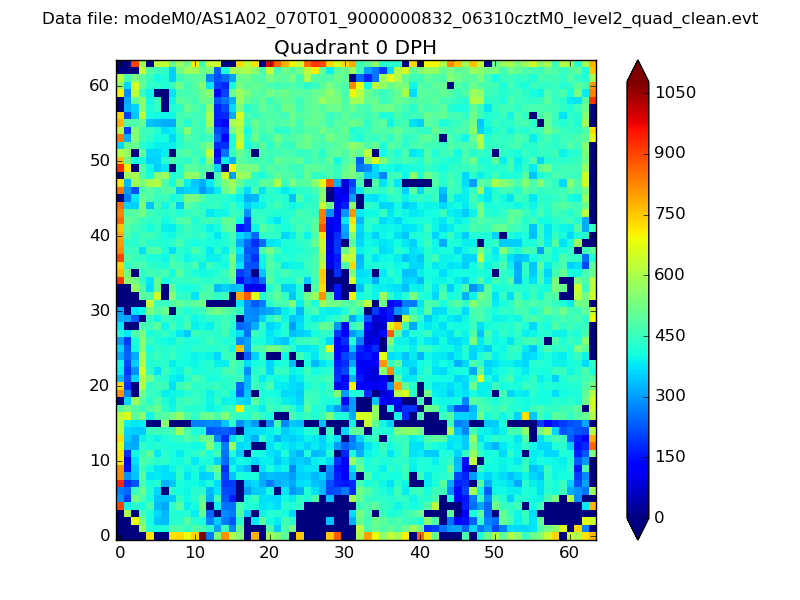 |
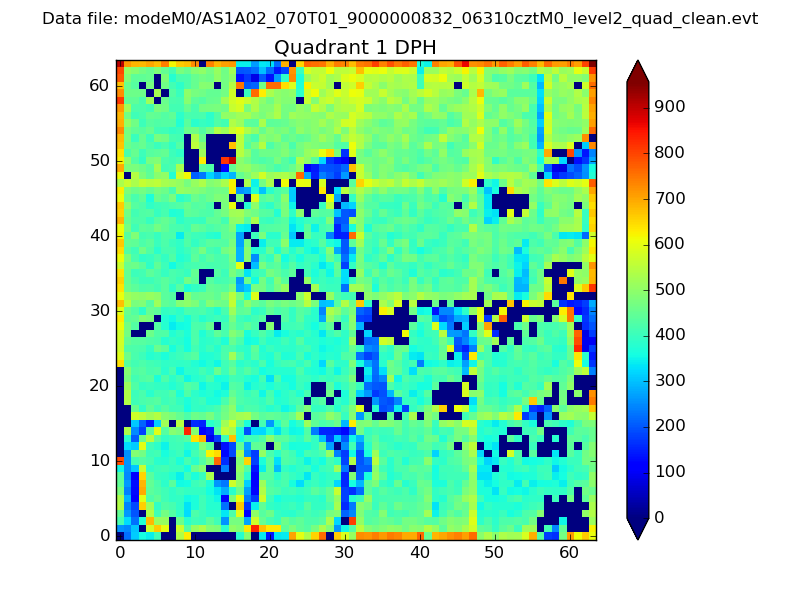 |
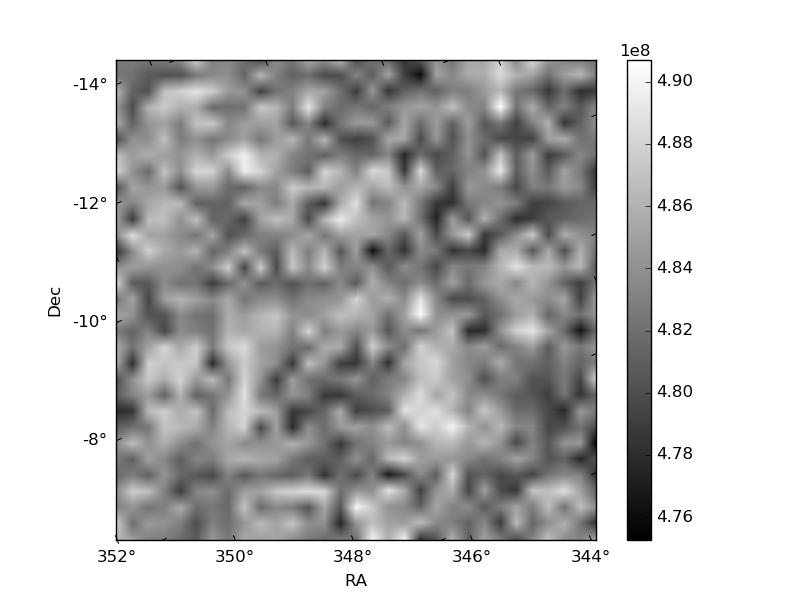
Quadrant B |
|---|---|---|---|
| Quadrant D | 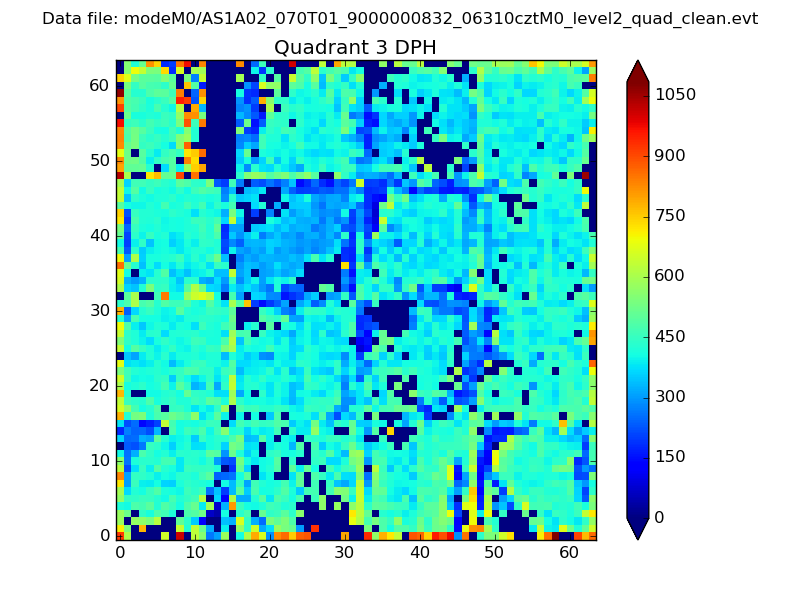 |
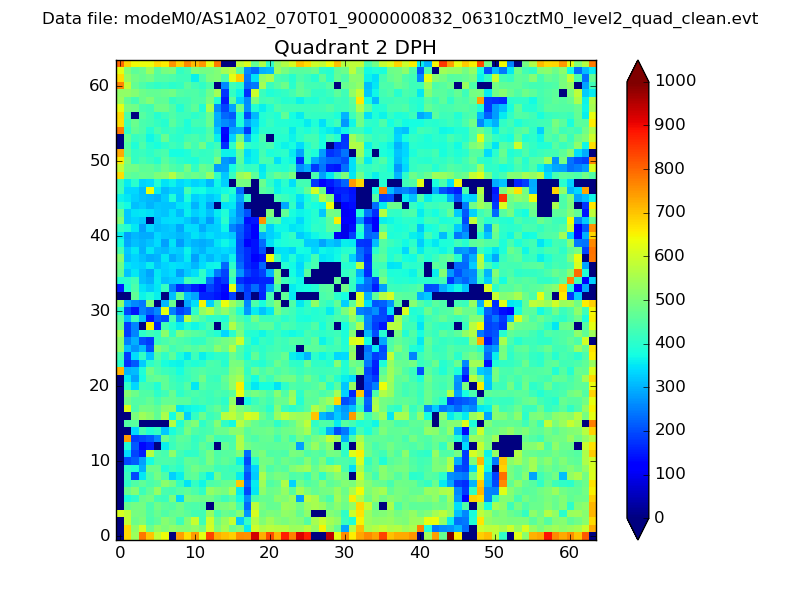 |
Quadrant C |
| Plot type | Count rate plots | Images |
|---|---|---|
| Comparison with Poisson distribution Blue bars denote a histogram of data divided into 1 sec bins. Red curve is a Poisson curve with rate = median count rate of data. |
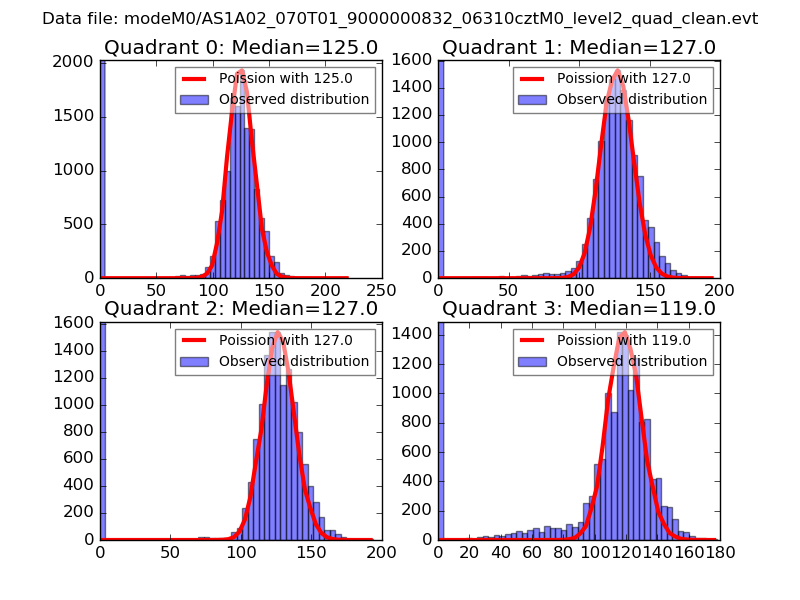 |
 |
| Quadrant-wise count rates Data is divided into 100 sec bins |
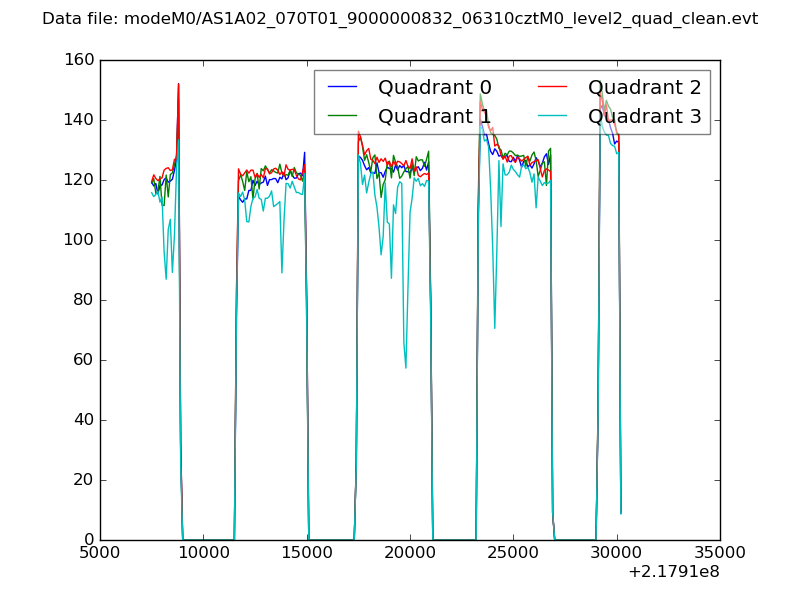 |
|
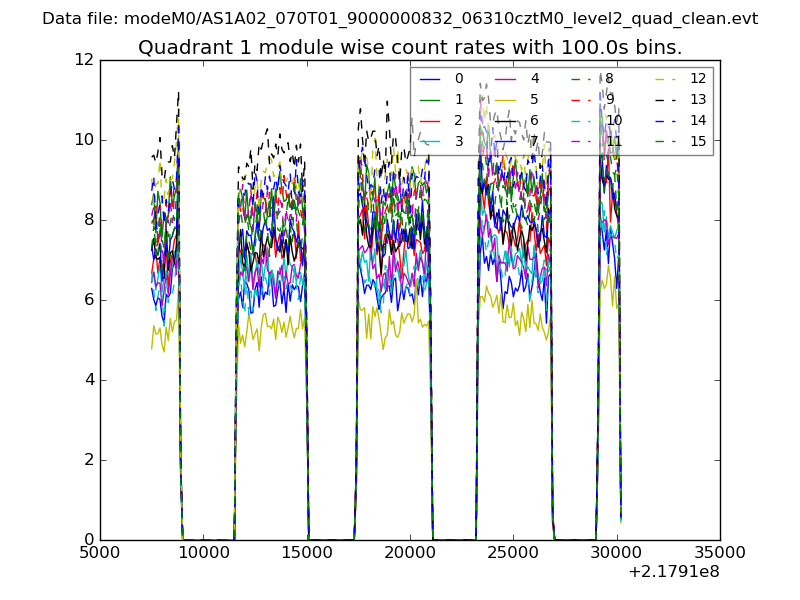
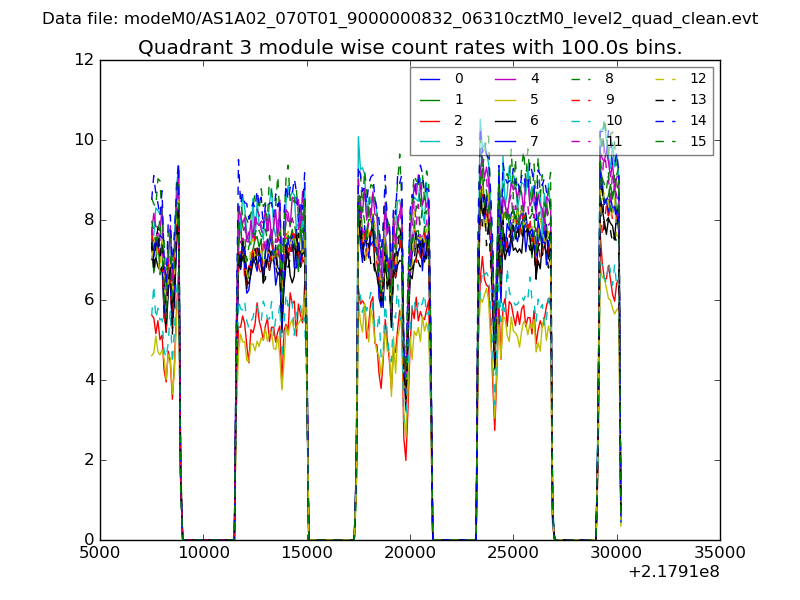
| Module-wise count rates for Quadrant A Data is divided into 100 sec bins |
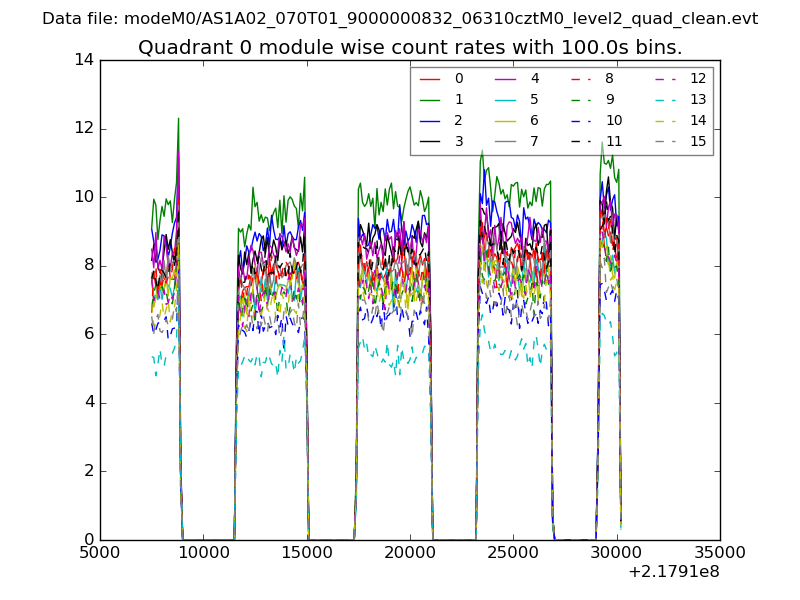 |
 |
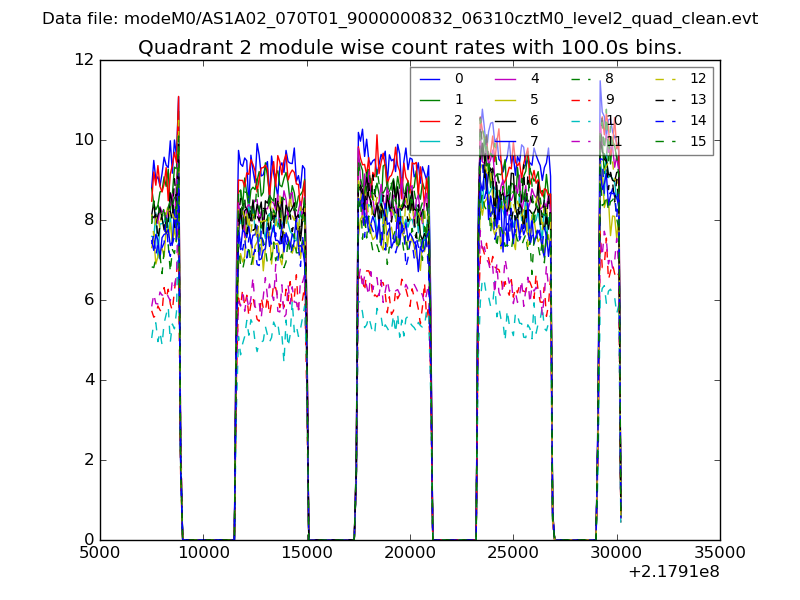
| Module-wise count rates for Quadrant B Data is divided into 100 sec bins |
 |
 |
| Module-wise count rates for Quadrant C Data is divided into 100 sec bins |
 |
 |
| Module-wise count rates for Quadrant D Data is divided into 100 sec bins |
 |
 |
| Parameter | Plot |
|---|---|
| CZT HV Monitor | 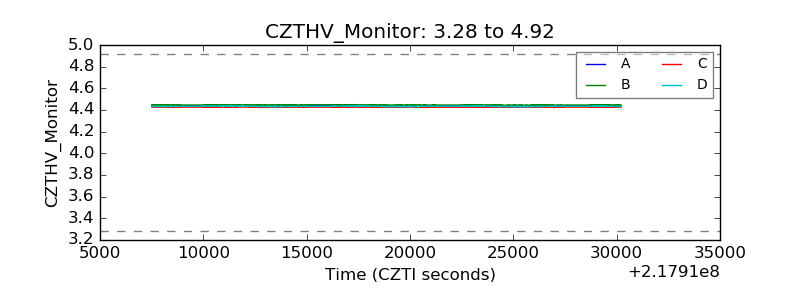 |
| D_VDD | 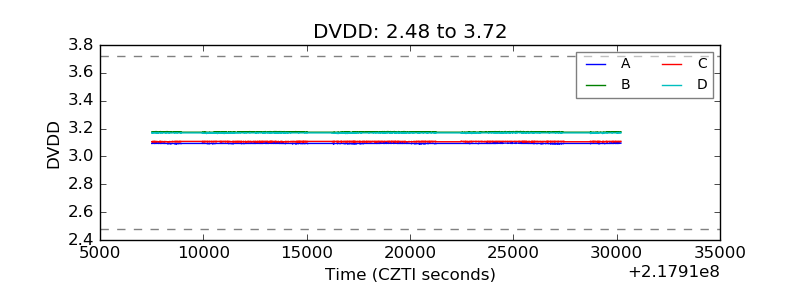 |
| Temperature 1 | 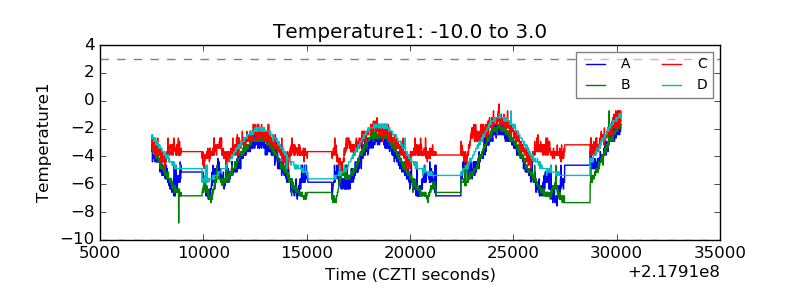 |
| Veto HV Monitor | 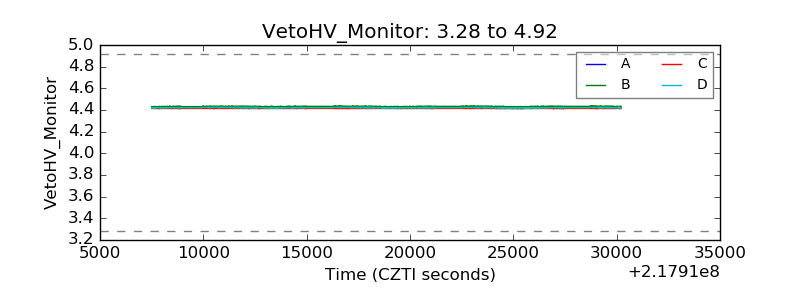 |
| Veto LLD | 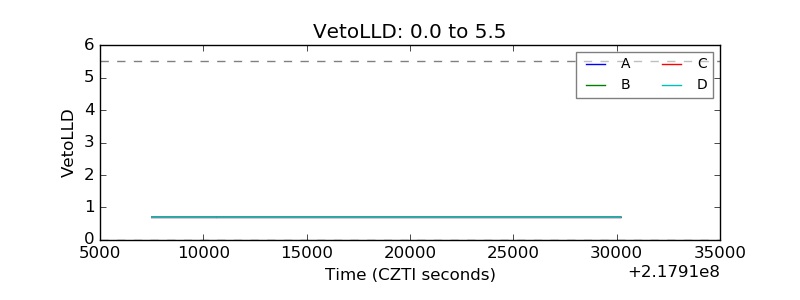 |
| Alpha Counter | 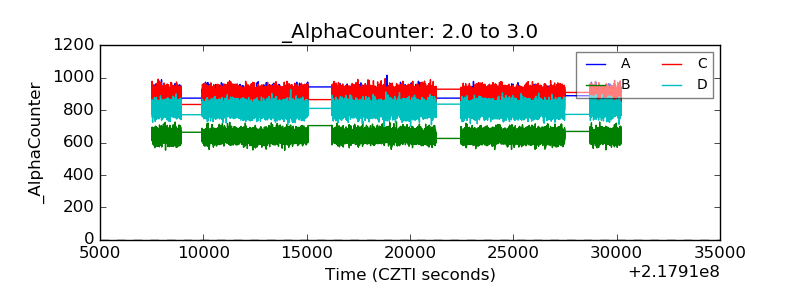 |
| _CPM_Rate | 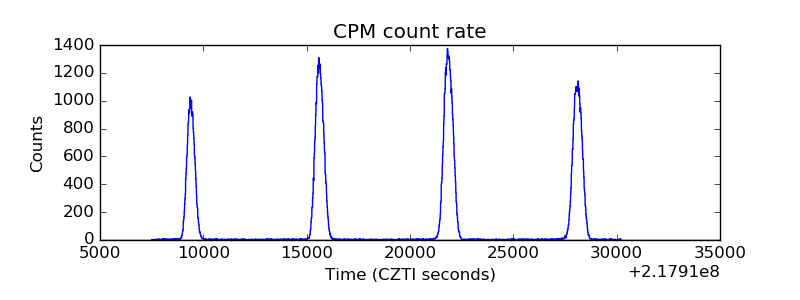 |
| CZT Counter | 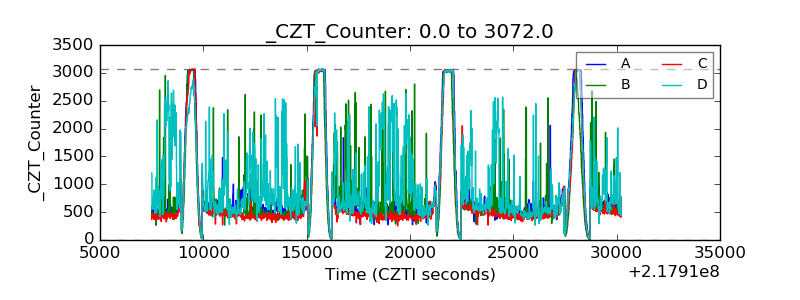 |
| +2.5 Volts monitor | 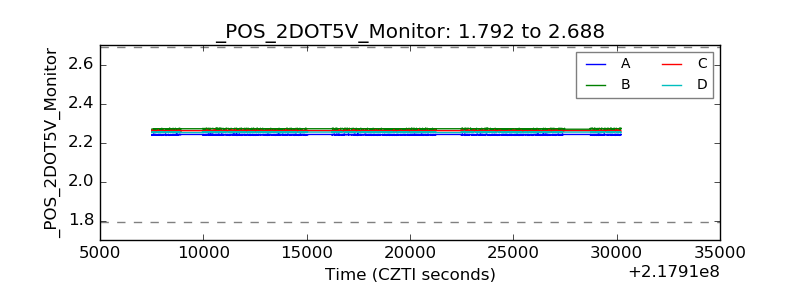 |
| +5 Volts monitor | 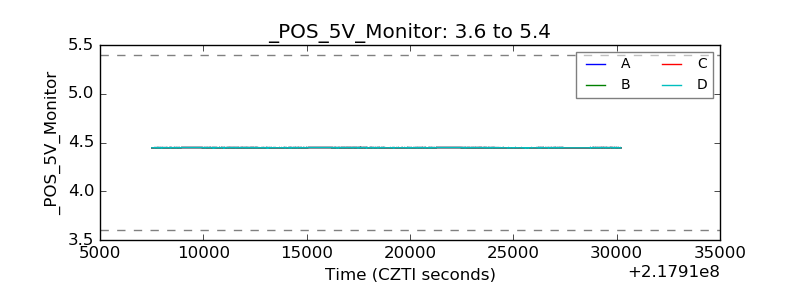 |
| _ROLL_ROT | 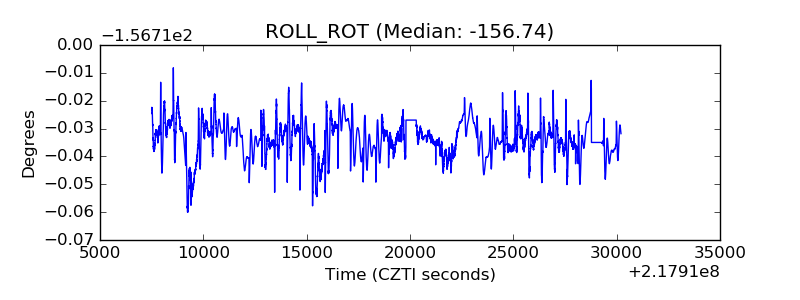 |
| _Roll_DEC | 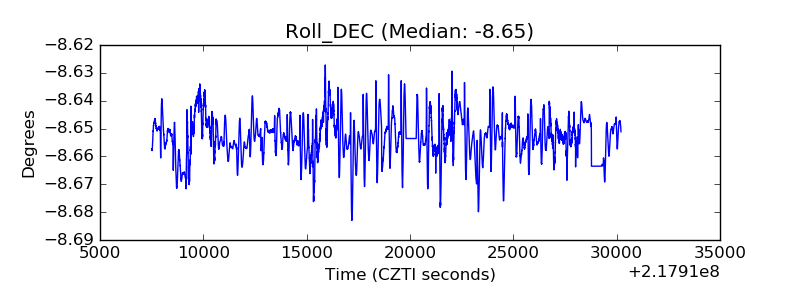 |
| _Roll_RA | 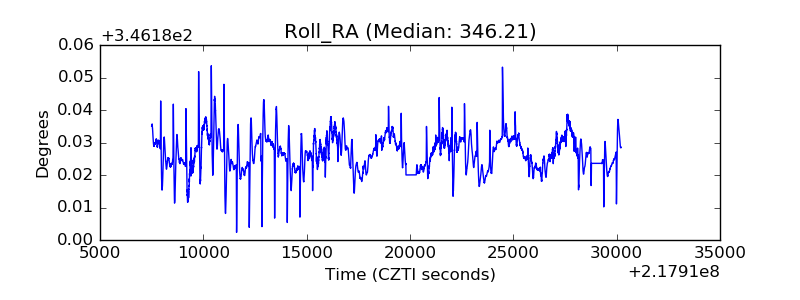 |
| Veto Counter | 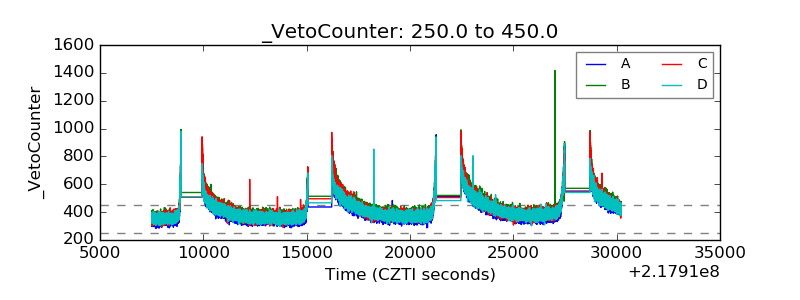 |