| Param | Original file | Final file |
|---|---|---|
| Filename | modeM0/AS1A02_070T01_9000000832_06313cztM0_level2.evt | modeM0/AS1A02_070T01_9000000832_06313cztM0_level2_quad_clean.evt |
| Size (bytes) | 489,692,160 | 89,023,680 |
| Size | 467.0 MB | 84.9 MB |
| Events in quadrant A | 3,545,449 | 556,318 |
| Events in quadrant B | 4,006,204 | 565,654 |
| Events in quadrant C | 3,083,803 | 562,931 |
| Events in quadrant D | 3,736,367 | 540,373 |
| Mode M9 | |||
|---|---|---|---|
| Quadrant | BADHDUFLAG | Total packets | Discarded packets |
| A | 0 | 9 | 0 |
| B | 0 | 9 | 0 |
| C | 0 | 9 | 0 |
| D | 0 | 10 | 0 |
| Mode SS | |||
|---|---|---|---|
| Quadrant | BADHDUFLAG | Total packets | Discarded packets |
| A | 0 | 136 | 0 |
| B | 0 | 136 | 0 |
| C | 0 | 136 | 0 |
| D | 0 | 136 | 0 |
| Mode M0 | |||
|---|---|---|---|
| Quadrant | BADHDUFLAG | Total packets | Discarded packets |
| A | 0 | 15174 | 3 |
| B | 0 | 16345 | 2 |
| C | 0 | 14058 | 2 |
| D | 0 | 15792 | 2 |
| Quadrant | Total seconds | Saturated seconds | Saturation percentage |
|---|---|---|---|
| A | 6755 | 149 | 2.205774% |
| B | 6755 | 240 | 3.552924% |
| C | 6755 | 20 | 0.296077% |
| D | 6755 | 80 | 1.184308% |
Noise dominated data is calculated using 1-second bins in cleaned event files. If a bin has >2000 counts, and if more than 50% of those come from <1% of pixels, then it is considered to be noise-dominated and hence unusable.
| Quadrant | # 1 sec bins | Bins with >0 counts | Bins with >2000 counts | High rate bins dominated by noise | Noise dominated (total time) | Noise dominated (detector-on time) | Marked lightcurve |
|---|---|---|---|---|---|---|---|
| A | 7545 | 6755 | 50 | 50 | 0.66% | 0.74% | 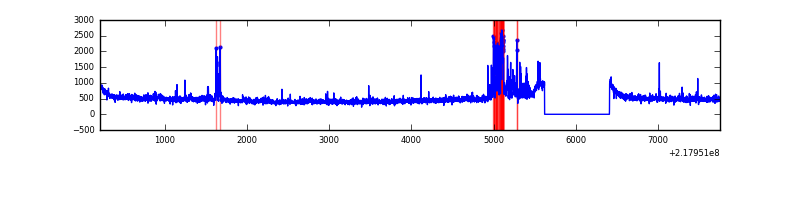 |
| B | 7545 | 6755 | 113 | 113 | 1.50% | 1.67% | 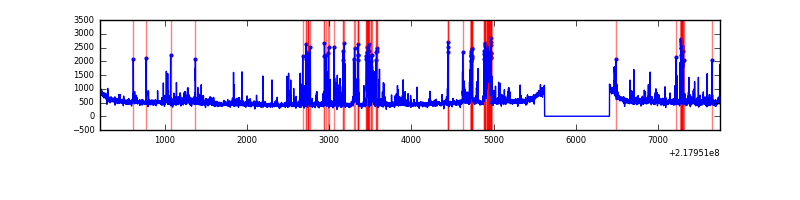 |
| C | 7544 | 6755 | 2 | 2 | 0.03% | 0.03% |  |
| D | 7544 | 6754 | 27 | 27 | 0.36% | 0.40% | 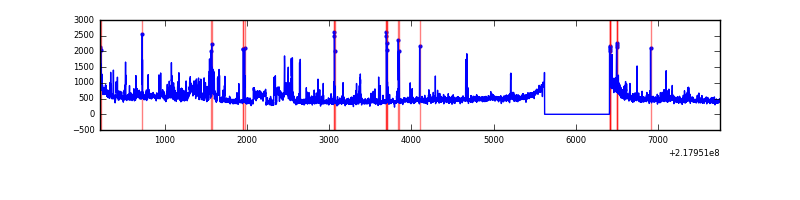 |
Top three noisy pixels from each quadrant. If the there are fewer than three noisy pixels in the level2.evt file, extra rows are filled as -1
| Pixel properties | Quadrant properties | ||||||
|---|---|---|---|---|---|---|---|
| Quadrant | DetID | PixID | Counts | Sigma | Mean | Median | Sigma |
| A | 15 | 174 | 273103 | 1625.01 | 808 | 788 | 167.6 |
| A | 8 | 15 | 107530 | 636.97 | 808 | 788 | 167.6 |
| A | 13 | 251 | 51045 | 299.9 | 808 | 788 | 167.6 |
| B | 3 | 64 | 705467 | 4476.82 | 808 | 789 | 157.4 |
| B | 15 | 204 | 153024 | 967.15 | 808 | 789 | 157.4 |
| B | 12 | 111 | 15032 | 90.49 | 808 | 789 | 157.4 |
| C | 1 | 16 | 27657 | 147.92 | 779 | 783 | 181.7 |
| C | 9 | 54 | 16031 | 83.93 | 779 | 783 | 181.7 |
| C | 13 | 61 | 6046 | 28.97 | 779 | 783 | 181.7 |
| D | 2 | 63 | 317088 | 1666.41 | 778 | 754 | 189.8 |
| D | 12 | 220 | 120958 | 633.22 | 778 | 754 | 189.8 |
| D | 13 | 169 | 114967 | 601.66 | 778 | 754 | 189.8 |
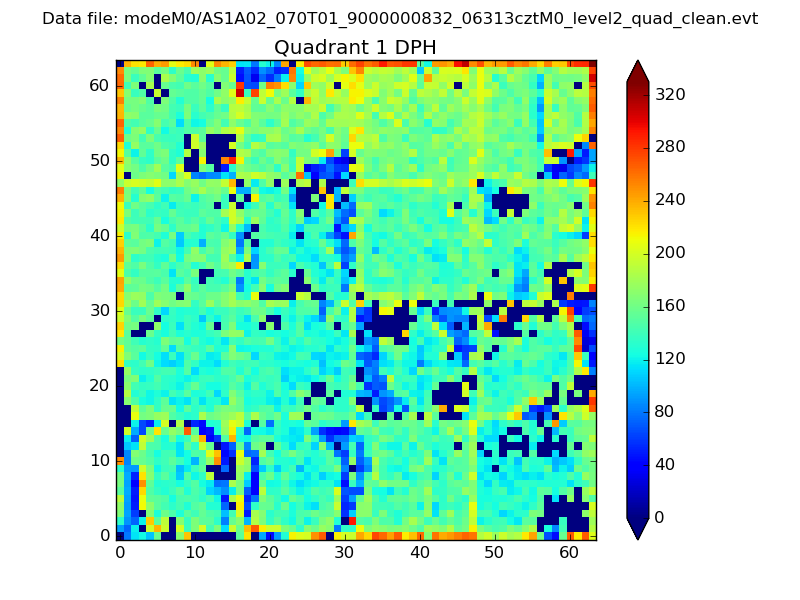
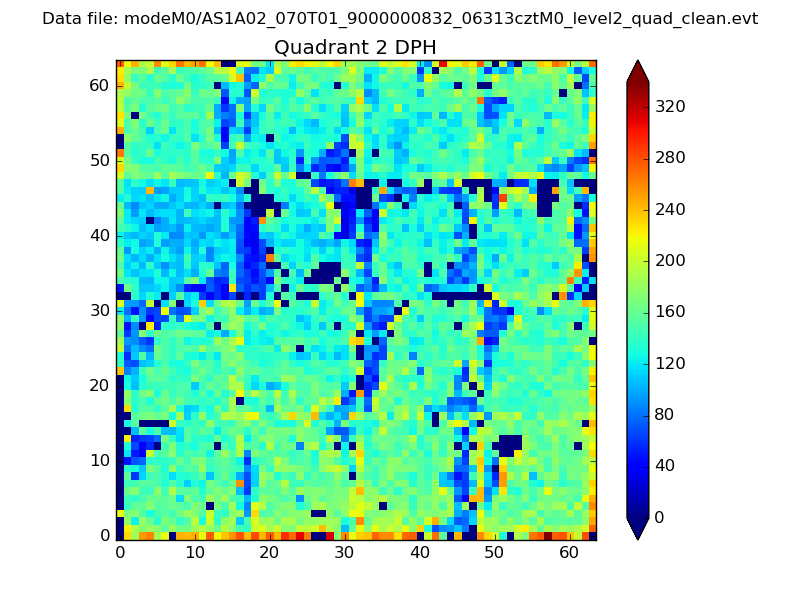
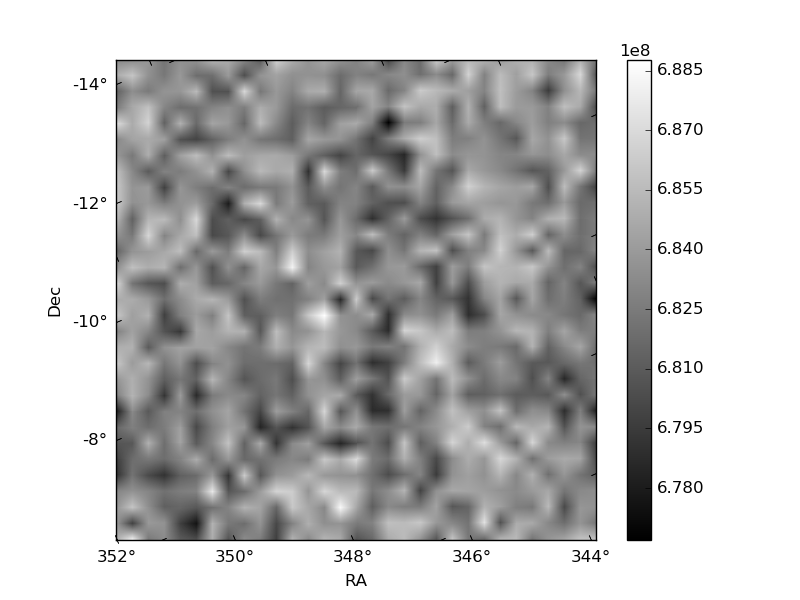
Histogram calculated using DETX and DETY for each event in the final _common_clean file
| Quadrant A | 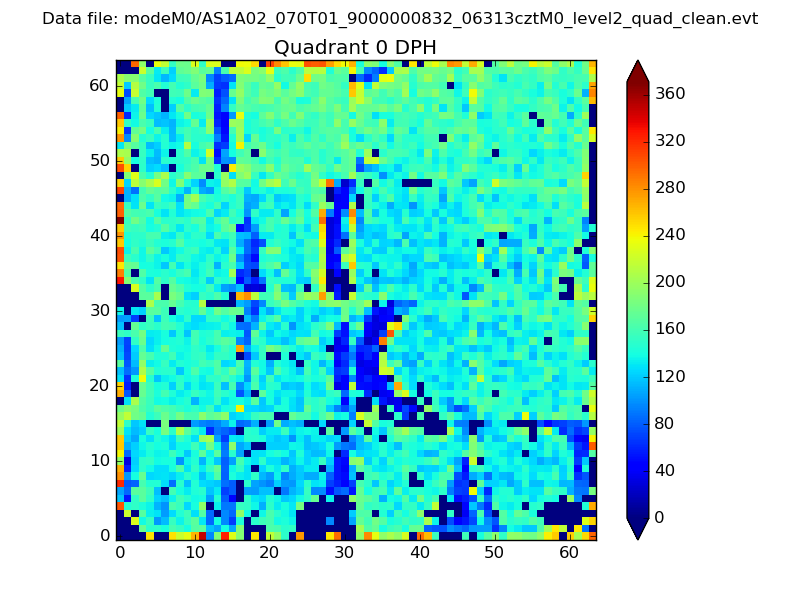 |
 |
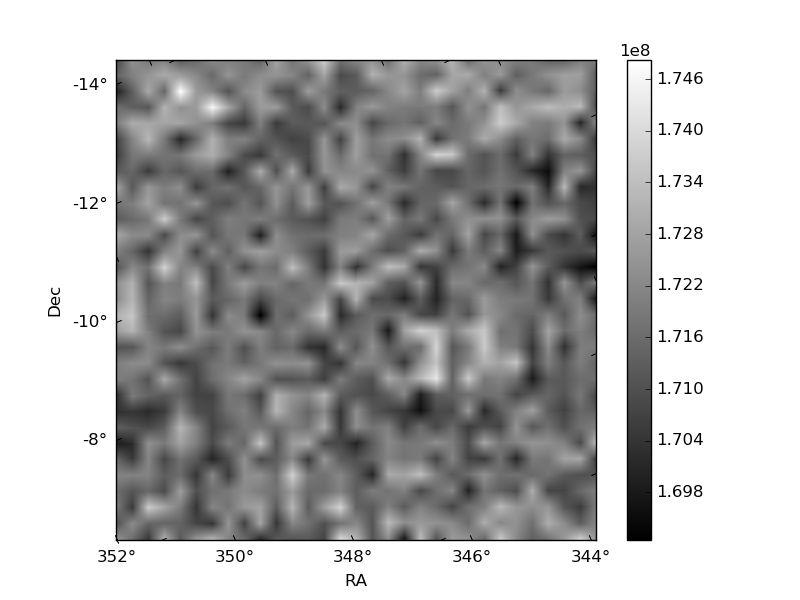
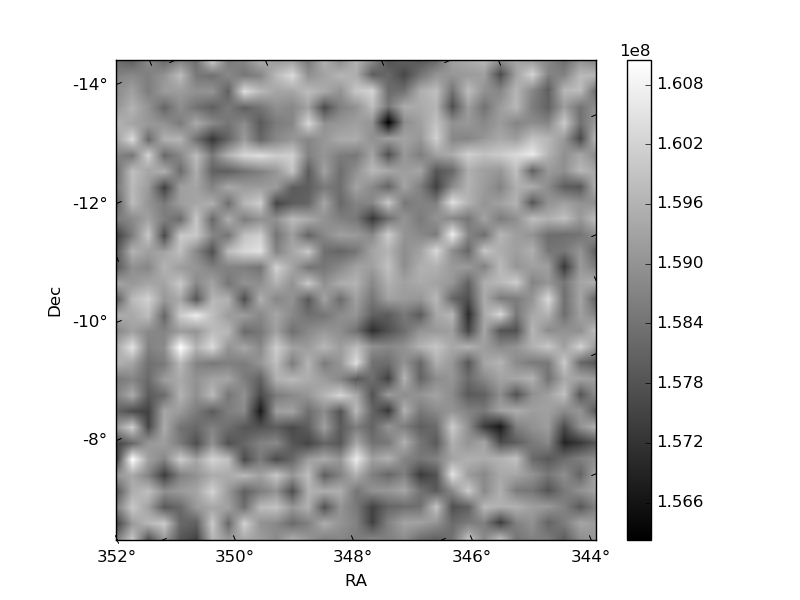
Quadrant B |
|---|---|---|---|
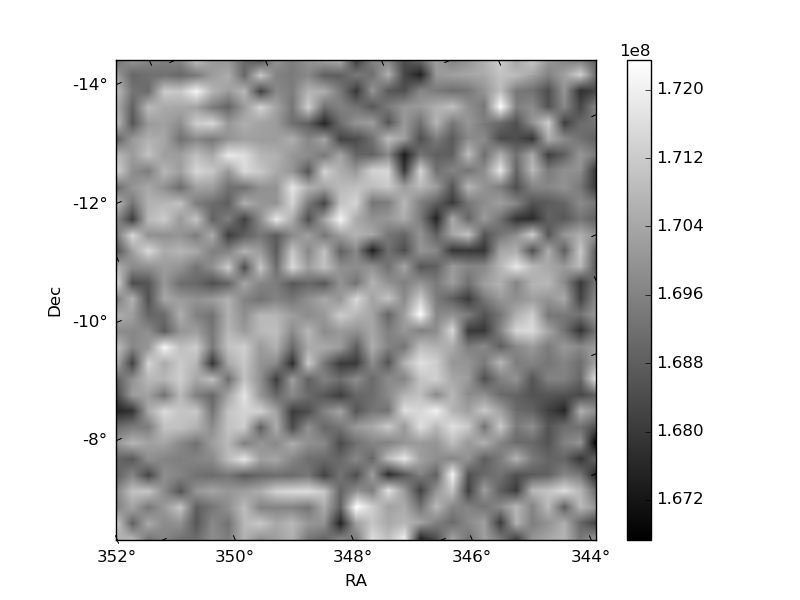
| Quadrant D | 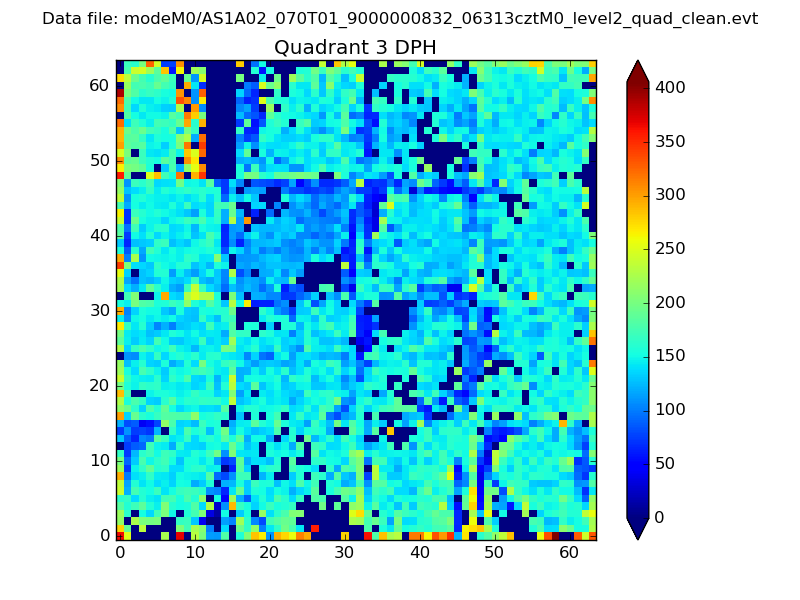 |
 |
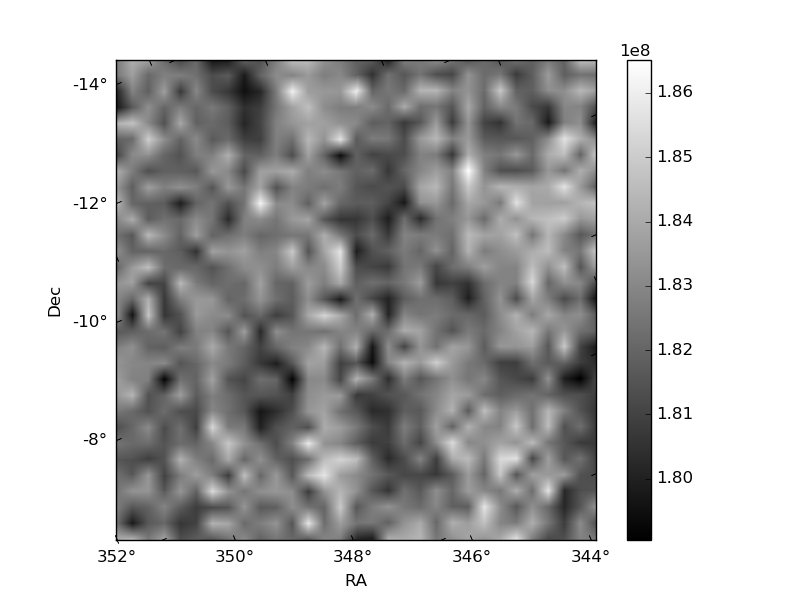
Quadrant C |
| Plot type | Count rate plots | Images |
|---|---|---|
| Comparison with Poisson distribution Blue bars denote a histogram of data divided into 1 sec bins. Red curve is a Poisson curve with rate = median count rate of data. |
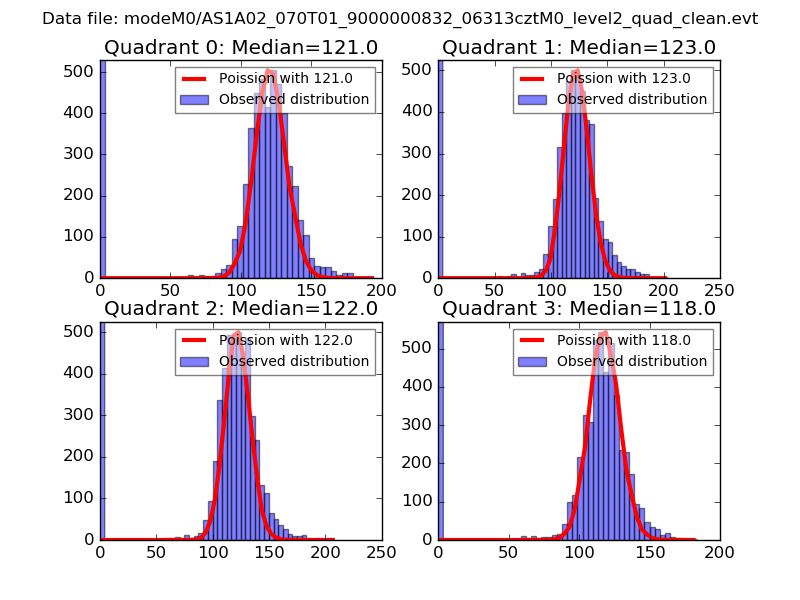 |
 |
| Quadrant-wise count rates Data is divided into 100 sec bins |
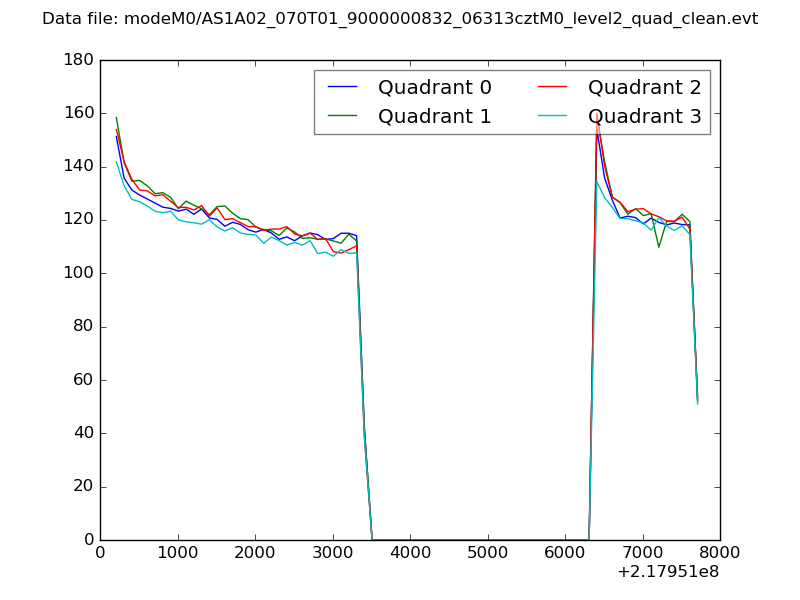 |
|
| Module-wise count rates for Quadrant A Data is divided into 100 sec bins |
 |
 |
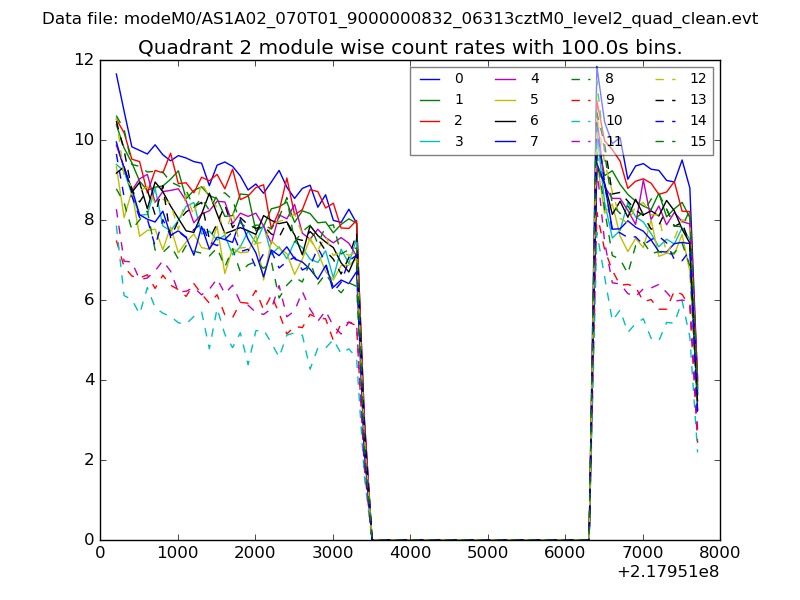
| Module-wise count rates for Quadrant B Data is divided into 100 sec bins |
 |
 |
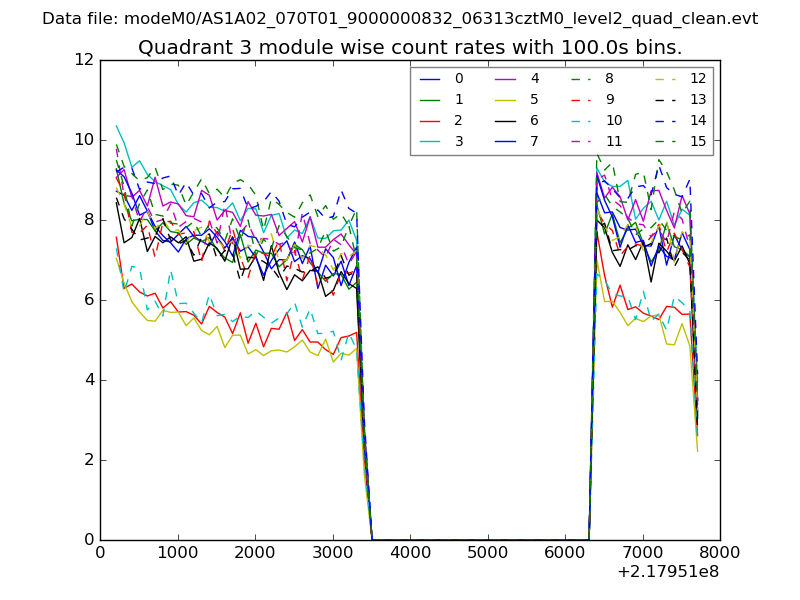
| Module-wise count rates for Quadrant C Data is divided into 100 sec bins |
 |
 |
| Module-wise count rates for Quadrant D Data is divided into 100 sec bins |
 |
 |
| Parameter | Plot |
|---|---|
| CZT HV Monitor | 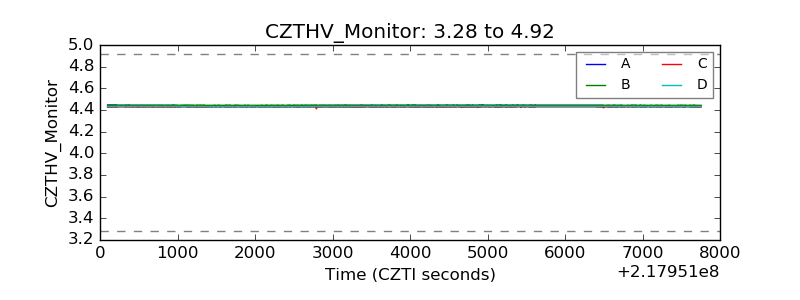 |
| D_VDD | 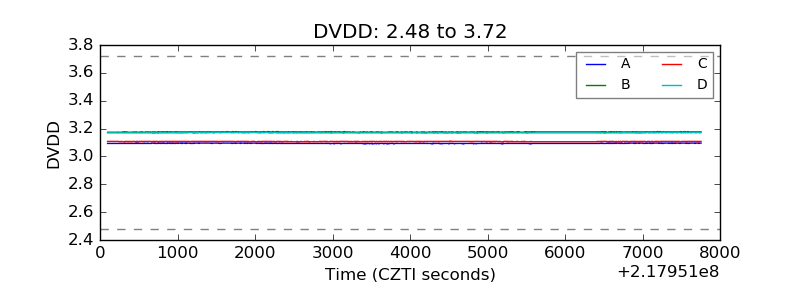 |
| Temperature 1 | 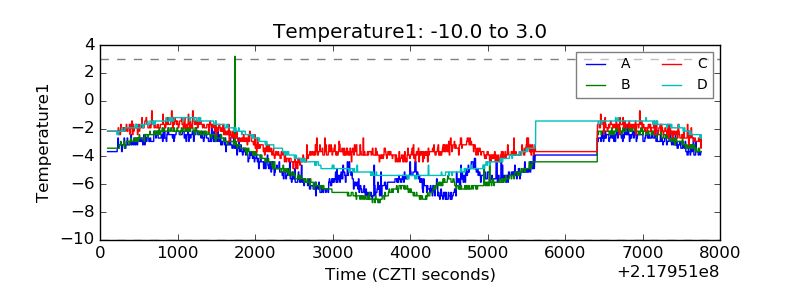 |
| Veto HV Monitor | 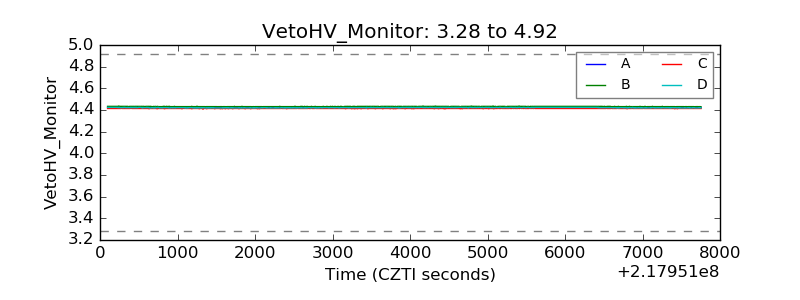 |
| Veto LLD | 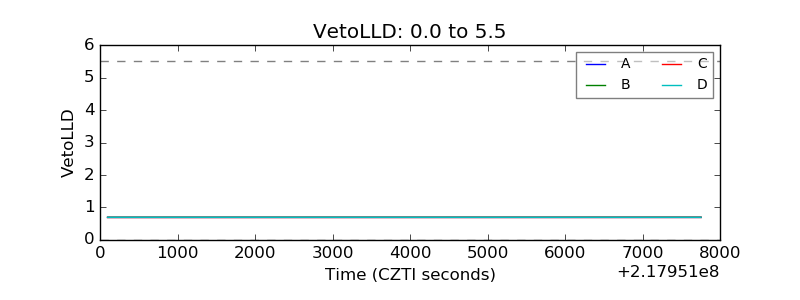 |
| Alpha Counter | 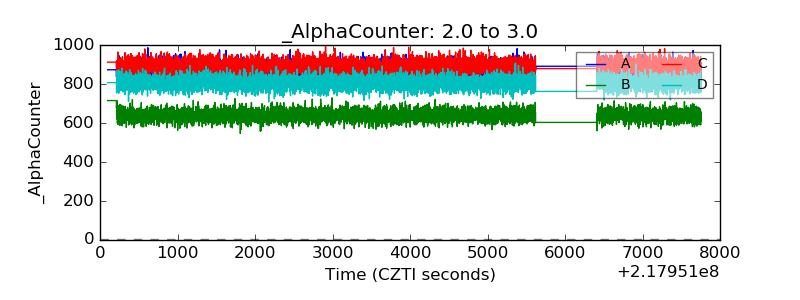 |
| _CPM_Rate | 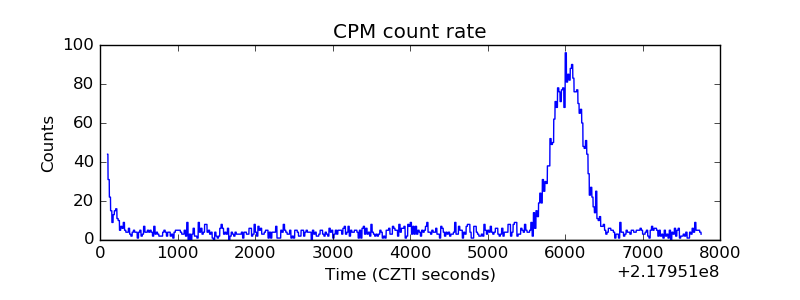 |
| CZT Counter | 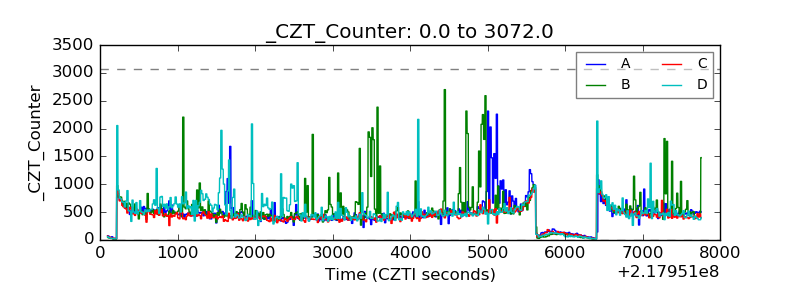 |
| +2.5 Volts monitor |  |
| +5 Volts monitor |  |
| _ROLL_ROT | 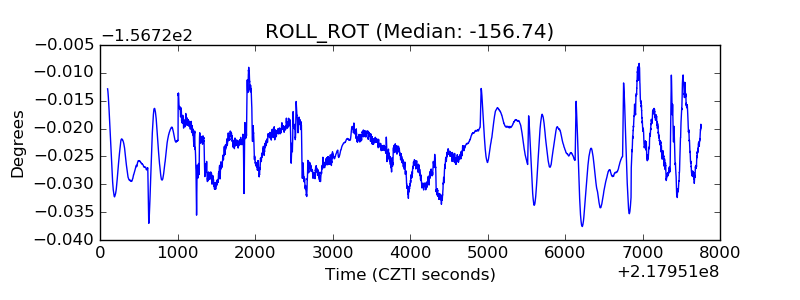 |
| _Roll_DEC | 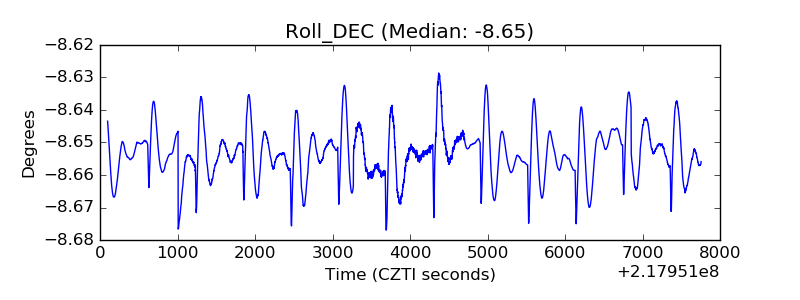 |
| _Roll_RA | 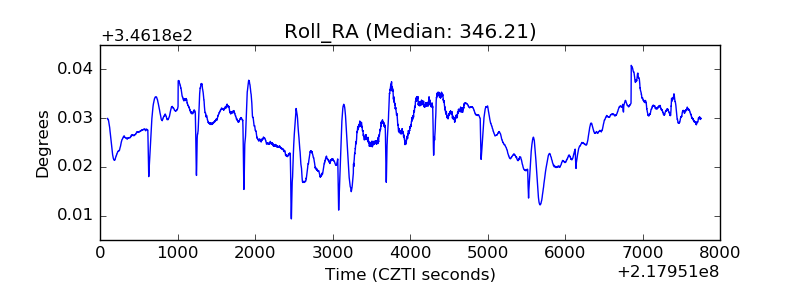 |
| Veto Counter | 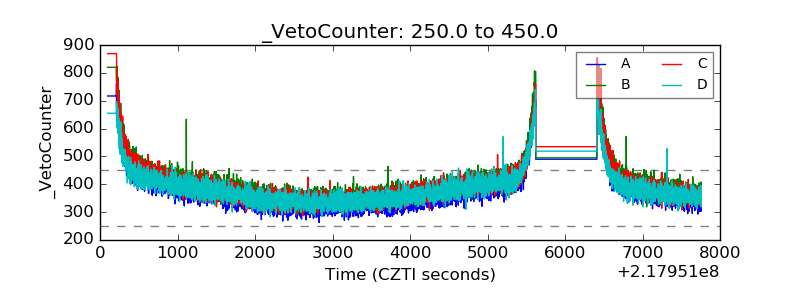 |