| Param | Original file | Final file |
|---|---|---|
| Filename | modeM0/AS1A02_070T01_9000000832_06315cztM0_level2.evt | modeM0/AS1A02_070T01_9000000832_06315cztM0_level2_quad_clean.evt |
| Size (bytes) | 581,794,560 | 103,688,640 |
| Size | 554.8 MB | 98.9 MB |
| Events in quadrant A | 4,535,863 | 647,604 |
| Events in quadrant B | 4,128,324 | 664,932 |
| Events in quadrant C | 3,464,061 | 665,137 |
| Events in quadrant D | 4,968,041 | 625,237 |
| Mode M9 | |||
|---|---|---|---|
| Quadrant | BADHDUFLAG | Total packets | Discarded packets |
| A | 0 | 2 | 0 |
| B | 0 | 2 | 0 |
| C | 0 | 2 | 0 |
| D | 0 | 3 | 0 |
| Mode SS | |||
|---|---|---|---|
| Quadrant | BADHDUFLAG | Total packets | Discarded packets |
| A | 0 | 156 | 0 |
| B | 0 | 156 | 0 |
| C | 0 | 156 | 0 |
| D | 0 | 156 | 0 |
| Mode M0 | |||
|---|---|---|---|
| Quadrant | BADHDUFLAG | Total packets | Discarded packets |
| A | 0 | 18843 | 3 |
| B | 0 | 17635 | 2 |
| C | 0 | 15917 | 2 |
| D | 0 | 20016 | 2 |
| Quadrant | Total seconds | Saturated seconds | Saturation percentage |
|---|---|---|---|
| A | 7722 | 168 | 2.175602% |
| B | 7722 | 201 | 2.602953% |
| C | 7722 | 34 | 0.440300% |
| D | 7722 | 231 | 2.991453% |
Noise dominated data is calculated using 1-second bins in cleaned event files. If a bin has >2000 counts, and if more than 50% of those come from <1% of pixels, then it is considered to be noise-dominated and hence unusable.
| Quadrant | # 1 sec bins | Bins with >0 counts | Bins with >2000 counts | High rate bins dominated by noise | Noise dominated (total time) | Noise dominated (detector-on time) | Marked lightcurve |
|---|---|---|---|---|---|---|---|
| A | 7911 | 7721 | 12 | 12 | 0.15% | 0.16% | 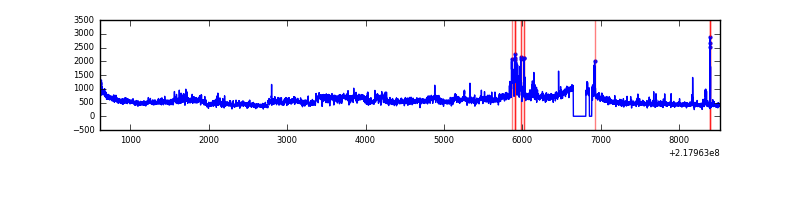 |
| B | 7911 | 7721 | 46 | 46 | 0.58% | 0.60% | 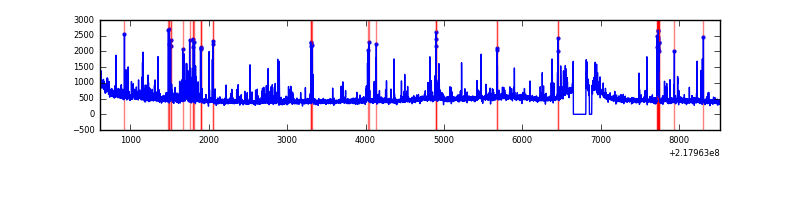 |
| C | 7911 | 7722 | 0 | 0 | 0.00% | 0.00% |  |
| D | 7911 | 7721 | 142 | 142 | 1.79% | 1.84% | 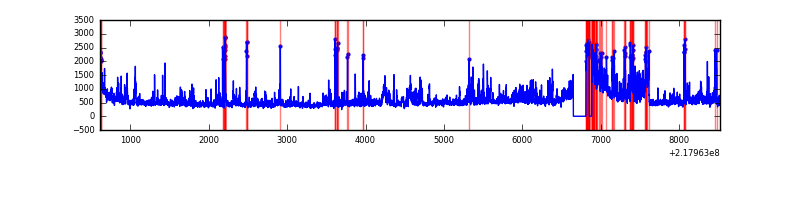 |
Top three noisy pixels from each quadrant. If the there are fewer than three noisy pixels in the level2.evt file, extra rows are filled as -1
| Pixel properties | Quadrant properties | ||||||
|---|---|---|---|---|---|---|---|
| Quadrant | DetID | PixID | Counts | Sigma | Mean | Median | Sigma |
| A | 15 | 236 | 739606 | 3975.3 | 902 | 878 | 185.8 |
| A | 8 | 15 | 131827 | 704.67 | 902 | 878 | 185.8 |
| A | 15 | 174 | 121623 | 649.76 | 902 | 878 | 185.8 |
| B | 3 | 64 | 463010 | 2602.02 | 914 | 889 | 177.6 |
| B | 15 | 204 | 52635 | 291.36 | 914 | 889 | 177.6 |
| B | 4 | 81 | 30344 | 165.85 | 914 | 889 | 177.6 |
| C | 9 | 54 | 10816 | 48.08 | 880 | 883 | 206.6 |
| C | 13 | 61 | 6922 | 29.23 | 880 | 883 | 206.6 |
| C | 1 | 16 | 6899 | 29.12 | 880 | 883 | 206.6 |
| D | 12 | 220 | 723164 | 3390.29 | 865 | 836 | 213.1 |
| D | 12 | 221 | 334905 | 1567.97 | 865 | 836 | 213.1 |
| D | 2 | 152 | 197708 | 924.03 | 865 | 836 | 213.1 |
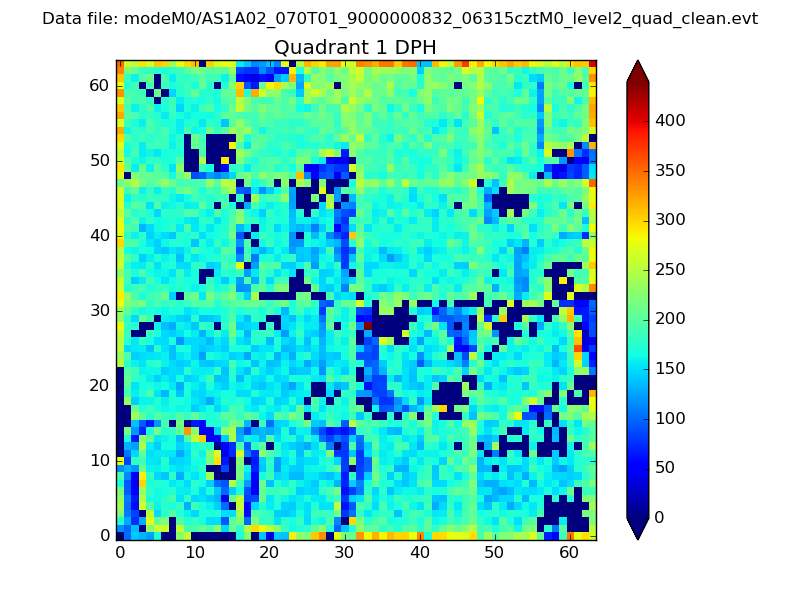
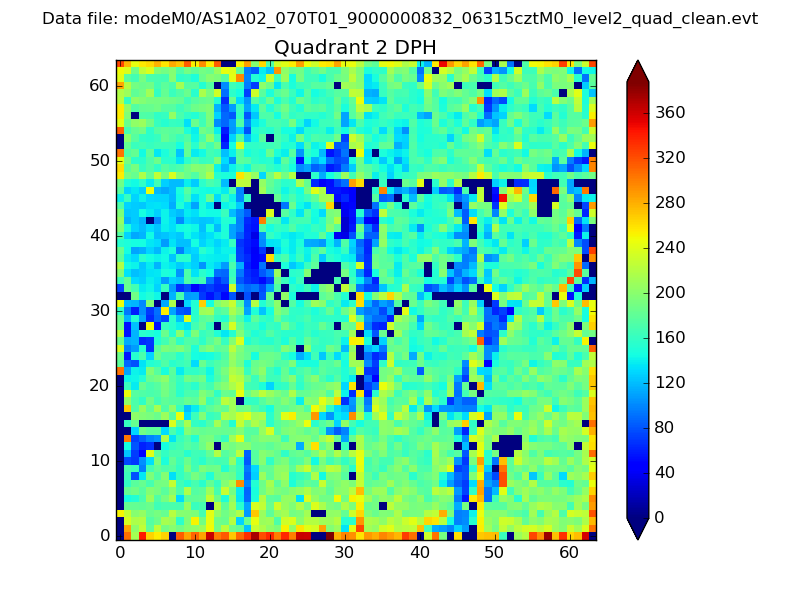
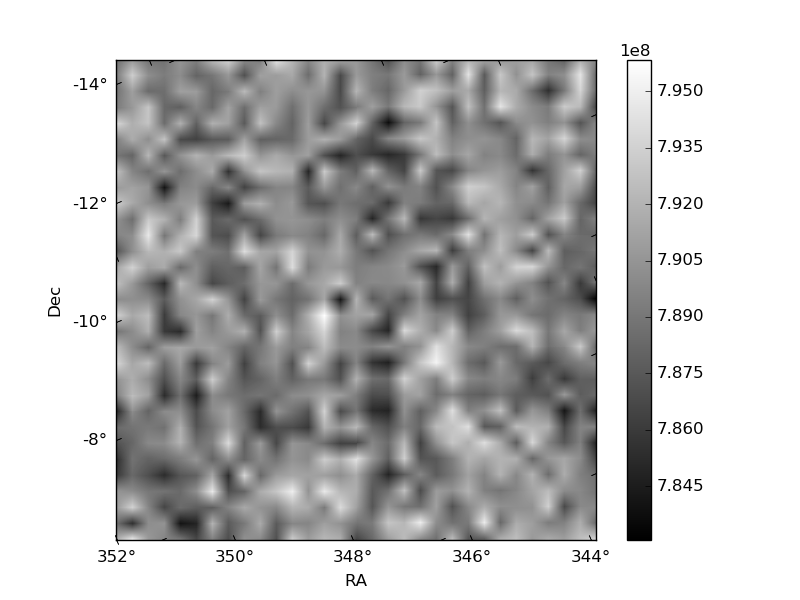
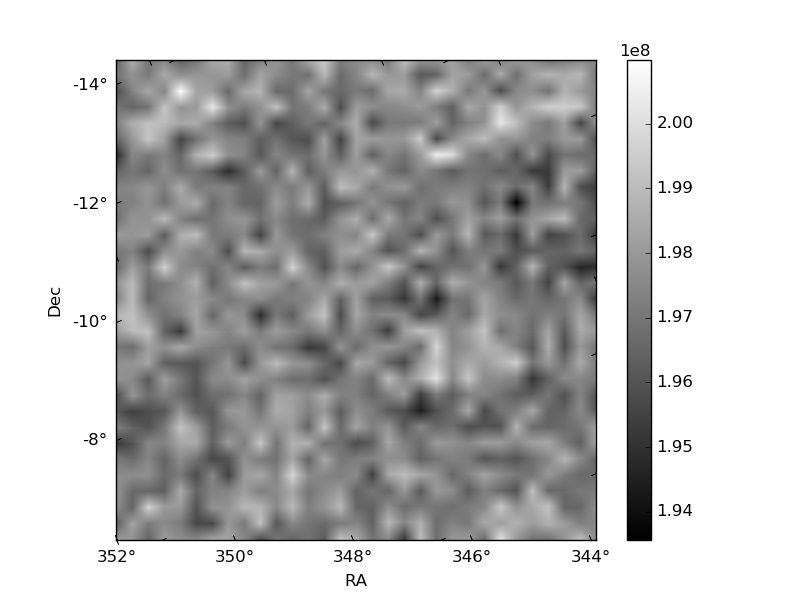
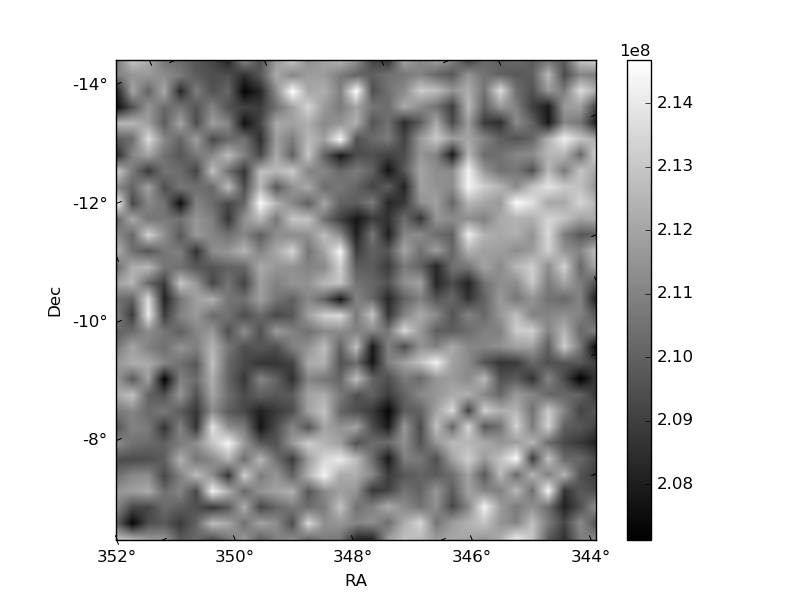
Histogram calculated using DETX and DETY for each event in the final _common_clean file
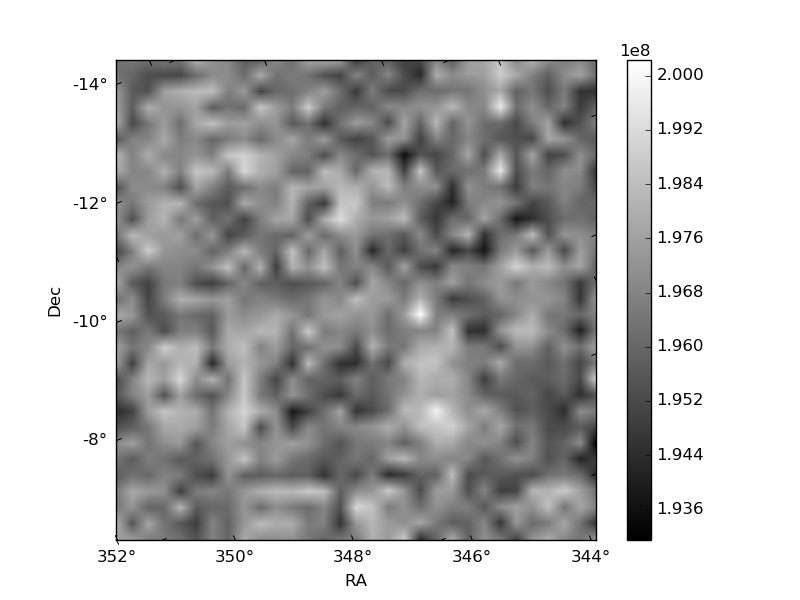
| Quadrant A | 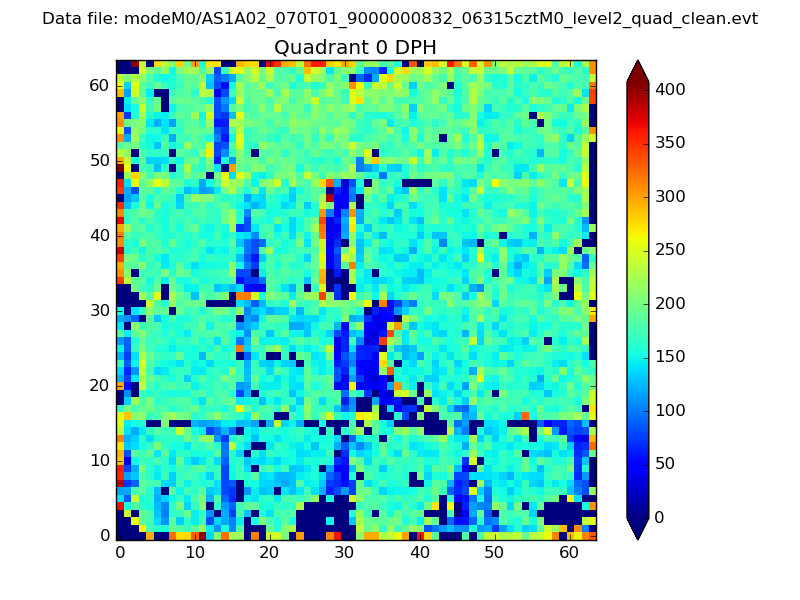 |
 |
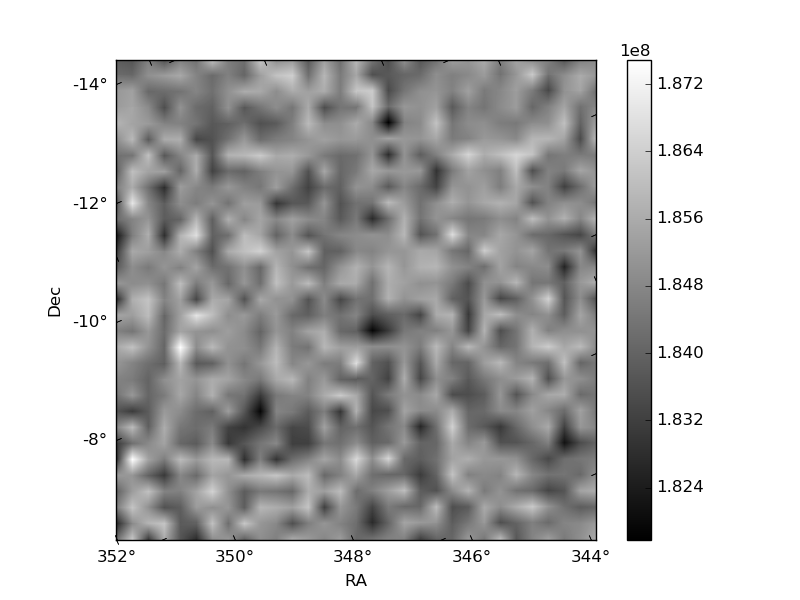
Quadrant B |
|---|---|---|---|
| Quadrant D | 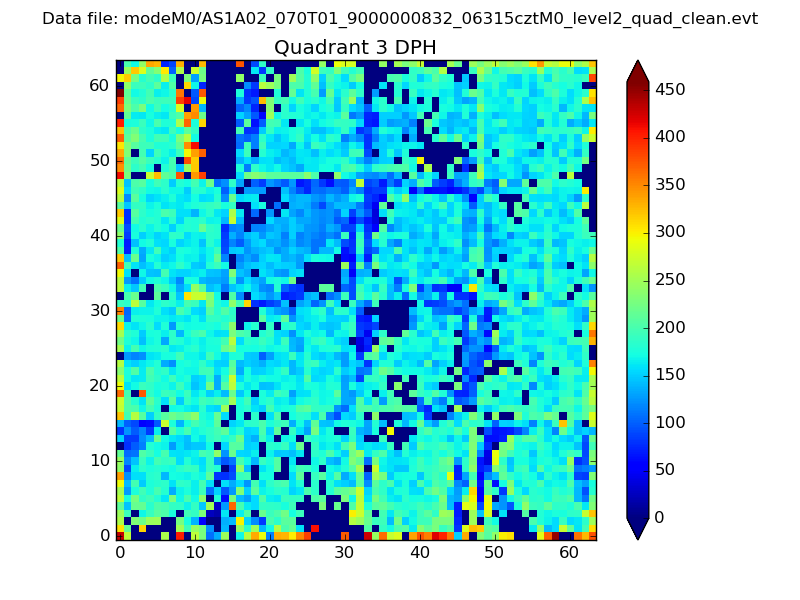 |
 |
Quadrant C |
| Plot type | Count rate plots | Images |
|---|---|---|
| Comparison with Poisson distribution Blue bars denote a histogram of data divided into 1 sec bins. Red curve is a Poisson curve with rate = median count rate of data. |
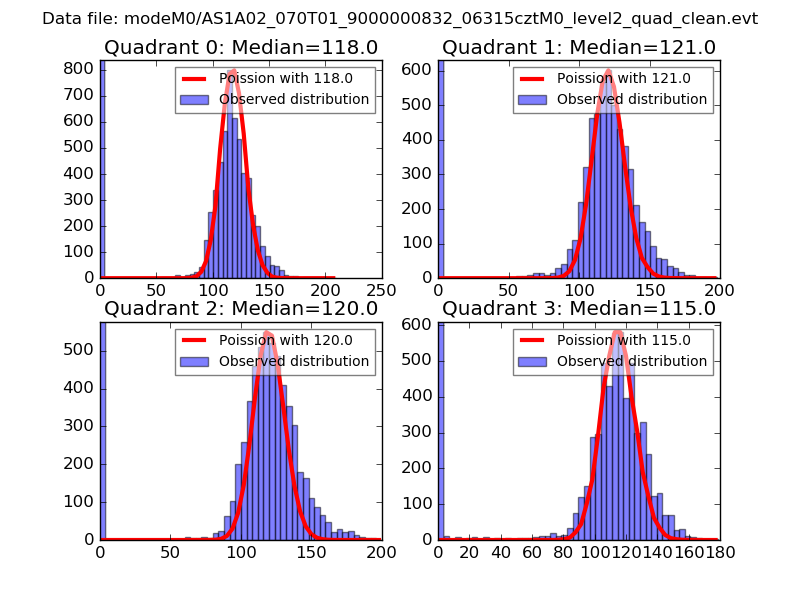 |
 |
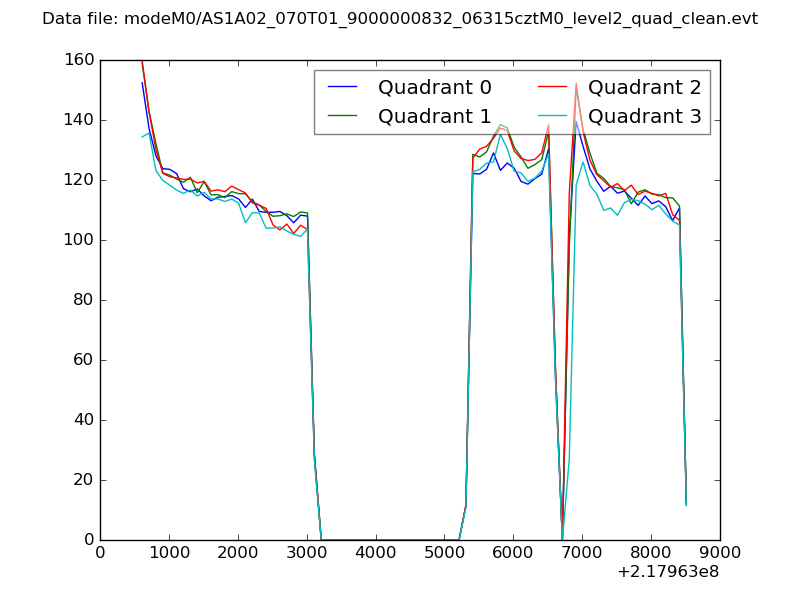
| Quadrant-wise count rates Data is divided into 100 sec bins |
 |
|
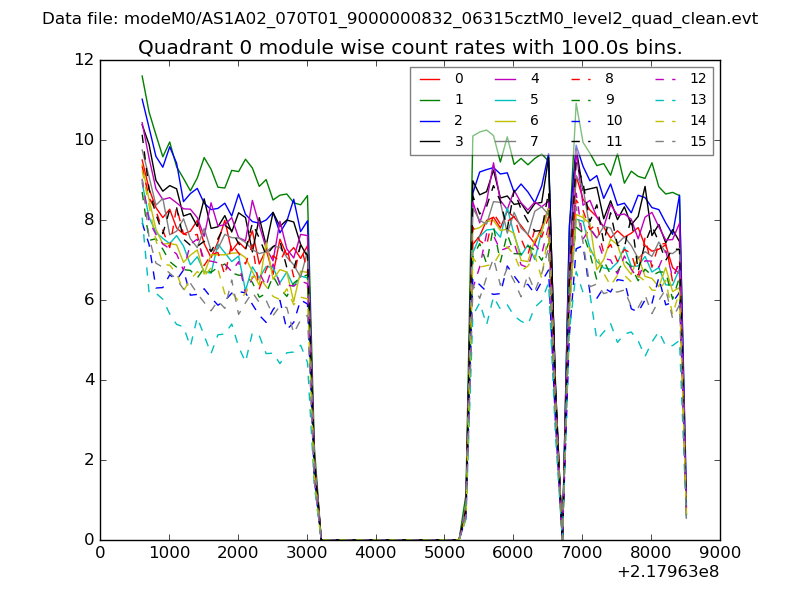
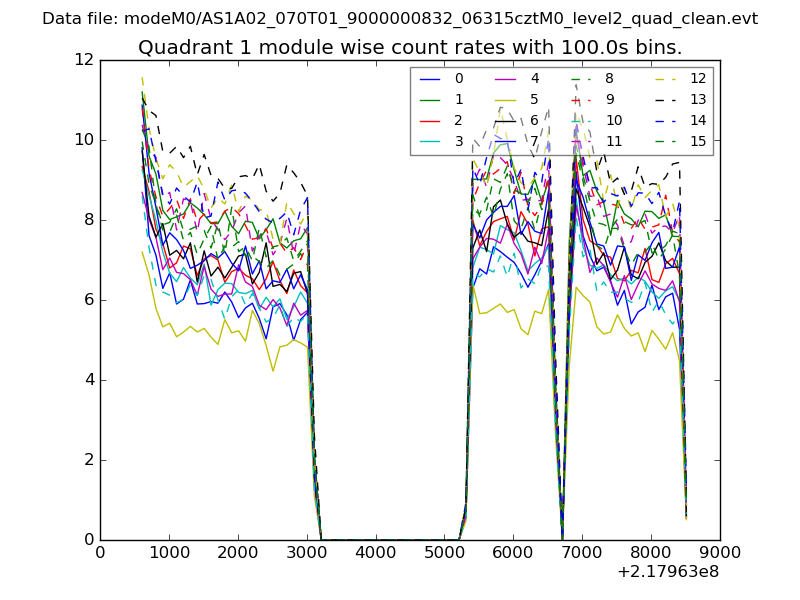
| Module-wise count rates for Quadrant A Data is divided into 100 sec bins |
 |
 |
| Module-wise count rates for Quadrant B Data is divided into 100 sec bins |
 |
 |
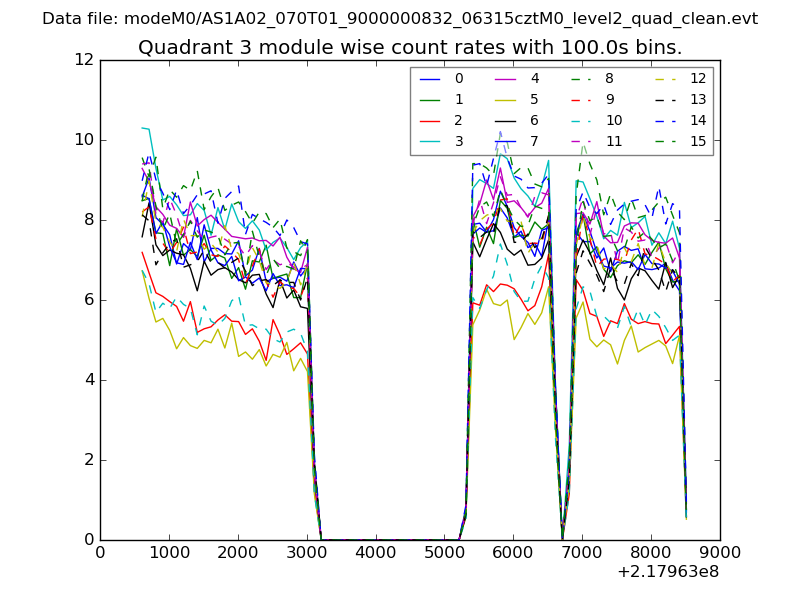
| Module-wise count rates for Quadrant C Data is divided into 100 sec bins |
 |
 |
| Module-wise count rates for Quadrant D Data is divided into 100 sec bins |
 |
 |
| Parameter | Plot |
|---|---|
| CZT HV Monitor | 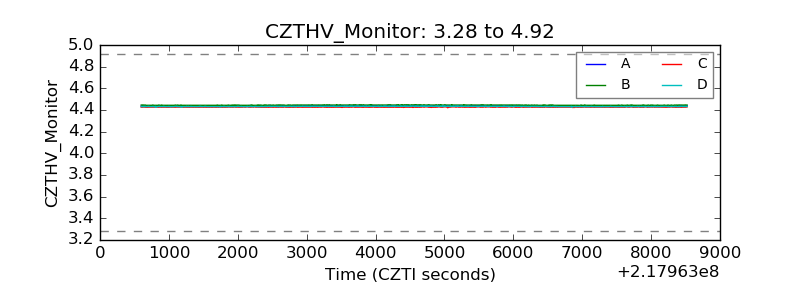 |
| D_VDD | 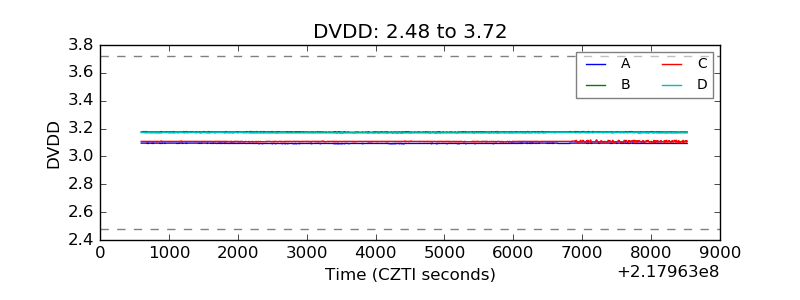 |
| Temperature 1 | 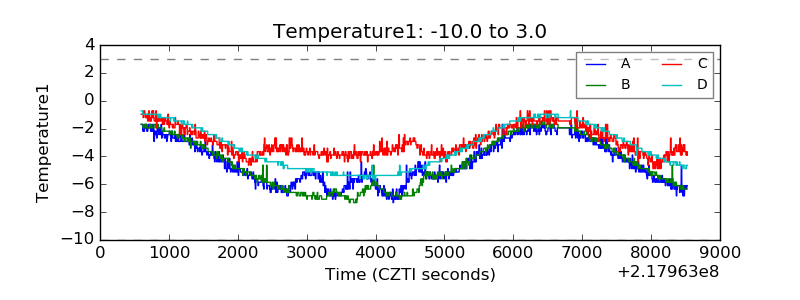 |
| Veto HV Monitor | 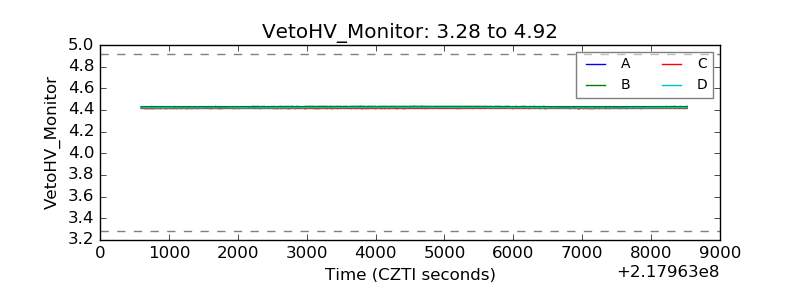 |
| Veto LLD | 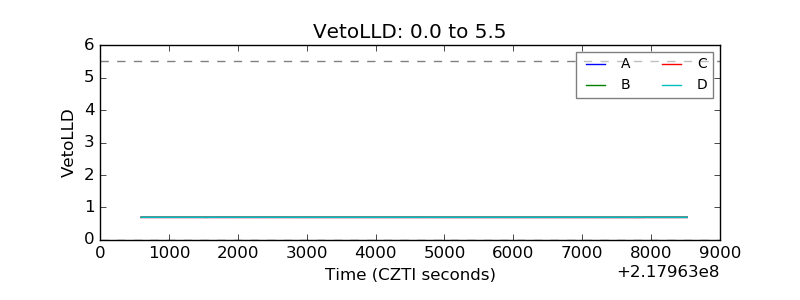 |
| Alpha Counter | 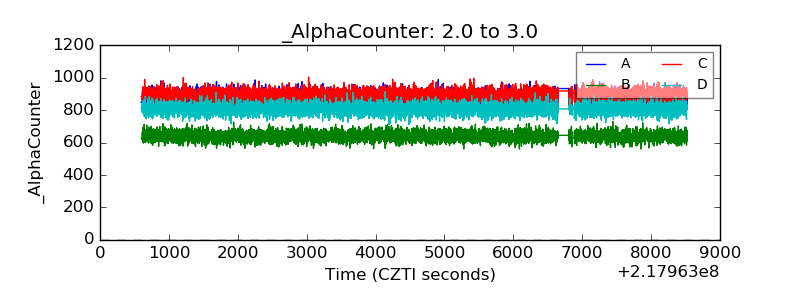 |
| _CPM_Rate | 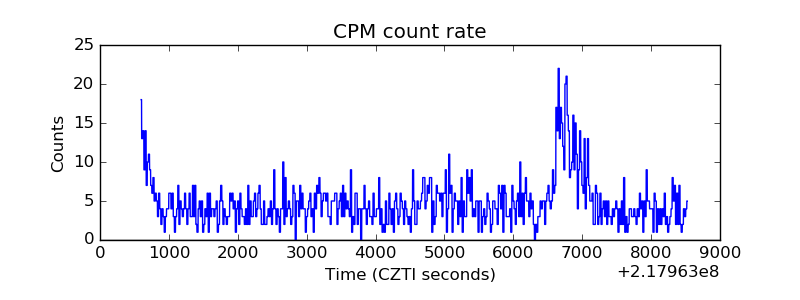 |
| CZT Counter | 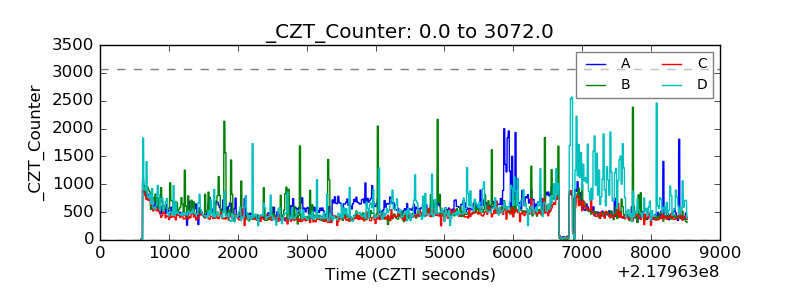 |
| +2.5 Volts monitor |  |
| +5 Volts monitor |  |
| _ROLL_ROT | 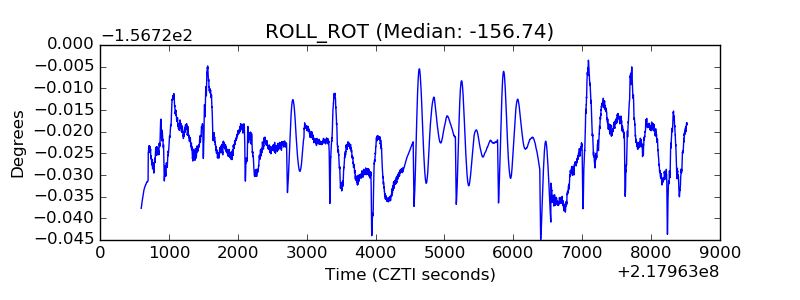 |
| _Roll_DEC | 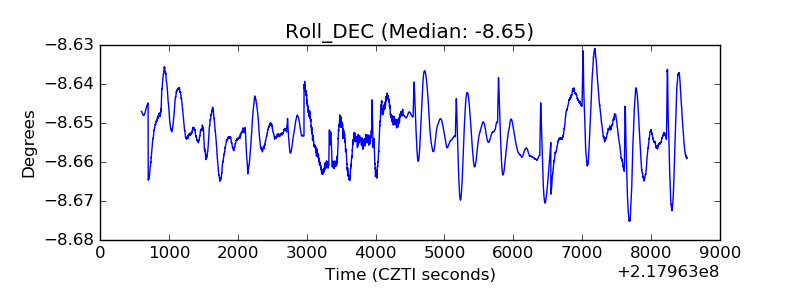 |
| _Roll_RA | 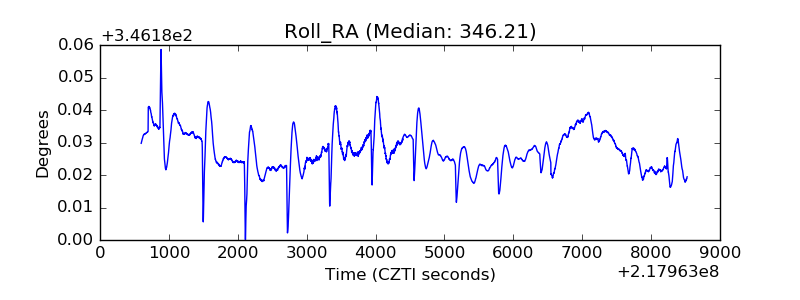 |
| Veto Counter |  |