| Param | Original file | Final file |
|---|---|---|
| Filename | modeM0/AS1A02_070T01_9000000832_06316cztM0_level2.evt | modeM0/AS1A02_070T01_9000000832_06316cztM0_level2_quad_clean.evt |
| Size (bytes) | 583,997,760 | 101,577,600 |
| Size | 556.9 MB | 96.9 MB |
| Events in quadrant A | 3,933,901 | 638,693 |
| Events in quadrant B | 4,149,217 | 646,509 |
| Events in quadrant C | 3,517,045 | 651,742 |
| Events in quadrant D | 5,565,773 | 605,160 |
| Mode M9 | |||
|---|---|---|---|
| Quadrant | BADHDUFLAG | Total packets | Discarded packets |
| A | 0 | 5 | 0 |
| B | 0 | 5 | 0 |
| C | 0 | 5 | 0 |
| D | 0 | 5 | 0 |
| Mode SS | |||
|---|---|---|---|
| Quadrant | BADHDUFLAG | Total packets | Discarded packets |
| A | 0 | 158 | 0 |
| B | 0 | 158 | 0 |
| C | 0 | 158 | 0 |
| D | 0 | 158 | 0 |
| Mode M0 | |||
|---|---|---|---|
| Quadrant | BADHDUFLAG | Total packets | Discarded packets |
| A | 0 | 17100 | 3 |
| B | 0 | 17598 | 2 |
| C | 0 | 15834 | 2 |
| D | 0 | 21875 | 2 |
| Quadrant | Total seconds | Saturated seconds | Saturation percentage |
|---|---|---|---|
| A | 7673 | 170 | 2.215561% |
| B | 7673 | 306 | 3.988010% |
| C | 7673 | 52 | 0.677701% |
| D | 7673 | 326 | 4.248664% |
Noise dominated data is calculated using 1-second bins in cleaned event files. If a bin has >2000 counts, and if more than 50% of those come from <1% of pixels, then it is considered to be noise-dominated and hence unusable.
| Quadrant | # 1 sec bins | Bins with >0 counts | Bins with >2000 counts | High rate bins dominated by noise | Noise dominated (total time) | Noise dominated (detector-on time) | Marked lightcurve |
|---|---|---|---|---|---|---|---|
| A | 8172 | 7672 | 14 | 14 | 0.17% | 0.18% | 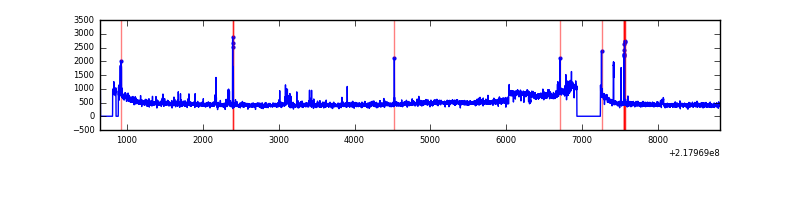 |
| B | 8172 | 7672 | 124 | 124 | 1.52% | 1.62% | 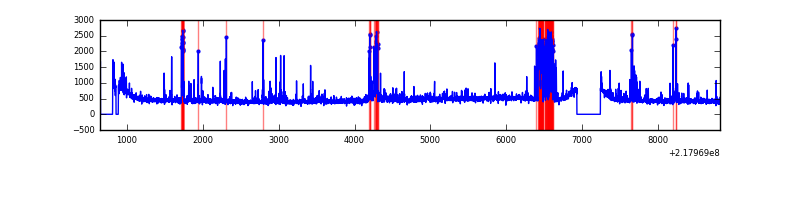 |
| C | 8172 | 7673 | 4 | 4 | 0.05% | 0.05% |  |
| D | 8172 | 7672 | 169 | 169 | 2.07% | 2.20% | 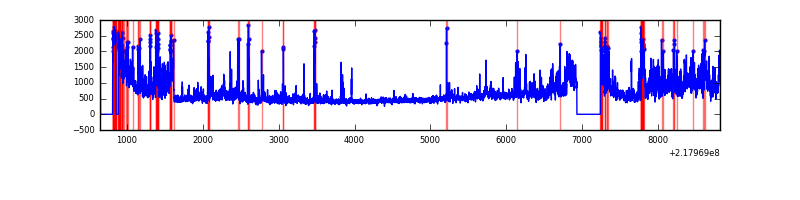 |
Top three noisy pixels from each quadrant. If the there are fewer than three noisy pixels in the level2.evt file, extra rows are filled as -1
| Pixel properties | Quadrant properties | ||||||
|---|---|---|---|---|---|---|---|
| Quadrant | DetID | PixID | Counts | Sigma | Mean | Median | Sigma |
| A | 15 | 236 | 264433 | 1432.9 | 883 | 864 | 183.9 |
| A | 8 | 15 | 148866 | 804.62 | 883 | 864 | 183.9 |
| A | 13 | 251 | 62869 | 337.09 | 883 | 864 | 183.9 |
| B | 3 | 64 | 603238 | 3499.23 | 891 | 872 | 172.1 |
| B | 4 | 81 | 68815 | 394.69 | 891 | 872 | 172.1 |
| B | 12 | 111 | 16841 | 92.77 | 891 | 872 | 172.1 |
| C | 1 | 16 | 93057 | 459.25 | 863 | 867 | 200.7 |
| C | 8 | 128 | 17539 | 83.05 | 863 | 867 | 200.7 |
| C | 9 | 54 | 13798 | 64.42 | 863 | 867 | 200.7 |
| D | 12 | 221 | 911705 | 4296.82 | 848 | 817 | 212.0 |
| D | 2 | 63 | 653544 | 3079.03 | 848 | 817 | 212.0 |
| D | 12 | 220 | 260565 | 1225.28 | 848 | 817 | 212.0 |
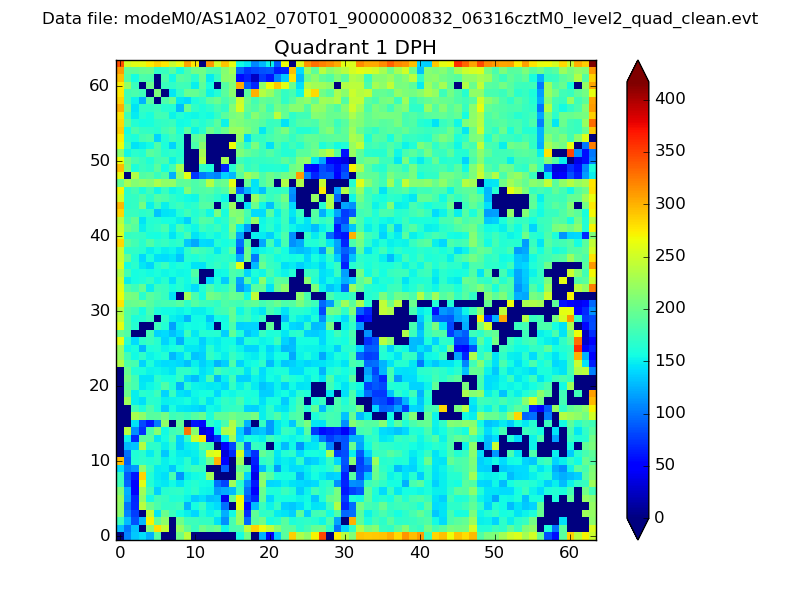
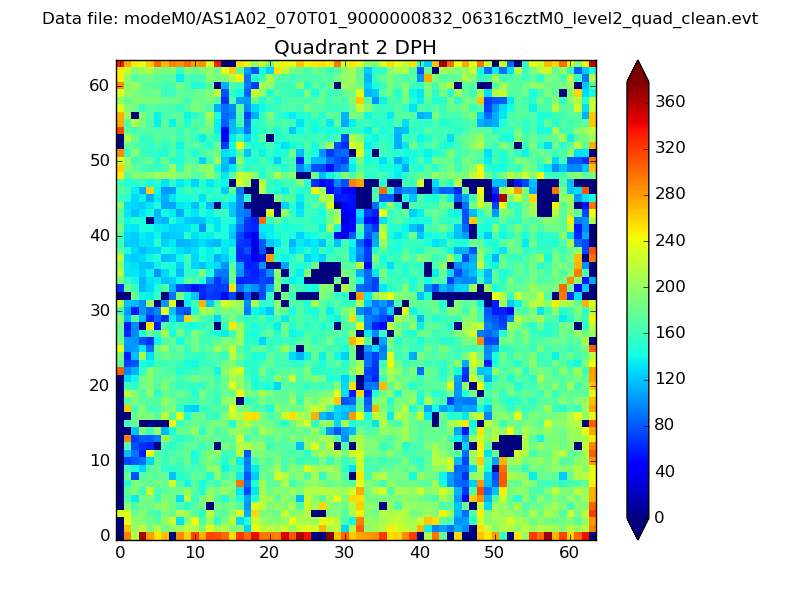
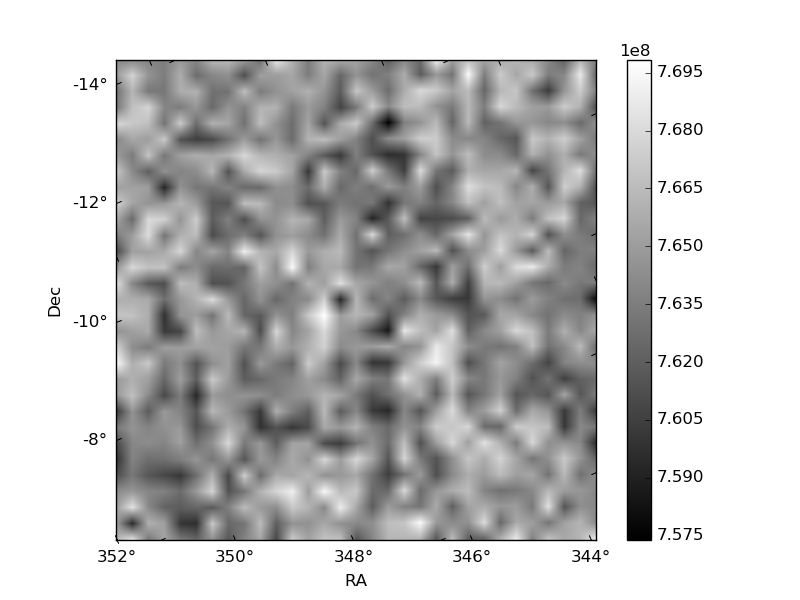
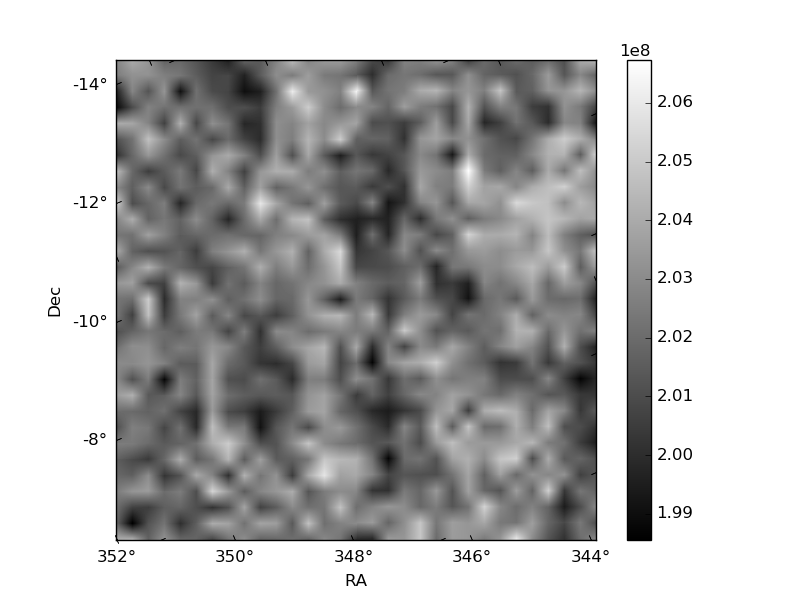
Histogram calculated using DETX and DETY for each event in the final _common_clean file
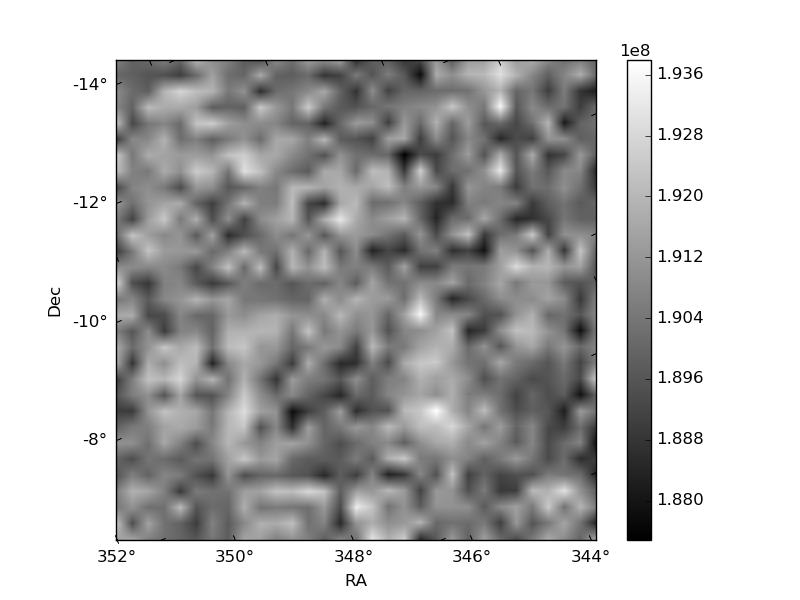
| Quadrant A | 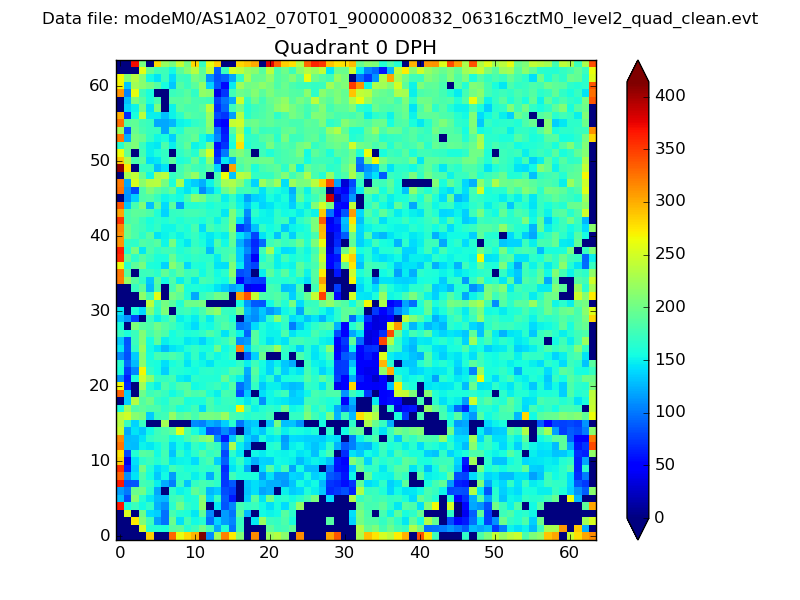 |
 |
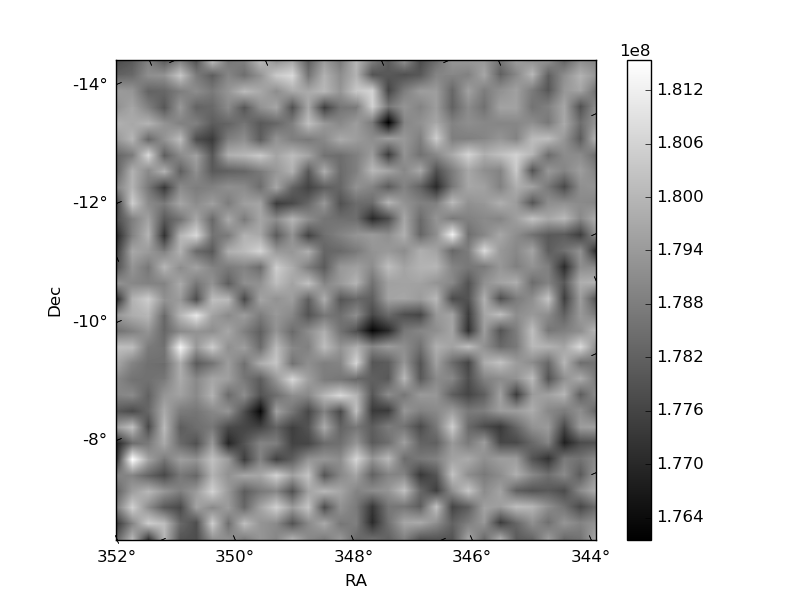
Quadrant B |
|---|---|---|---|
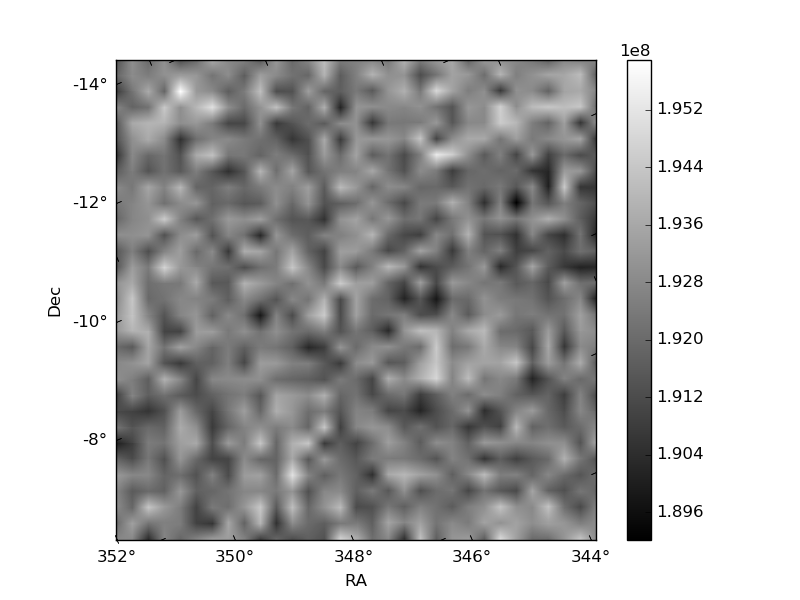
| Quadrant D | 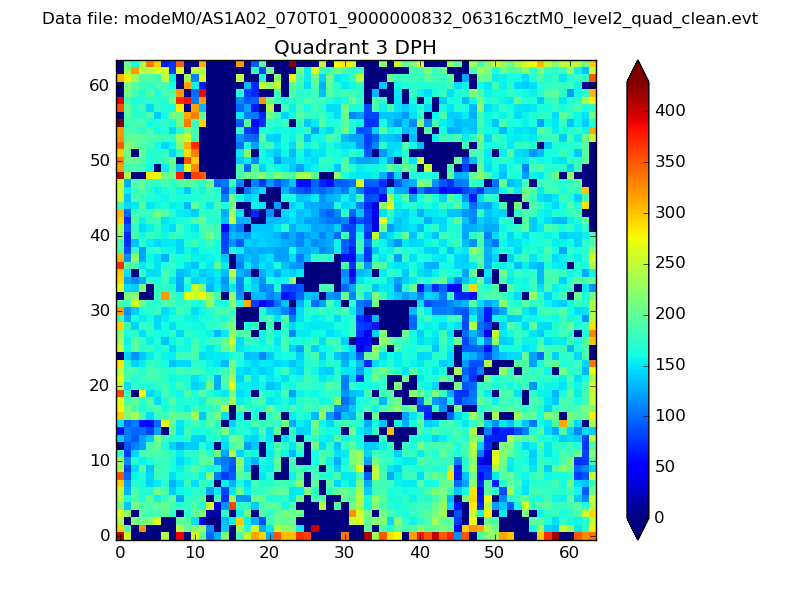 |
 |
Quadrant C |
| Plot type | Count rate plots | Images |
|---|---|---|
| Comparison with Poisson distribution Blue bars denote a histogram of data divided into 1 sec bins. Red curve is a Poisson curve with rate = median count rate of data. |
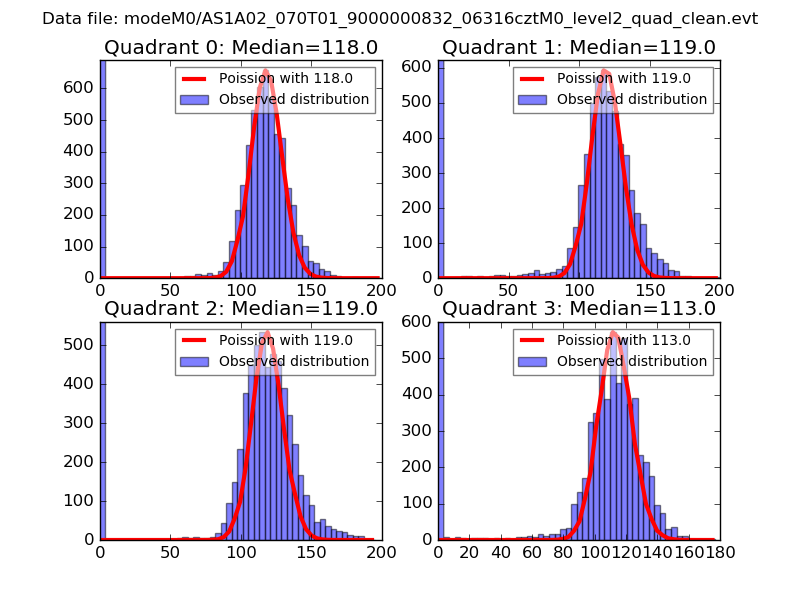 |
 |
| Quadrant-wise count rates Data is divided into 100 sec bins |
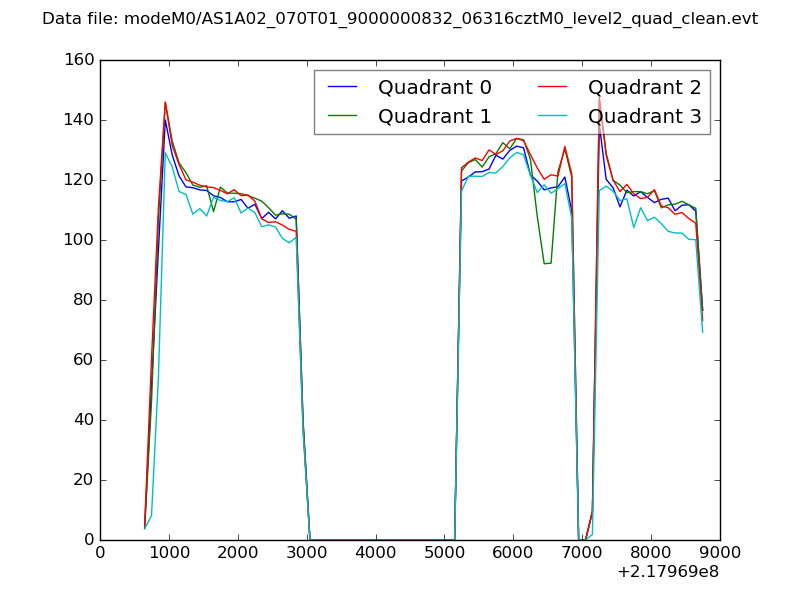 |
|
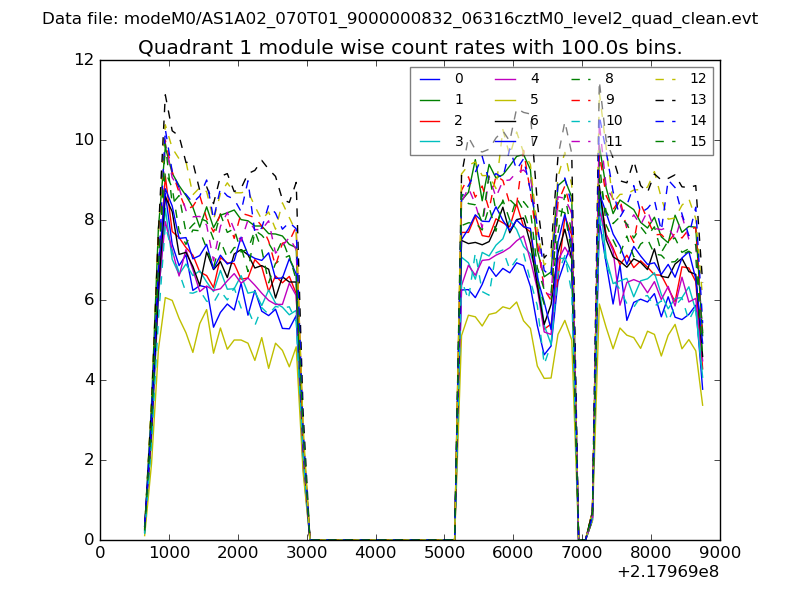
| Module-wise count rates for Quadrant A Data is divided into 100 sec bins |
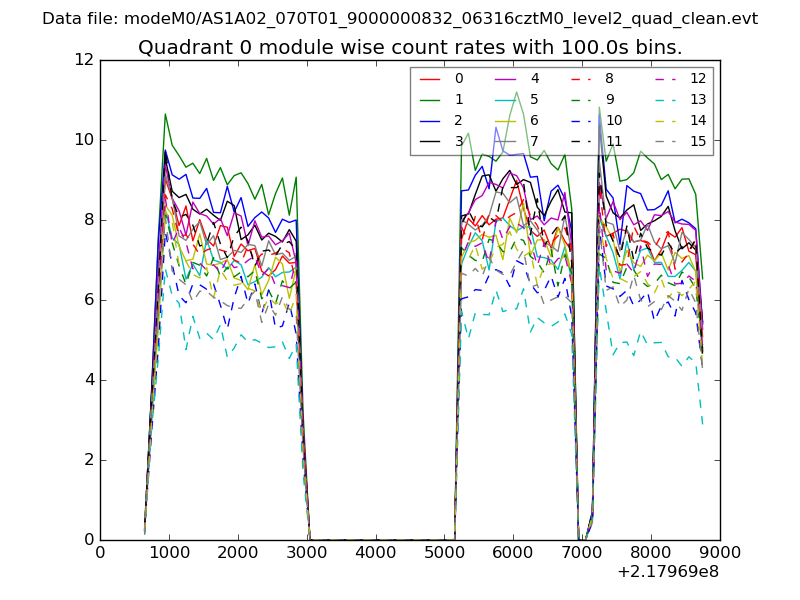 |
 |
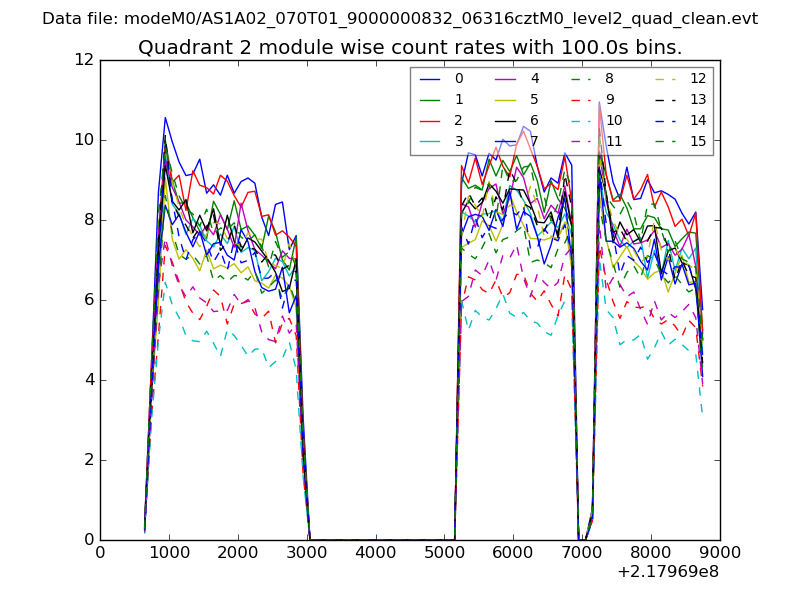
| Module-wise count rates for Quadrant B Data is divided into 100 sec bins |
 |
 |
| Module-wise count rates for Quadrant C Data is divided into 100 sec bins |
 |
 |
| Module-wise count rates for Quadrant D Data is divided into 100 sec bins |
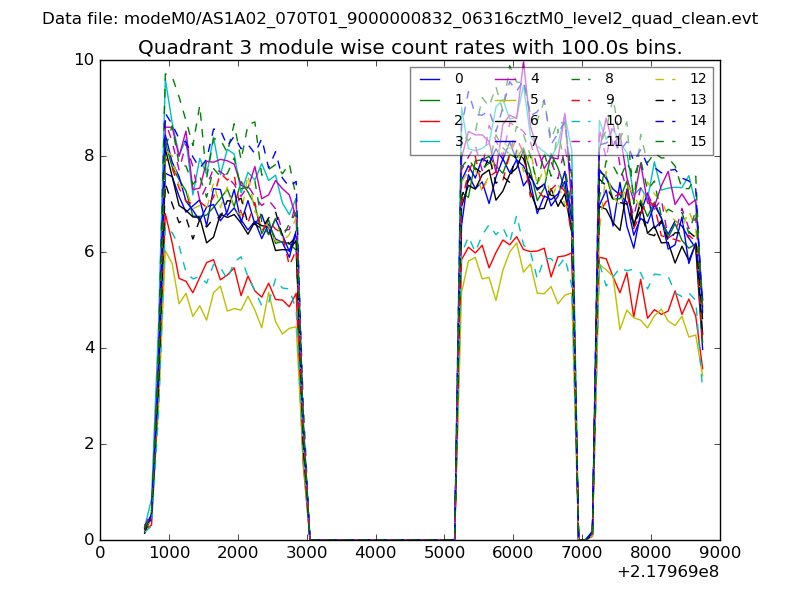 |
 |
| Parameter | Plot |
|---|---|
| CZT HV Monitor | 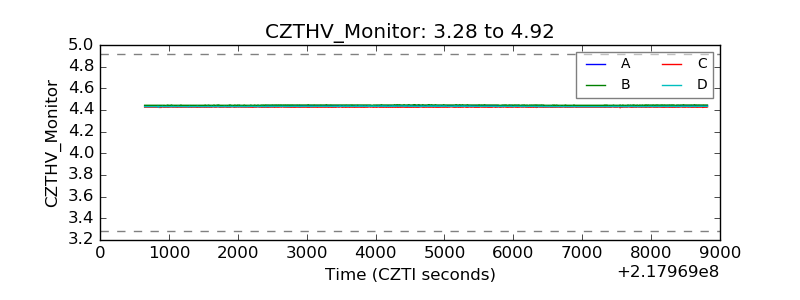 |
| D_VDD | 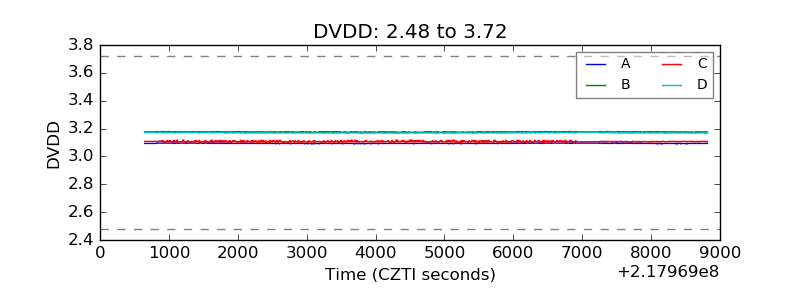 |
| Temperature 1 | 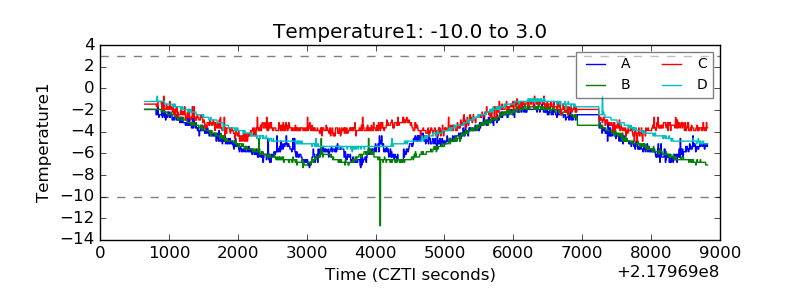 |
| Veto HV Monitor | 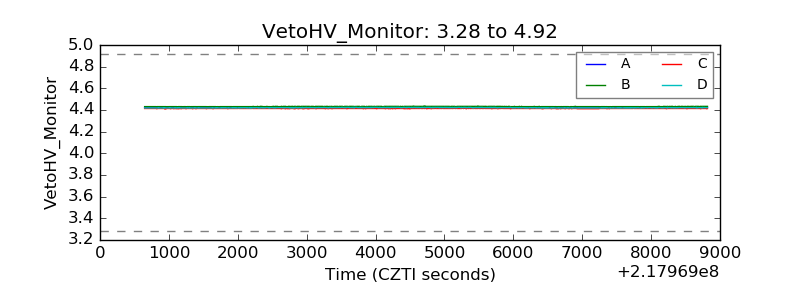 |
| Veto LLD | 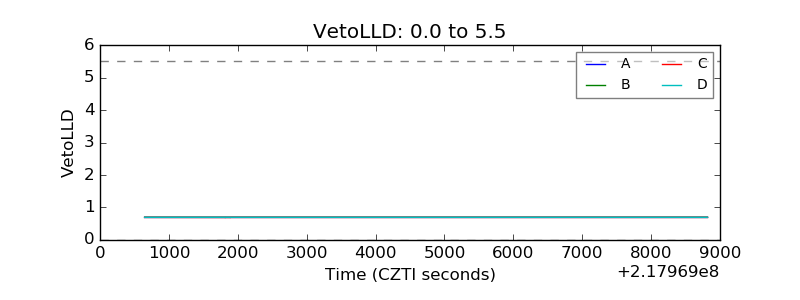 |
| Alpha Counter | 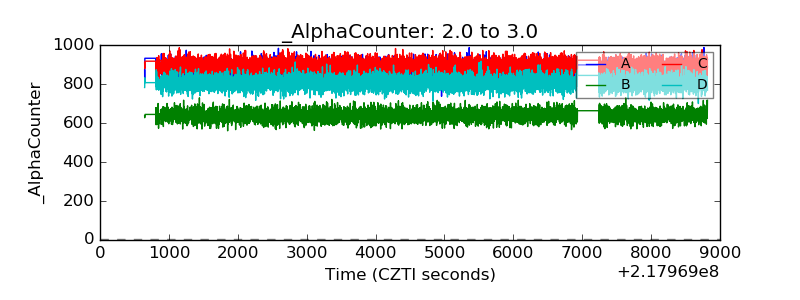 |
| _CPM_Rate | 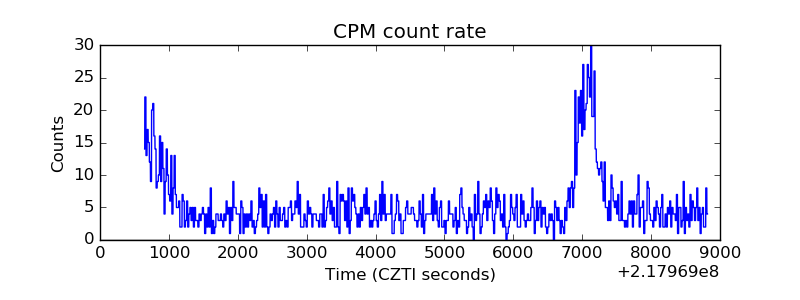 |
| CZT Counter | 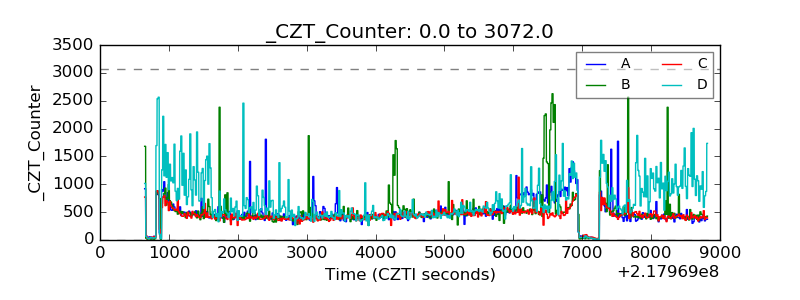 |
| +2.5 Volts monitor |  |
| +5 Volts monitor |  |
| _ROLL_ROT | 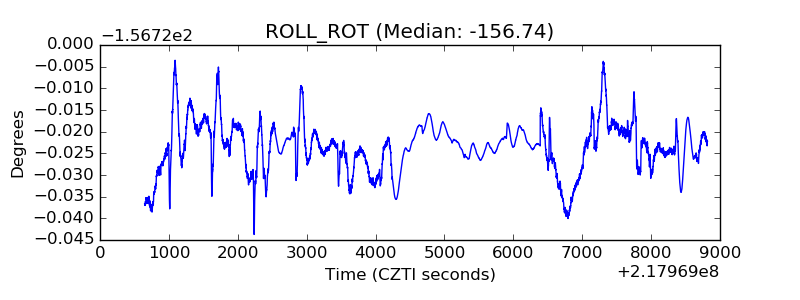 |
| _Roll_DEC | 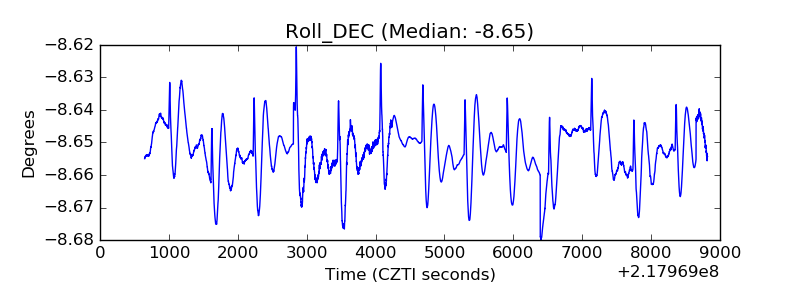 |
| _Roll_RA | 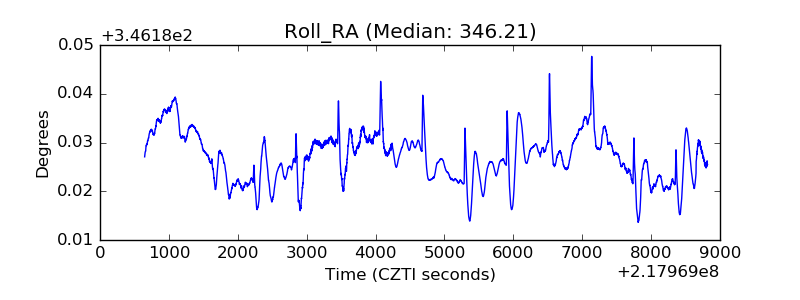 |
| Veto Counter |  |