| Param | Original file | Final file |
|---|---|---|
| Filename | modeM0/AS1A02_070T01_9000000832_06320cztM0_level2.evt | modeM0/AS1A02_070T01_9000000832_06320cztM0_level2_quad_clean.evt |
| Size (bytes) | 491,503,680 | 62,740,800 |
| Size | 468.7 MB | 59.8 MB |
| Events in quadrant A | 3,131,601 | 365,250 |
| Events in quadrant B | 4,357,160 | 343,961 |
| Events in quadrant C | 3,096,219 | 374,171 |
| Events in quadrant D | 3,849,040 | 352,703 |
| Mode M9 | |||
|---|---|---|---|
| Quadrant | BADHDUFLAG | Total packets | Discarded packets |
| A | 0 | 15 | 0 |
| B | 0 | 15 | 0 |
| C | 0 | 15 | 0 |
| D | 0 | 16 | 0 |
| Mode SS | |||
|---|---|---|---|
| Quadrant | BADHDUFLAG | Total packets | Discarded packets |
| A | 0 | 134 | 0 |
| B | 0 | 134 | 0 |
| C | 0 | 134 | 0 |
| D | 0 | 134 | 0 |
| Mode M0 | |||
|---|---|---|---|
| Quadrant | BADHDUFLAG | Total packets | Discarded packets |
| A | 0 | 13733 | 3 |
| B | 0 | 17329 | 2 |
| C | 0 | 13798 | 2 |
| D | 0 | 15996 | 2 |
| Quadrant | Total seconds | Saturated seconds | Saturation percentage |
|---|---|---|---|
| A | 6645 | 59 | 0.887886% |
| B | 6645 | 516 | 7.765237% |
| C | 6645 | 47 | 0.707299% |
| D | 6645 | 152 | 2.287434% |
Noise dominated data is calculated using 1-second bins in cleaned event files. If a bin has >2000 counts, and if more than 50% of those come from <1% of pixels, then it is considered to be noise-dominated and hence unusable.
| Quadrant | # 1 sec bins | Bins with >0 counts | Bins with >2000 counts | High rate bins dominated by noise | Noise dominated (total time) | Noise dominated (detector-on time) | Marked lightcurve |
|---|---|---|---|---|---|---|---|
| A | 7620 | 6646 | 1 | 1 | 0.01% | 0.02% | 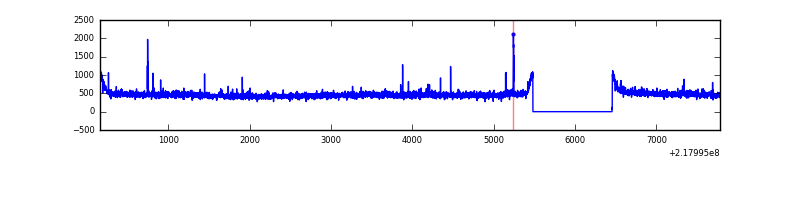 |
| B | 7620 | 6646 | 325 | 325 | 4.27% | 4.89% | 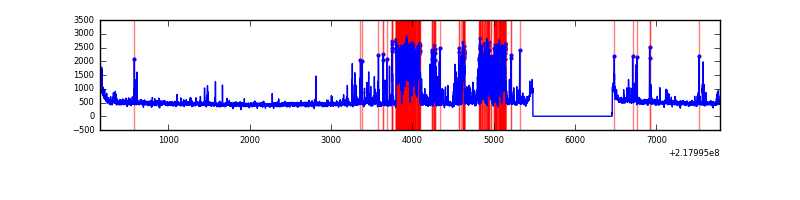 |
| C | 7620 | 6646 | 7 | 7 | 0.09% | 0.11% | 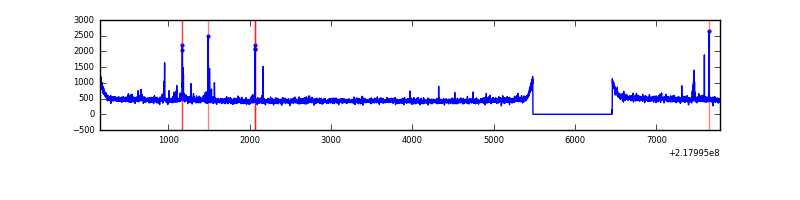 |
| D | 7620 | 6646 | 93 | 93 | 1.22% | 1.40% | 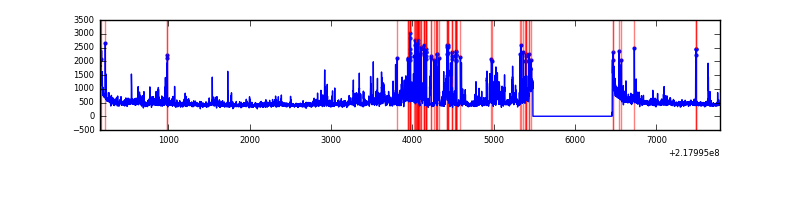 |
Top three noisy pixels from each quadrant. If the there are fewer than three noisy pixels in the level2.evt file, extra rows are filled as -1
| Pixel properties | Quadrant properties | ||||||
|---|---|---|---|---|---|---|---|
| Quadrant | DetID | PixID | Counts | Sigma | Mean | Median | Sigma |
| A | 8 | 15 | 84853 | 518.75 | 782 | 763 | 162.1 |
| A | 13 | 251 | 31003 | 186.55 | 782 | 763 | 162.1 |
| A | 12 | 194 | 7347 | 40.62 | 782 | 763 | 162.1 |
| B | 3 | 64 | 1335578 | 8889.73 | 773 | 756 | 150.2 |
| B | 4 | 81 | 22792 | 146.76 | 773 | 756 | 150.2 |
| B | 12 | 111 | 15305 | 96.89 | 773 | 756 | 150.2 |
| C | 4 | 254 | 81521 | 450.71 | 769 | 773 | 179.2 |
| C | 9 | 54 | 12973 | 68.1 | 769 | 773 | 179.2 |
| C | 13 | 61 | 6081 | 29.63 | 769 | 773 | 179.2 |
| D | 12 | 220 | 463533 | 2484.55 | 756 | 733 | 186.3 |
| D | 4 | 95 | 261350 | 1399.13 | 756 | 733 | 186.3 |
| D | 12 | 221 | 162058 | 866.08 | 756 | 733 | 186.3 |
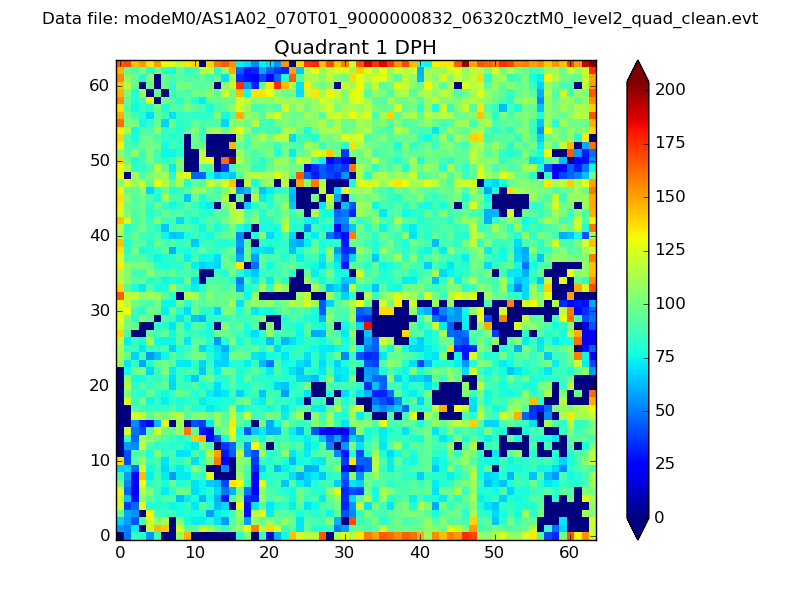
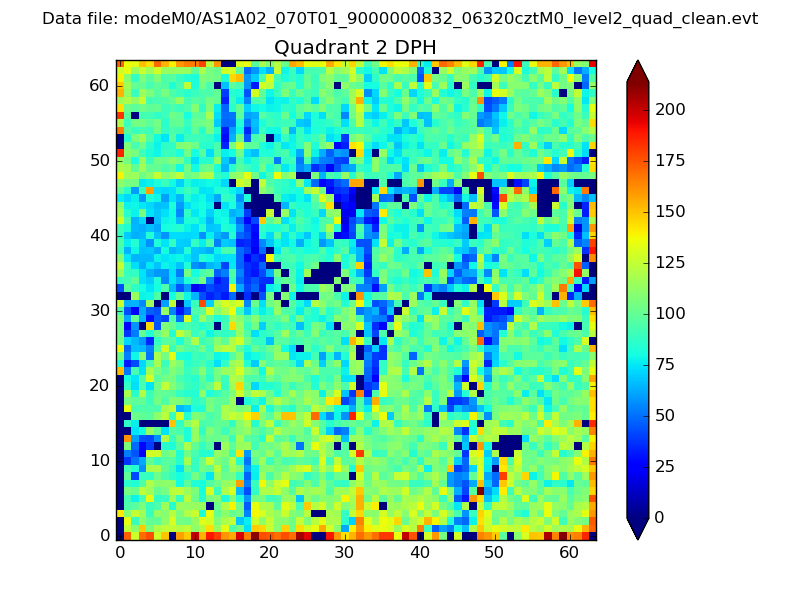
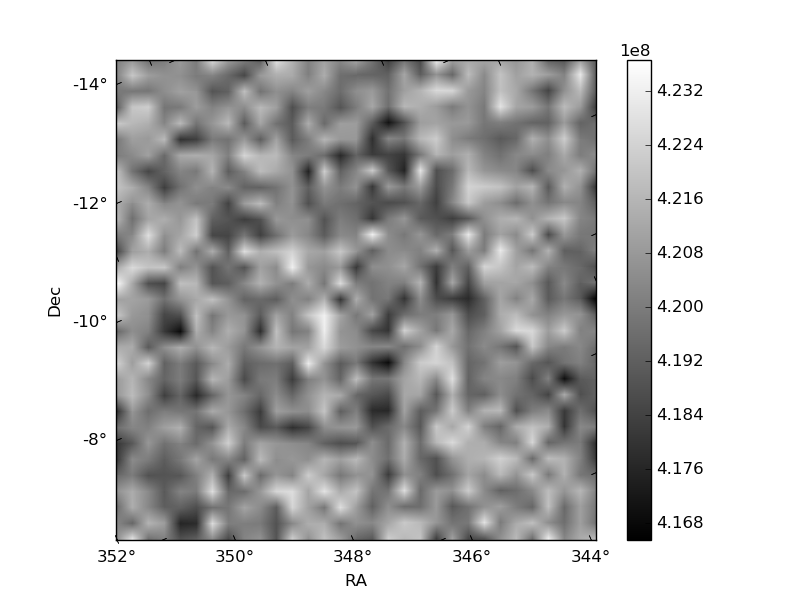
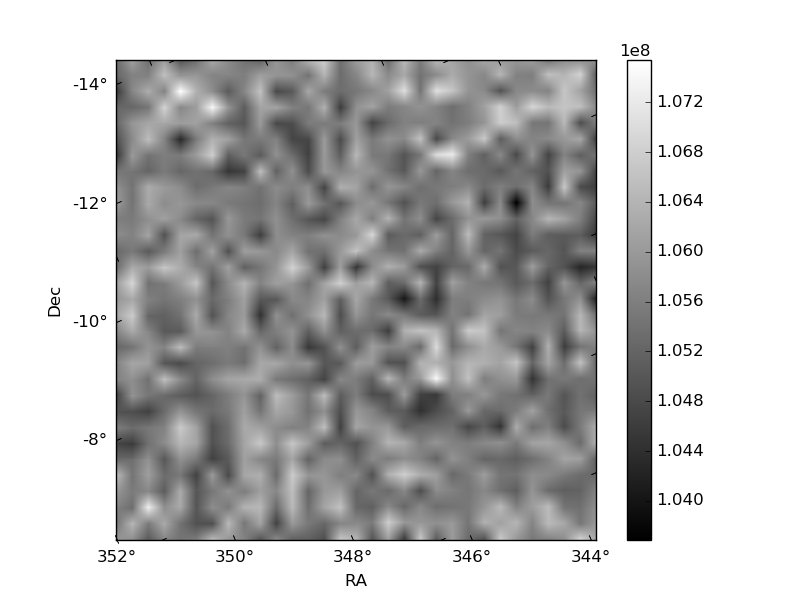
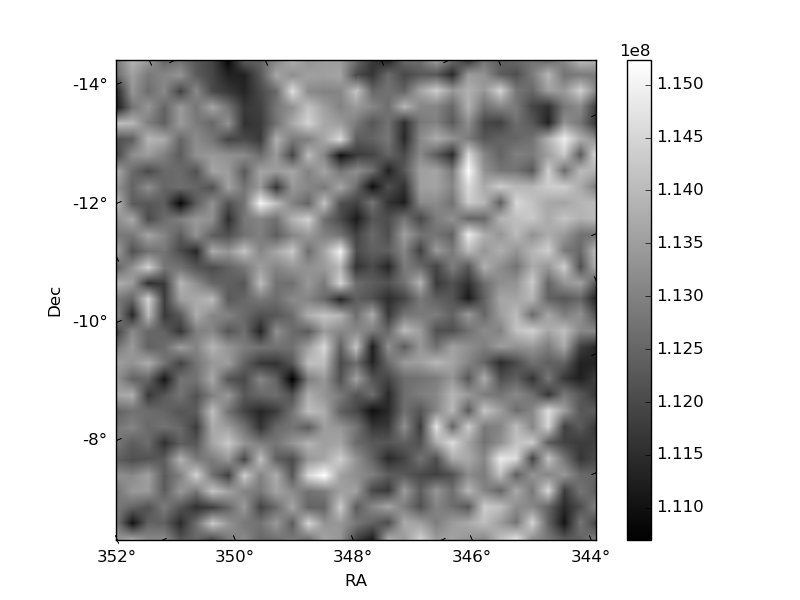
Histogram calculated using DETX and DETY for each event in the final _common_clean file
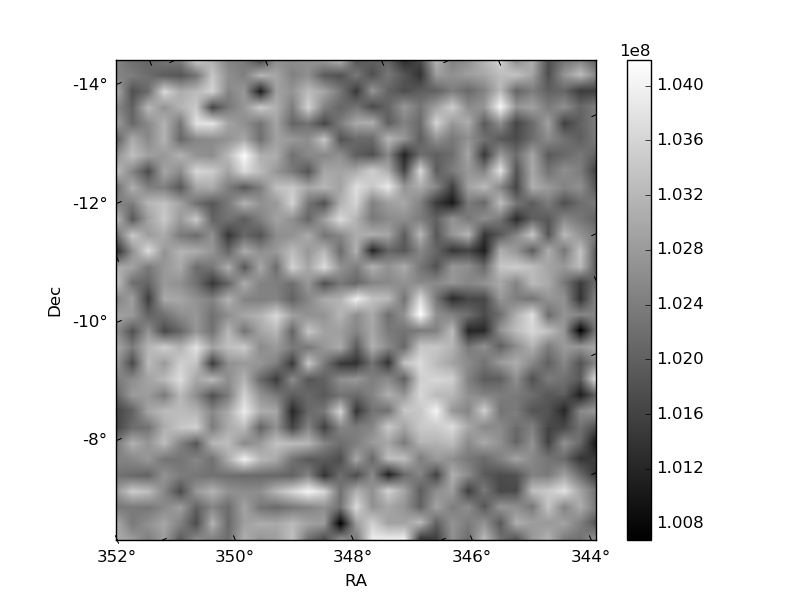
| Quadrant A |  |
 |
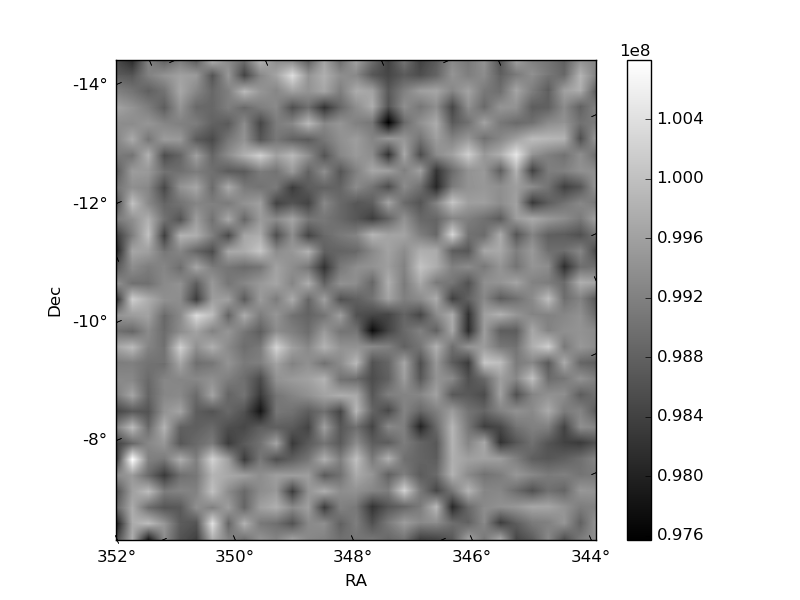
Quadrant B |
|---|---|---|---|
| Quadrant D | 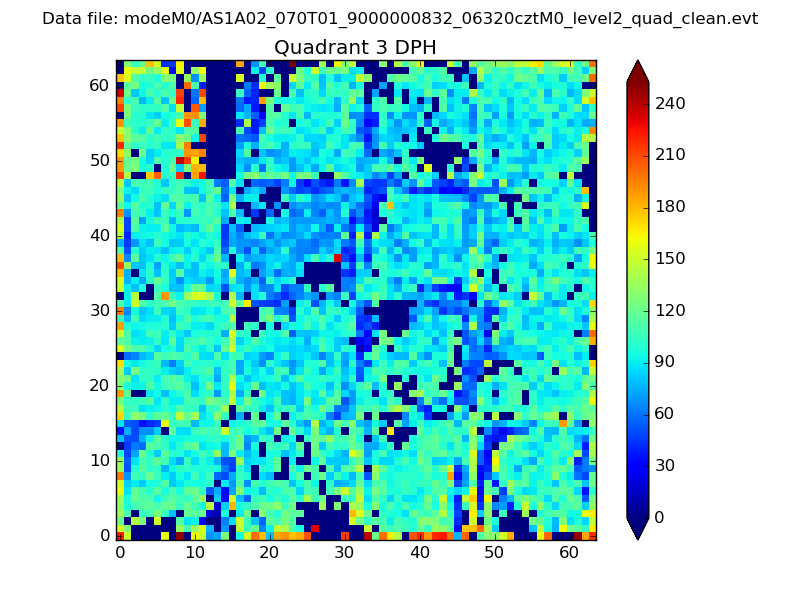 |
 |
Quadrant C |
| Plot type | Count rate plots | Images |
|---|---|---|
| Comparison with Poisson distribution Blue bars denote a histogram of data divided into 1 sec bins. Red curve is a Poisson curve with rate = median count rate of data. |
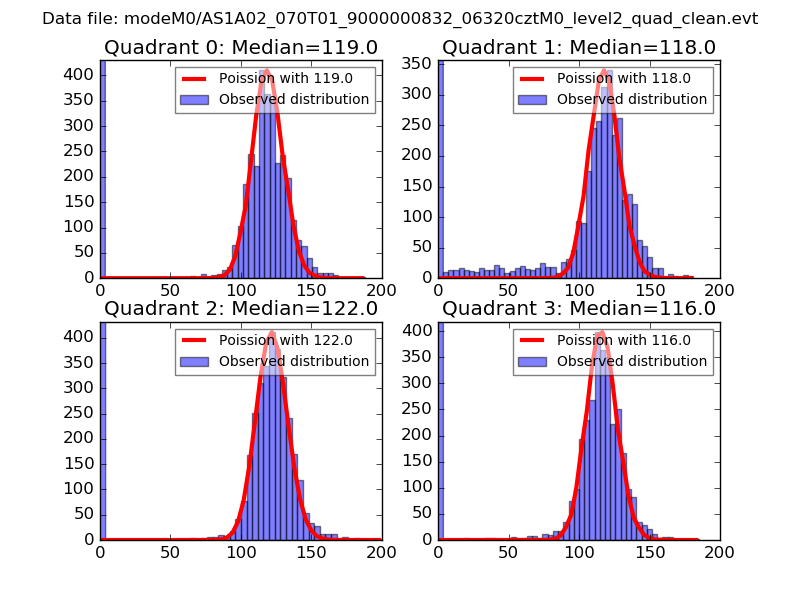 |
 |
| Quadrant-wise count rates Data is divided into 100 sec bins |
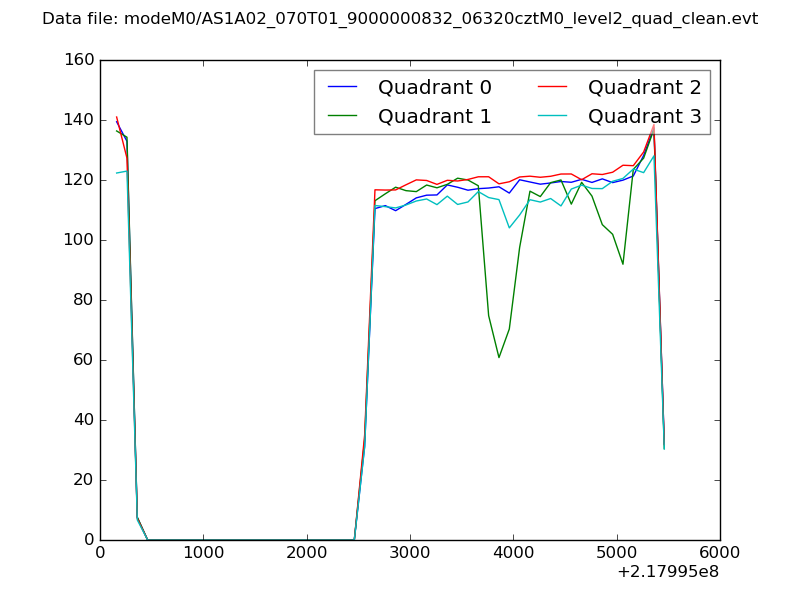 |
|
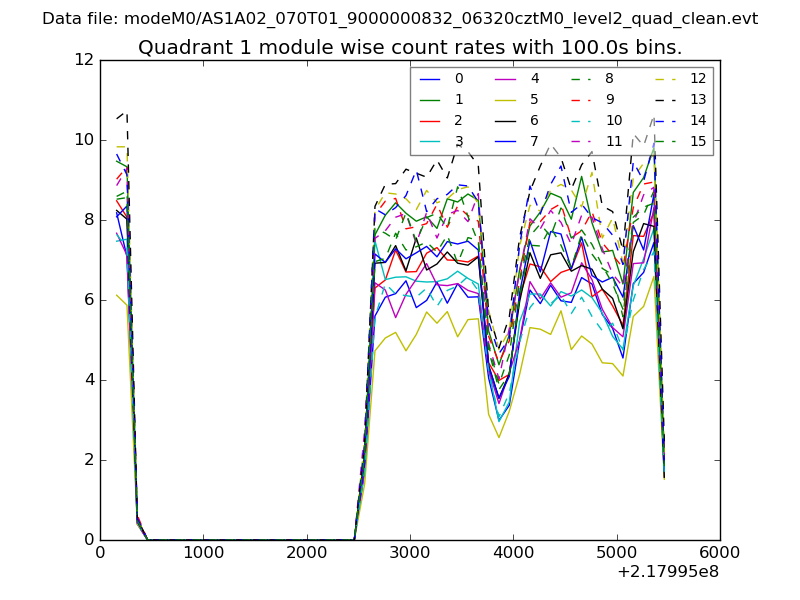
| Module-wise count rates for Quadrant A Data is divided into 100 sec bins |
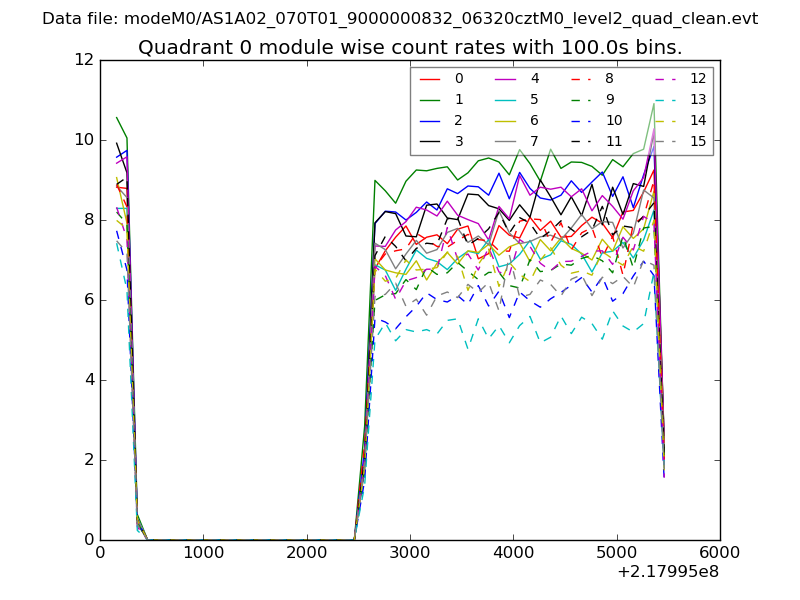 |
 |
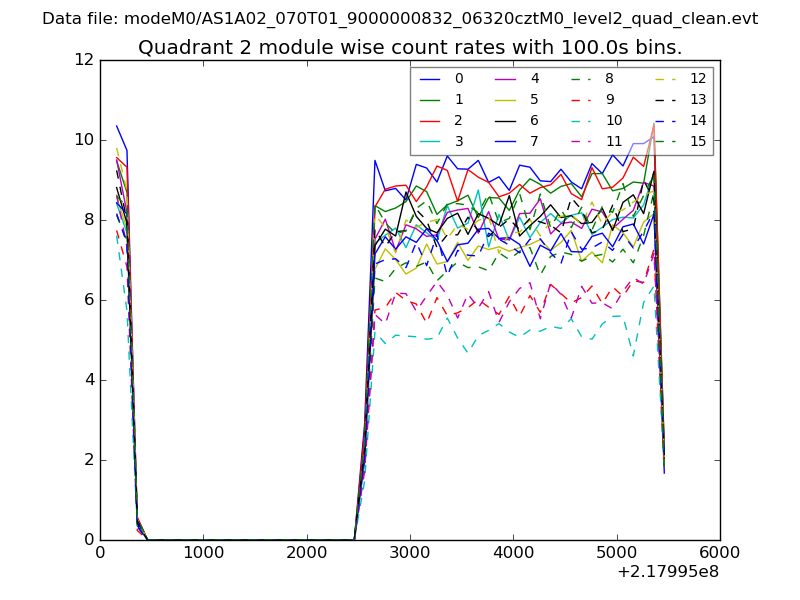
| Module-wise count rates for Quadrant B Data is divided into 100 sec bins |
 |
 |
| Module-wise count rates for Quadrant C Data is divided into 100 sec bins |
 |
 |
| Module-wise count rates for Quadrant D Data is divided into 100 sec bins |
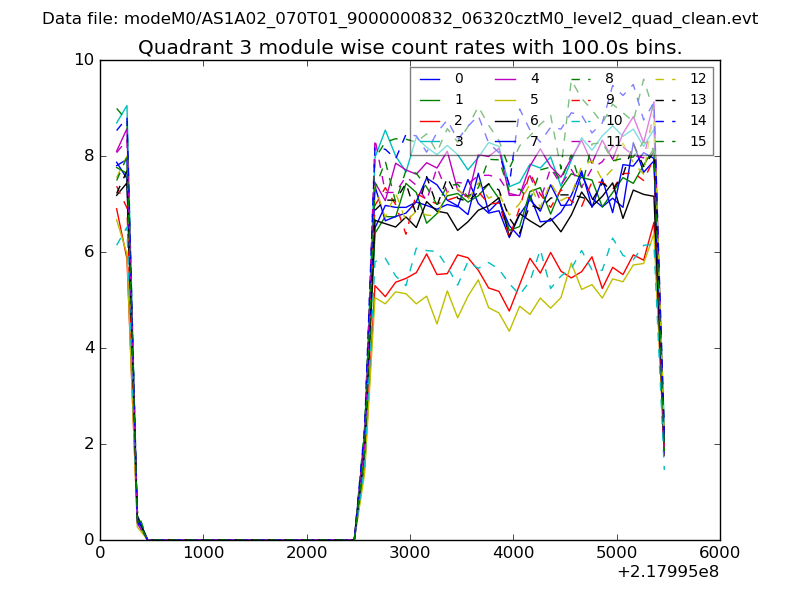 |
 |
| Parameter | Plot |
|---|---|
| CZT HV Monitor | 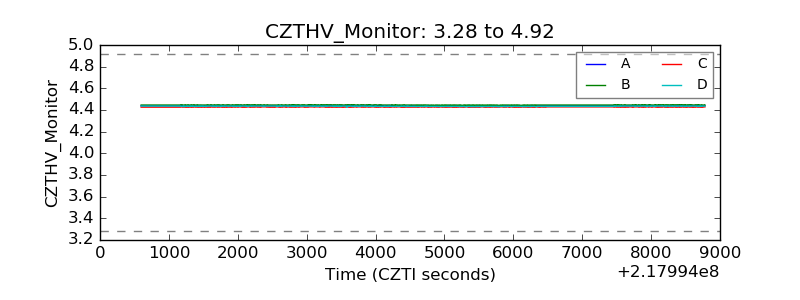 |
| D_VDD | 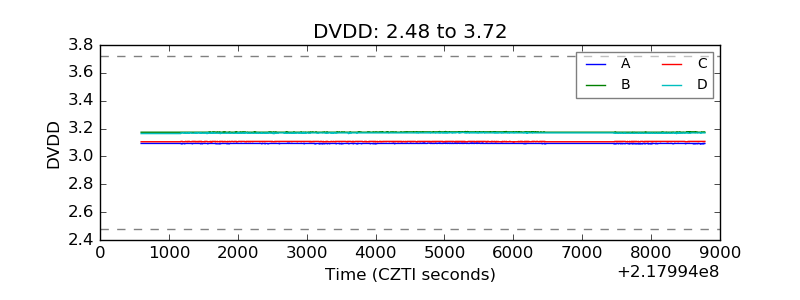 |
| Temperature 1 | 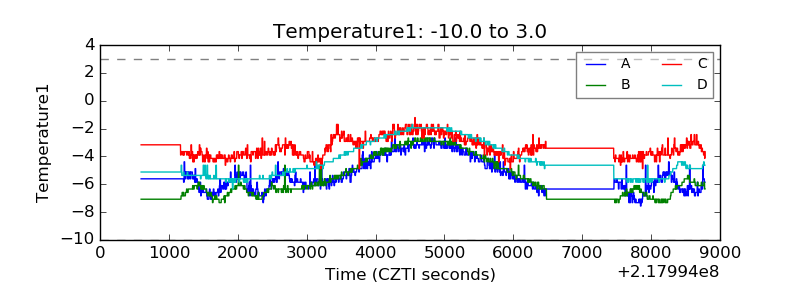 |
| Veto HV Monitor | 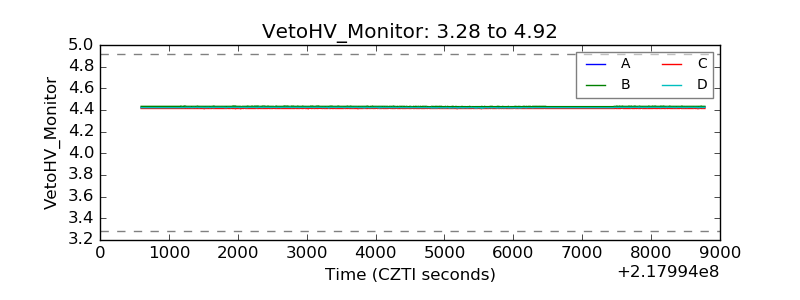 |
| Veto LLD | 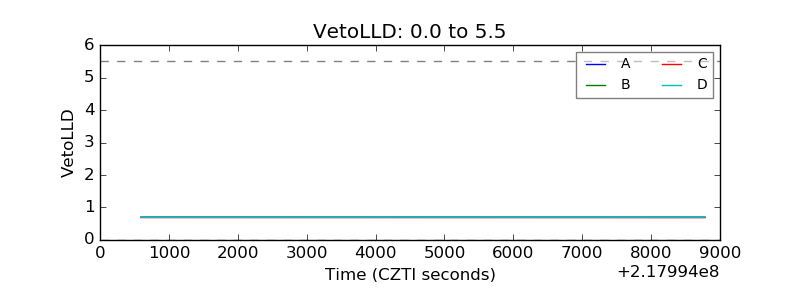 |
| Alpha Counter | 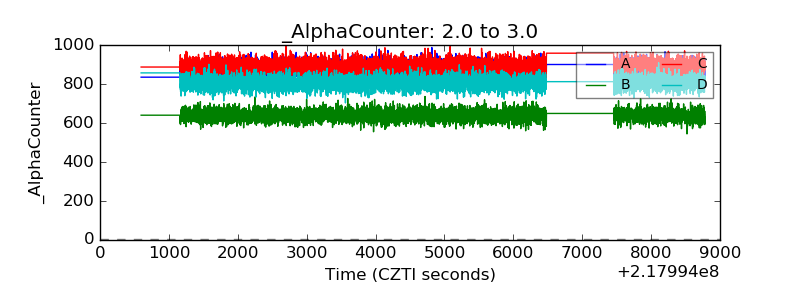 |
| _CPM_Rate | 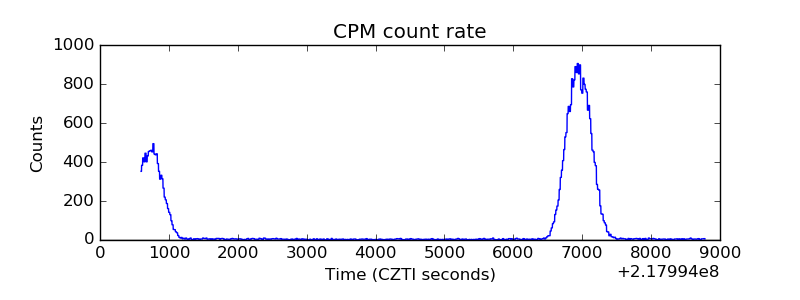 |
| CZT Counter | 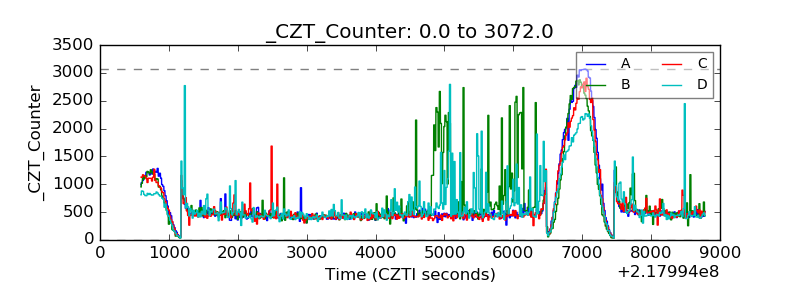 |
| +2.5 Volts monitor | 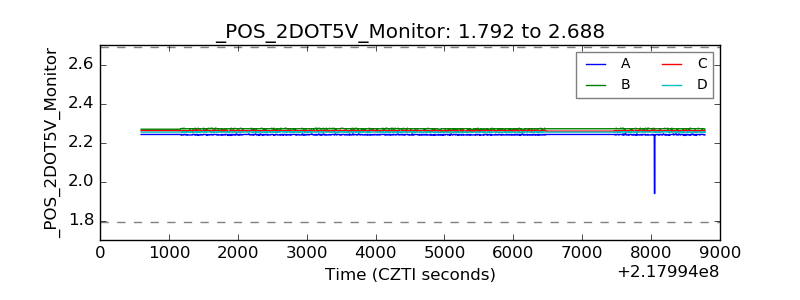 |
| +5 Volts monitor |  |
| _ROLL_ROT | 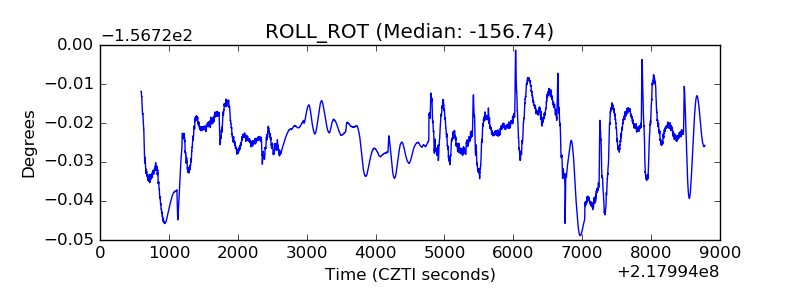 |
| _Roll_DEC | 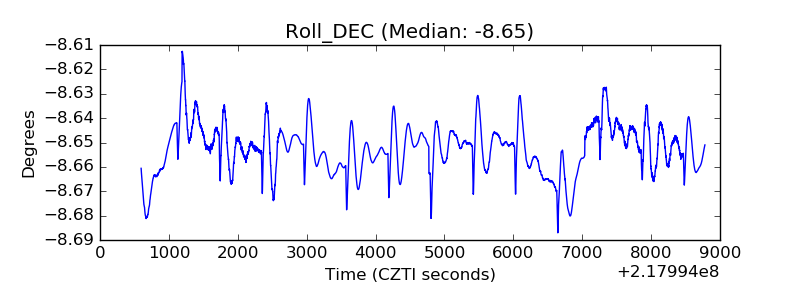 |
| _Roll_RA | 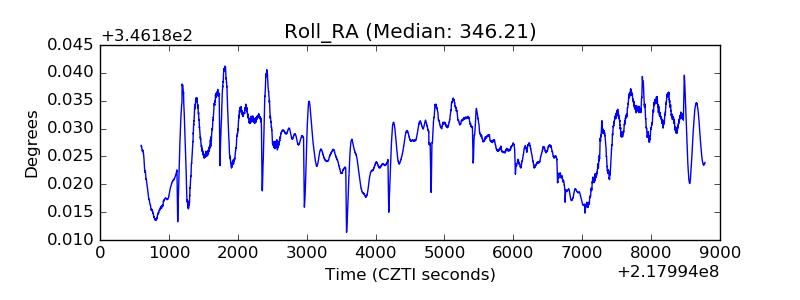 |
| Veto Counter | 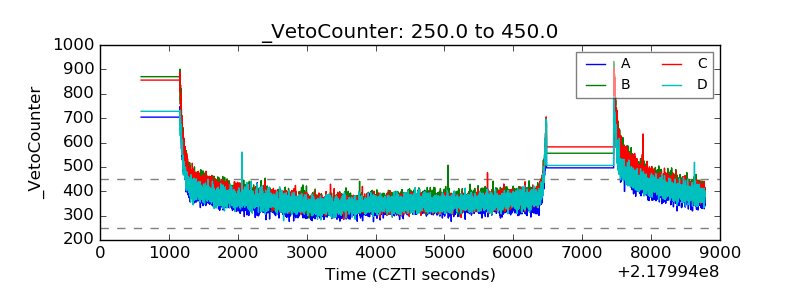 |