| Param | Original file | Final file |
|---|---|---|
| Filename | modeM0/AS1A02_070T01_9000000832_06322cztM0_level2.evt | modeM0/AS1A02_070T01_9000000832_06322cztM0_level2_quad_clean.evt |
| Size (bytes) | 480,507,840 | 65,462,400 |
| Size | 458.2 MB | 62.4 MB |
| Events in quadrant A | 3,313,766 | 378,359 |
| Events in quadrant B | 3,357,643 | 388,632 |
| Events in quadrant C | 3,311,192 | 385,069 |
| Events in quadrant D | 4,120,891 | 369,160 |
| Mode M9 | |||
|---|---|---|---|
| Quadrant | BADHDUFLAG | Total packets | Discarded packets |
| A | 0 | 16 | 0 |
| B | 0 | 16 | 0 |
| C | 0 | 16 | 0 |
| D | 0 | 17 | 0 |
| Mode SS | |||
|---|---|---|---|
| Quadrant | BADHDUFLAG | Total packets | Discarded packets |
| A | 0 | 134 | 0 |
| B | 0 | 134 | 0 |
| C | 0 | 134 | 0 |
| D | 0 | 134 | 0 |
| Mode M0 | |||
|---|---|---|---|
| Quadrant | BADHDUFLAG | Total packets | Discarded packets |
| A | 0 | 14194 | 3 |
| B | 0 | 14244 | 2 |
| C | 0 | 14267 | 2 |
| D | 0 | 16592 | 2 |
| Quadrant | Total seconds | Saturated seconds | Saturation percentage |
|---|---|---|---|
| A | 6607 | 73 | 1.104889% |
| B | 6607 | 123 | 1.861662% |
| C | 6607 | 78 | 1.180566% |
| D | 6607 | 187 | 2.830331% |
Noise dominated data is calculated using 1-second bins in cleaned event files. If a bin has >2000 counts, and if more than 50% of those come from <1% of pixels, then it is considered to be noise-dominated and hence unusable.
| Quadrant | # 1 sec bins | Bins with >0 counts | Bins with >2000 counts | High rate bins dominated by noise | Noise dominated (total time) | Noise dominated (detector-on time) | Marked lightcurve |
|---|---|---|---|---|---|---|---|
| A | 7702 | 6608 | 1 | 1 | 0.01% | 0.02% |  |
| B | 7702 | 6608 | 16 | 16 | 0.21% | 0.24% |  |
| C | 7702 | 6608 | 23 | 23 | 0.30% | 0.35% | 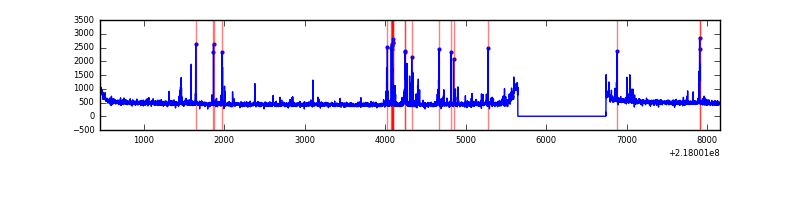 |
| D | 7702 | 6608 | 134 | 134 | 1.74% | 2.03% | 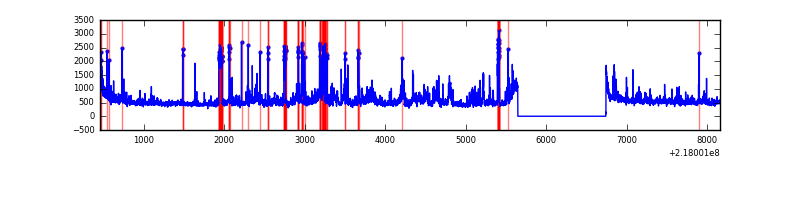 |
Top three noisy pixels from each quadrant. If the there are fewer than three noisy pixels in the level2.evt file, extra rows are filled as -1
| Pixel properties | Quadrant properties | ||||||
|---|---|---|---|---|---|---|---|
| Quadrant | DetID | PixID | Counts | Sigma | Mean | Median | Sigma |
| A | 8 | 15 | 200661 | 1213.3 | 803 | 785 | 164.7 |
| A | 13 | 251 | 16635 | 96.21 | 803 | 785 | 164.7 |
| A | 0 | 226 | 7547 | 41.05 | 803 | 785 | 164.7 |
| B | 3 | 64 | 181122 | 1150.4 | 816 | 797 | 156.8 |
| B | 12 | 111 | 15626 | 94.6 | 816 | 797 | 156.8 |
| B | 11 | 111 | 12322 | 73.52 | 816 | 797 | 156.8 |
| C | 4 | 254 | 247891 | 1361.09 | 784 | 787 | 181.5 |
| C | 13 | 61 | 6197 | 29.8 | 784 | 787 | 181.5 |
| C | 8 | 222 | 2437 | 9.09 | 784 | 787 | 181.5 |
| D | 12 | 220 | 527607 | 2752.21 | 778 | 755 | 191.4 |
| D | 12 | 221 | 313356 | 1632.99 | 778 | 755 | 191.4 |
| D | 11 | 241 | 115457 | 599.19 | 778 | 755 | 191.4 |
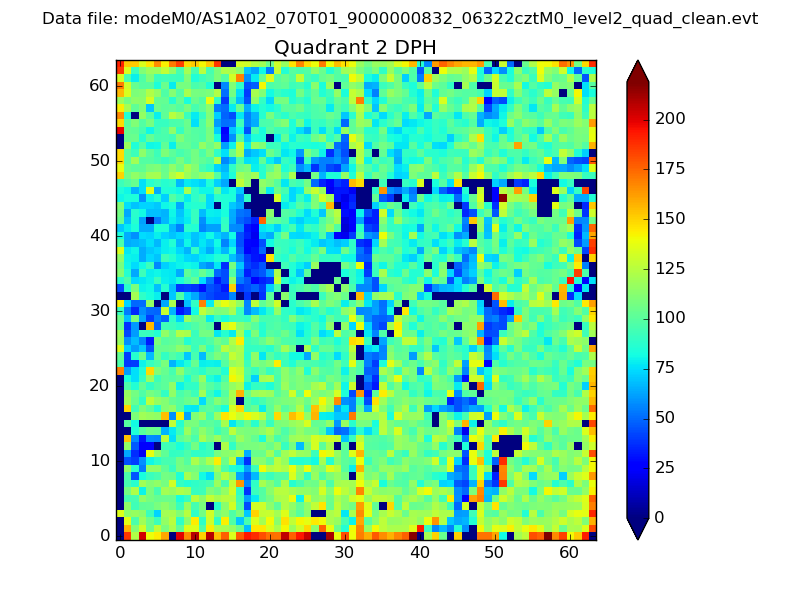
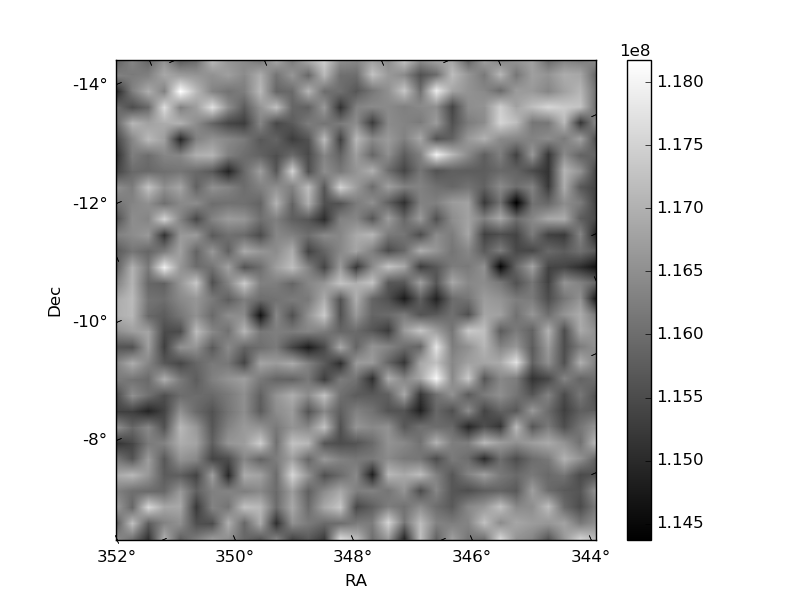
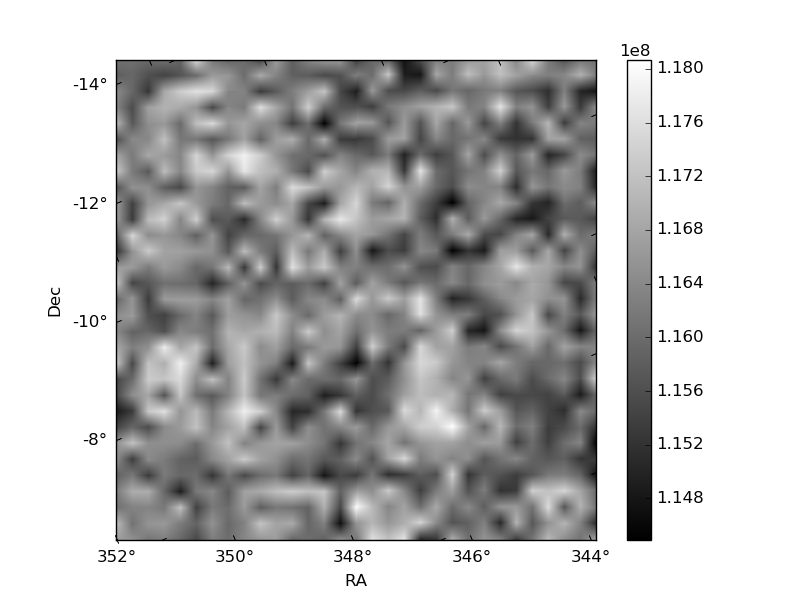
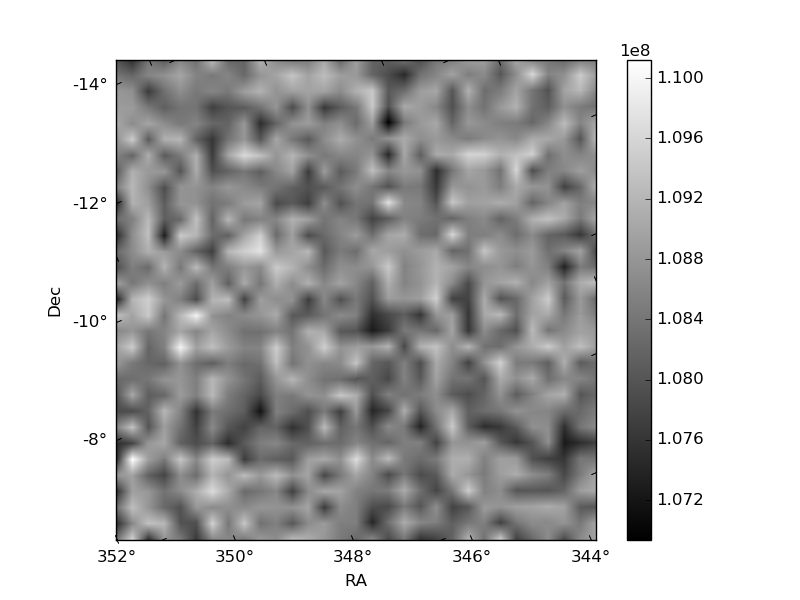
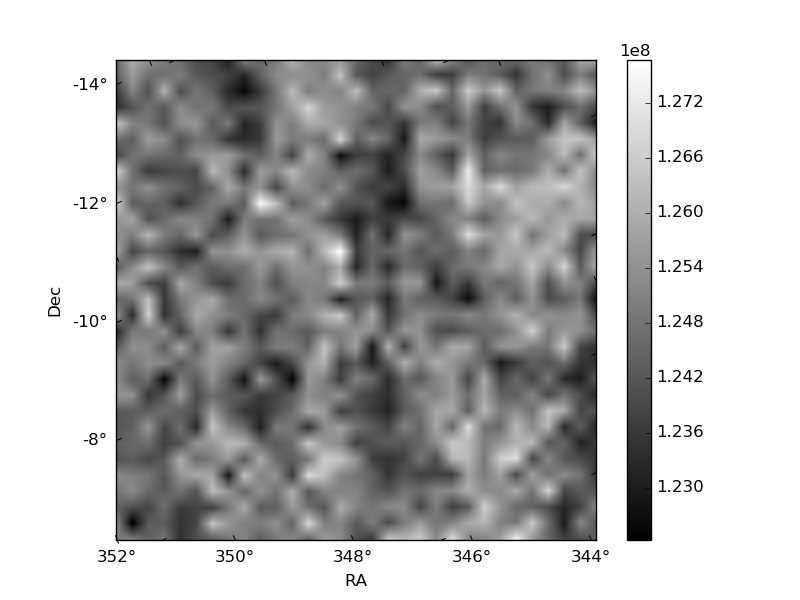
Histogram calculated using DETX and DETY for each event in the final _common_clean file
| Quadrant A | 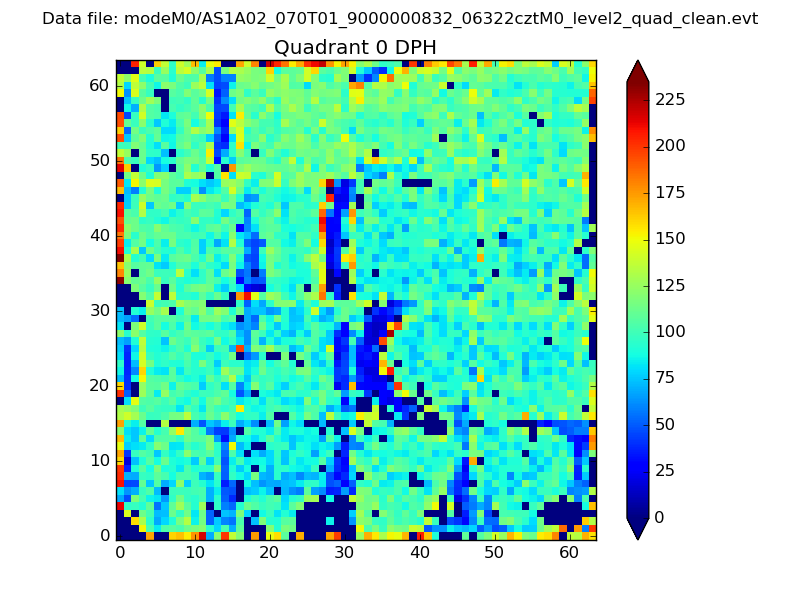 |
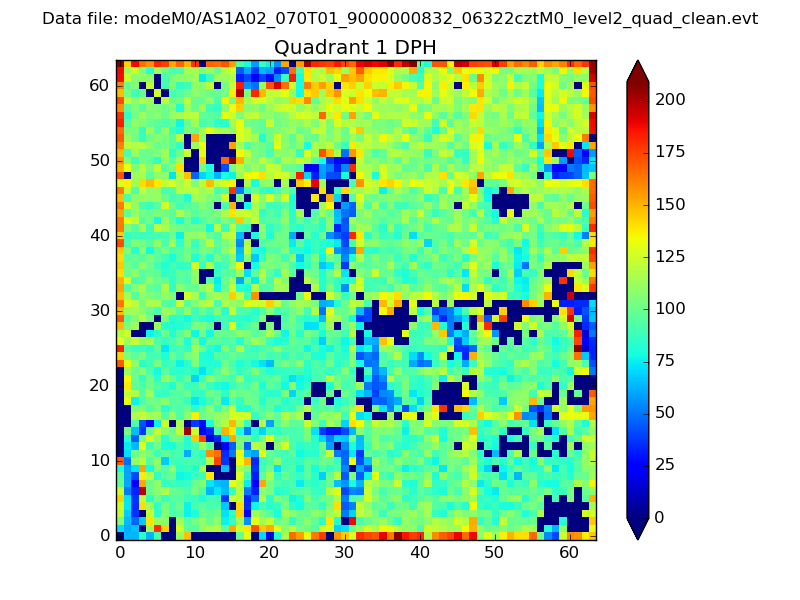 |
Quadrant B |
|---|---|---|---|
| Quadrant D | 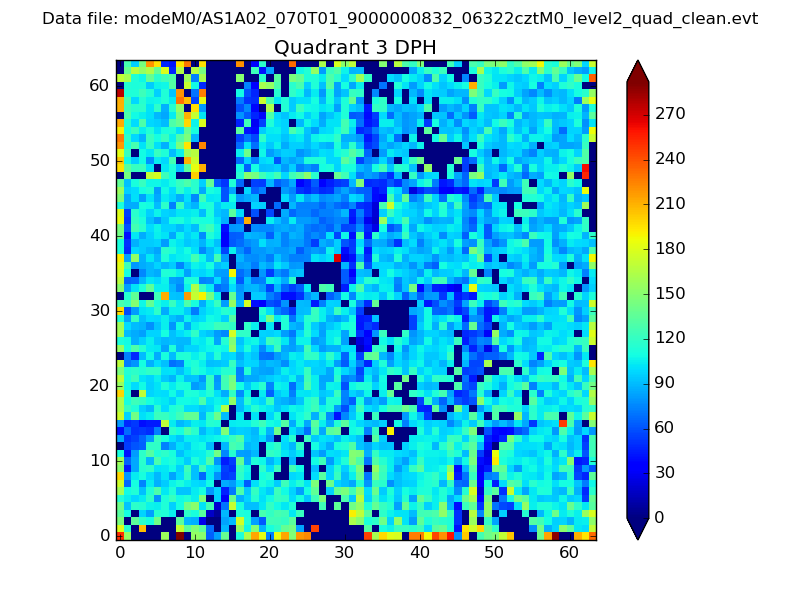 |
 |
Quadrant C |
| Plot type | Count rate plots | Images |
|---|---|---|
| Comparison with Poisson distribution Blue bars denote a histogram of data divided into 1 sec bins. Red curve is a Poisson curve with rate = median count rate of data. |
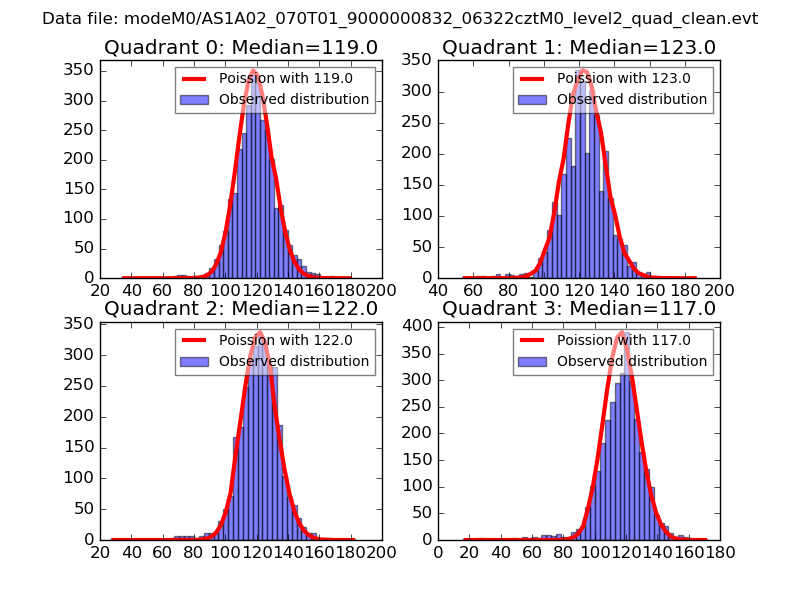 |
 |
| Quadrant-wise count rates Data is divided into 100 sec bins |
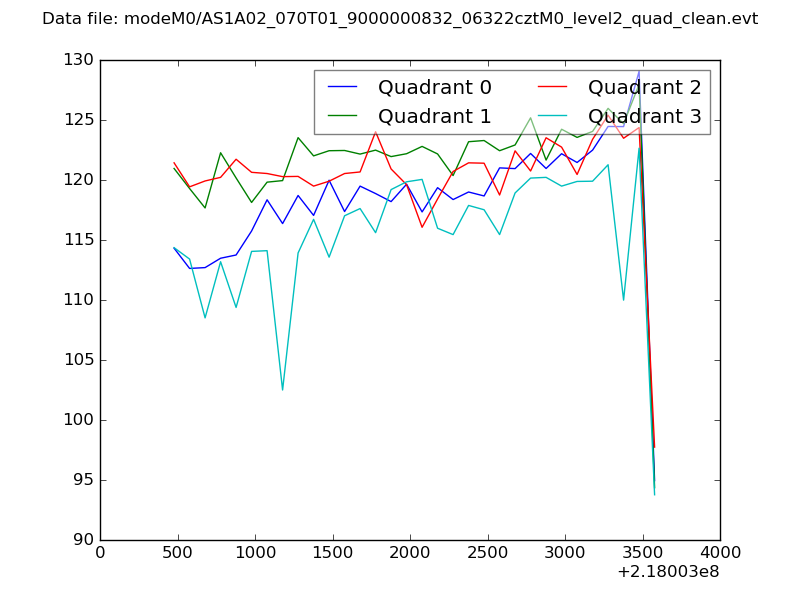 |
|
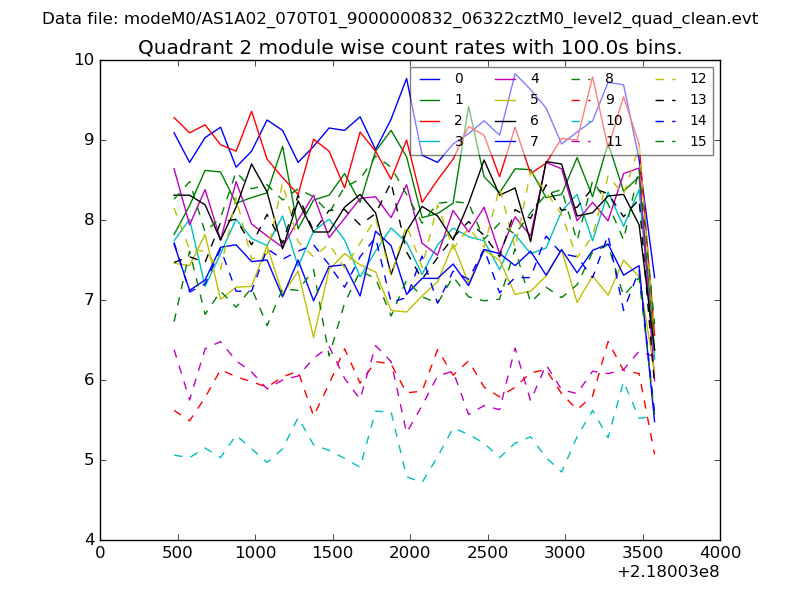
| Module-wise count rates for Quadrant A Data is divided into 100 sec bins |
 |
 |
| Module-wise count rates for Quadrant B Data is divided into 100 sec bins |
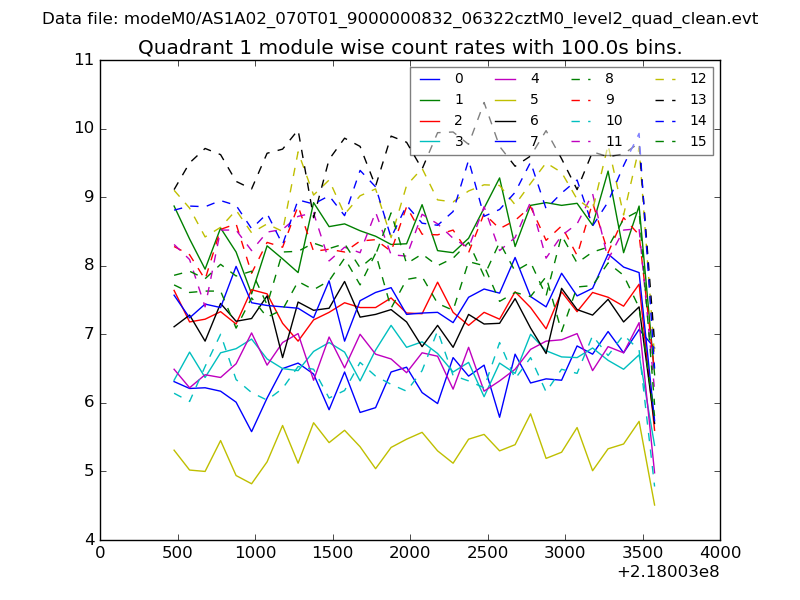 |
 |
| Module-wise count rates for Quadrant C Data is divided into 100 sec bins |
 |
 |
| Module-wise count rates for Quadrant D Data is divided into 100 sec bins |
 |
 |
| Parameter | Plot |
|---|---|
| CZT HV Monitor | 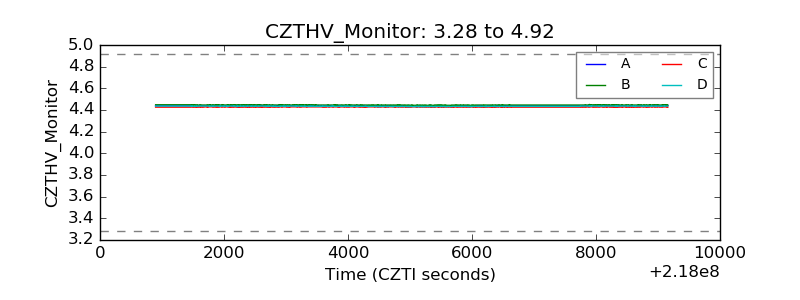 |
| D_VDD | 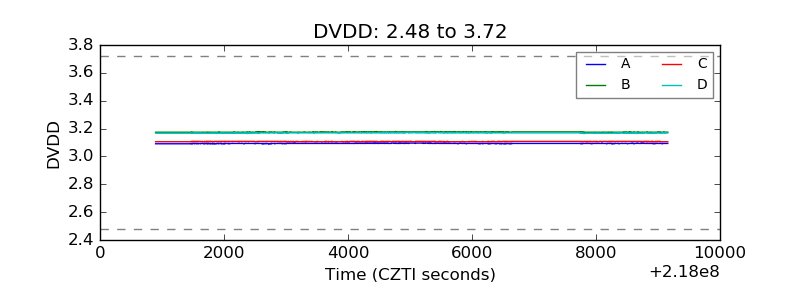 |
| Temperature 1 | 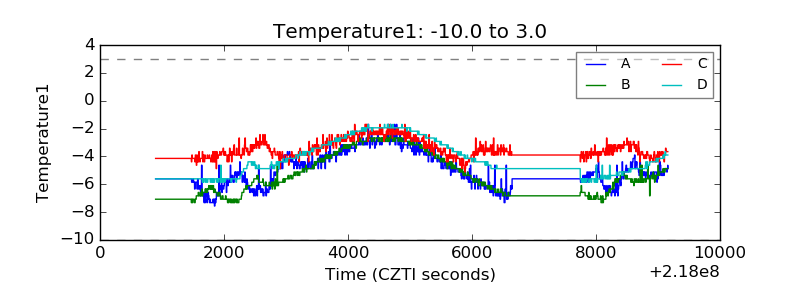 |
| Veto HV Monitor | 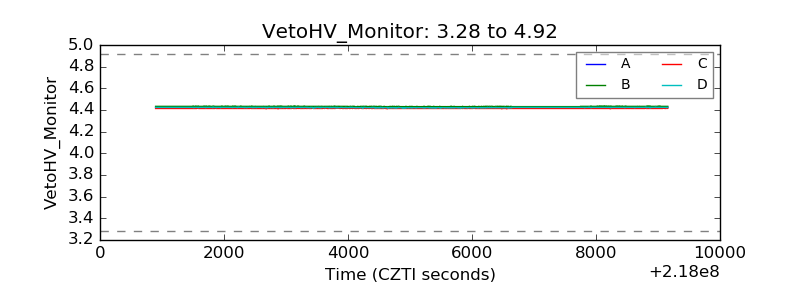 |
| Veto LLD | 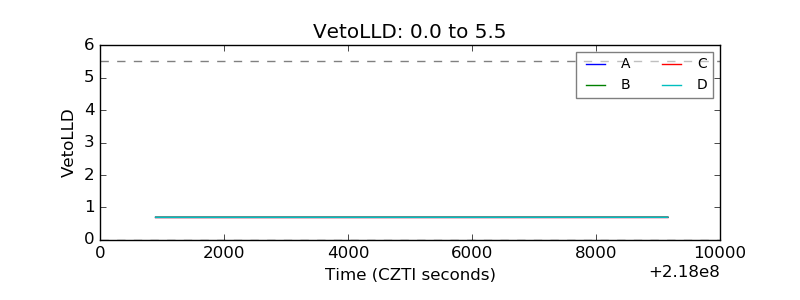 |
| Alpha Counter | 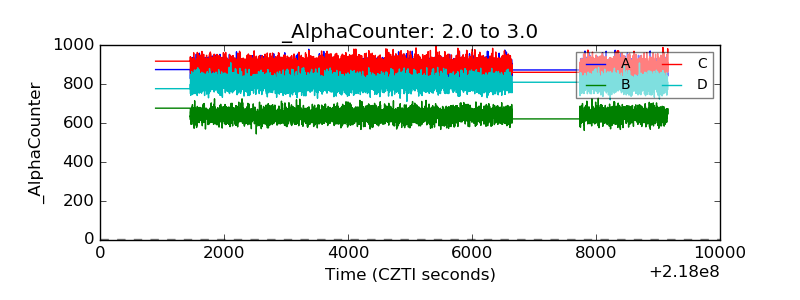 |
| _CPM_Rate | 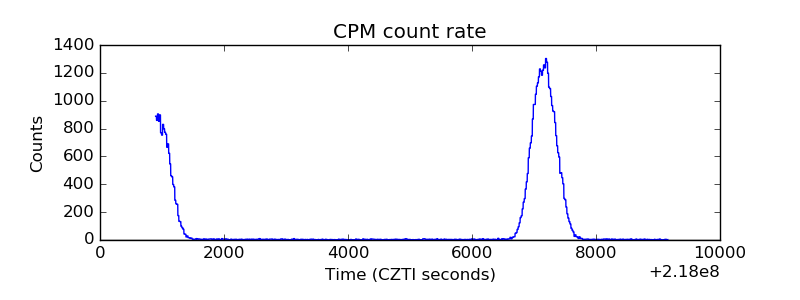 |
| CZT Counter | 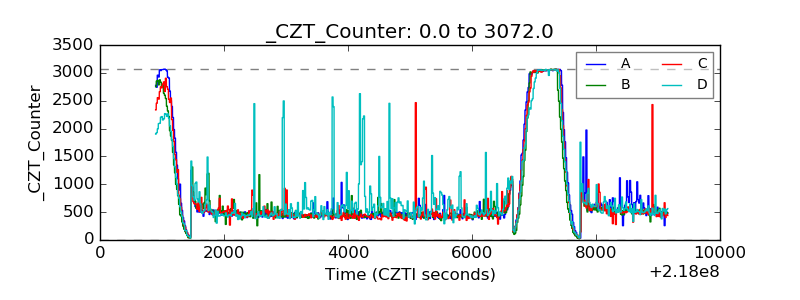 |
| +2.5 Volts monitor |  |
| +5 Volts monitor |  |
| _ROLL_ROT |  |
| _Roll_DEC | 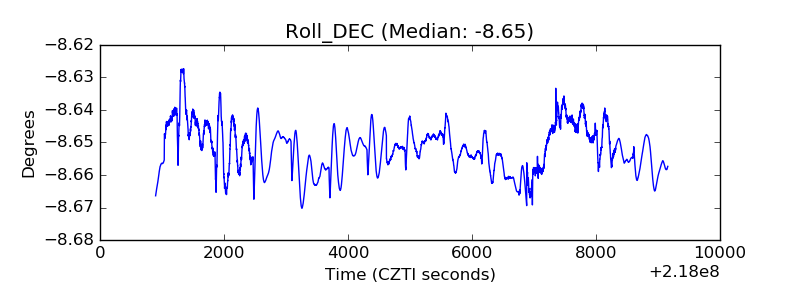 |
| _Roll_RA | 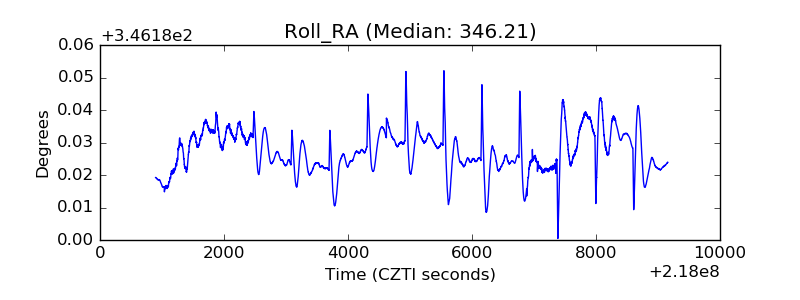 |
| Veto Counter | 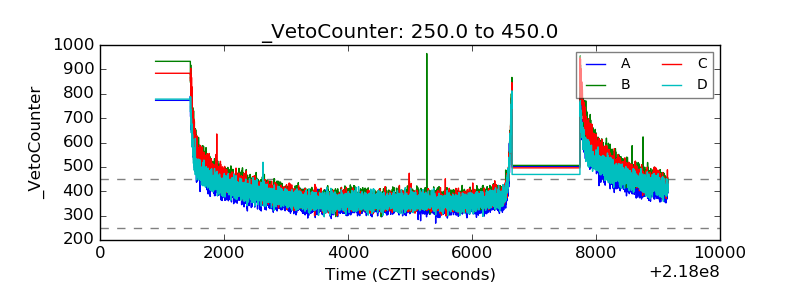 |