| Param | Original file | Final file |
|---|---|---|
| Filename | modeM0/AS1G06_168T25_9000000830cztM0_level2.fits | modeM0/AS1G06_168T25_9000000830cztM0_level2_quad_clean.evt |
| Size (bytes) | 78,831,360 | 56,442,240 |
| Size | 75.2 MB | 53.8 MB |
| Events in quadrant A | 480,724 | 320,900 |
| Events in quadrant B | 463,498 | 318,557 |
| Events in quadrant C | 479,836 | 316,388 |
| Events in quadrant D | 337,534 | 127,778 |
| Mode SS | |||
|---|---|---|---|
| Quadrant | BADHDUFLAG | Total packets | Discarded packets |
| A | 0 | 184 | 0 |
| B | 0 | 184 | 0 |
| C | 0 | 184 | 0 |
| D | 0 | 184 | 0 |
| Mode M9 | |||
|---|---|---|---|
| Quadrant | BADHDUFLAG | Total packets | Discarded packets |
| A | 0 | 7 | 0 |
| B | 0 | 7 | 0 |
| C | 0 | 7 | 0 |
| D | 0 | 7 | 0 |
| Mode M0 | |||
|---|---|---|---|
| Quadrant | BADHDUFLAG | Total packets | Discarded packets |
| A | 0 | 21557 | 0 |
| B | 0 | 21722 | 0 |
| C | 0 | 18329 | 0 |
| D | 0 | 46758 | 0 |
| Quadrant | Total seconds | Saturated seconds | Saturation percentage |
|---|---|---|---|
| A | 8997 | 150 | 1.667222% |
| B | 8997 | 323 | 3.590086% |
| C | 8997 | 19 | 0.211182% |
| D | 8997 | 3101 | 34.467045% |
Noise dominated data is calculated using 1-second bins in cleaned event files. If a bin has >2000 counts, and if more than 50% of those come from <1% of pixels, then it is considered to be noise-dominated and hence unusable.
| Quadrant | # 1 sec bins | Bins with >0 counts | Bins with >2000 counts | High rate bins dominated by noise | Noise dominated (total time) | Noise dominated (detector-on time) | Marked lightcurve |
|---|---|---|---|---|---|---|---|
| A | 9682 | 8996 | 0 | 0 | 0.00% | 0.00% | 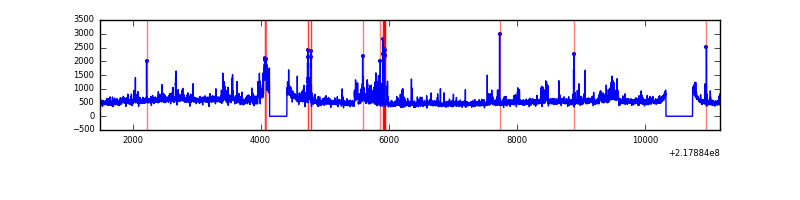 |
| B | 9681 | 8993 | 0 | 0 | 0.00% | 0.00% | 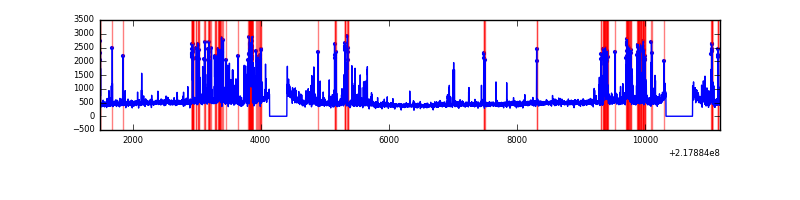 |
| C | 9682 | 8996 | 0 | 0 | 0.00% | 0.00% | 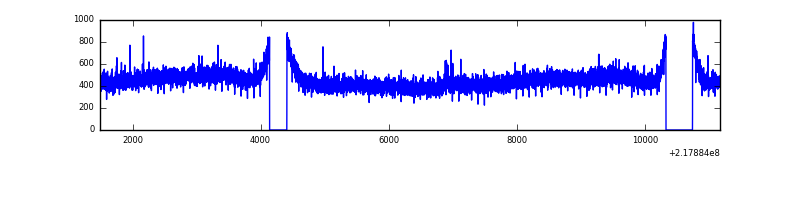 |
| D | 9681 | 8985 | 0 | 0 | 0.00% | 0.00% |  |
Top three noisy pixels from each quadrant. If the there are fewer than three noisy pixels in the level2.evt file, extra rows are filled as -1
| Pixel properties | Quadrant properties | ||||||
|---|---|---|---|---|---|---|---|
| Quadrant | DetID | PixID | Counts | Sigma | Mean | Median | Sigma |
| A | 0 | 29 | 443 | 9.49 | 125 | 116 | 34.5 |
| A | 7 | 110 | 400 | 8.24 | 125 | 116 | 34.5 |
| A | 0 | 30 | 361 | 7.11 | 125 | 116 | 34.5 |
| B | 2 | 9 | 443 | 11.76 | 122 | 115 | 27.9 |
| B | 12 | 226 | 336 | 7.93 | 122 | 115 | 27.9 |
| B | 2 | 8 | 333 | 7.82 | 122 | 115 | 27.9 |
| C | 1 | 80 | 355 | 6.67 | 126 | 116 | 35.9 |
| C | 9 | 188 | 348 | 6.47 | 126 | 116 | 35.9 |
| C | 9 | 242 | 329 | 5.94 | 126 | 116 | 35.9 |
| D | 3 | 14 | 275 | 6.77 | 96 | 87 | 27.8 |
| D | 11 | 82 | 259 | 6.19 | 96 | 87 | 27.8 |
| D | 7 | 5 | 253 | 5.97 | 96 | 87 | 27.8 |
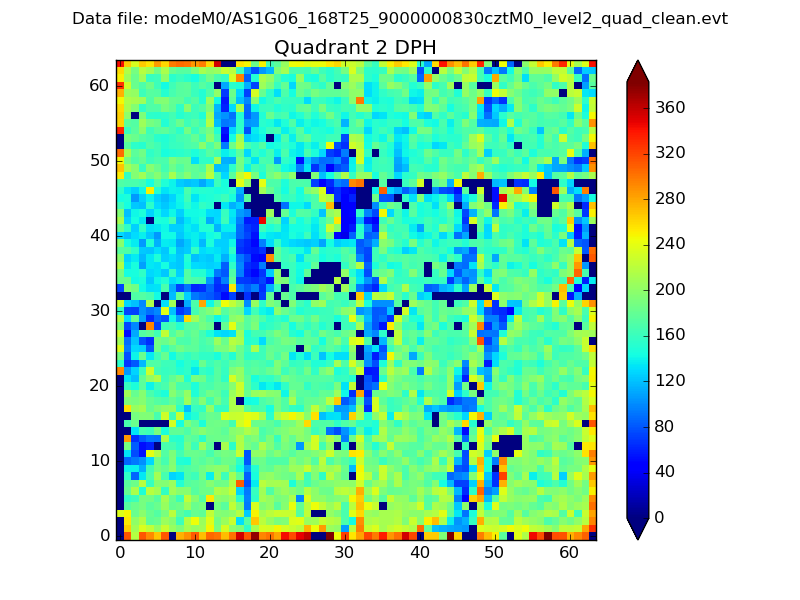
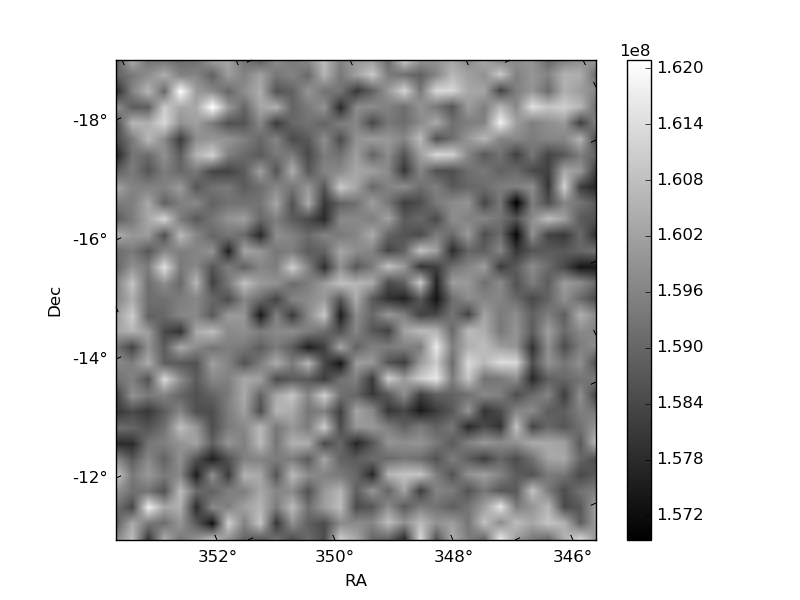
Histogram calculated using DETX and DETY for each event in the final _common_clean file
| Quadrant A | 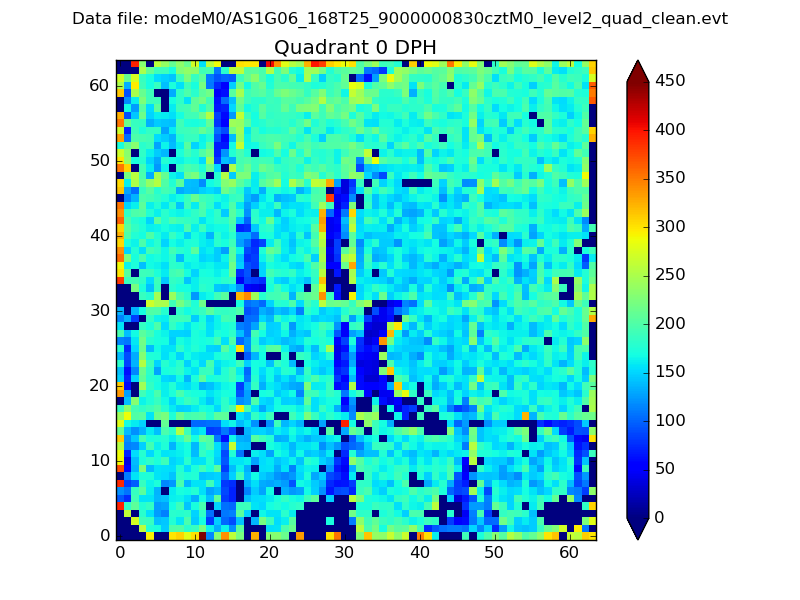 |
 |
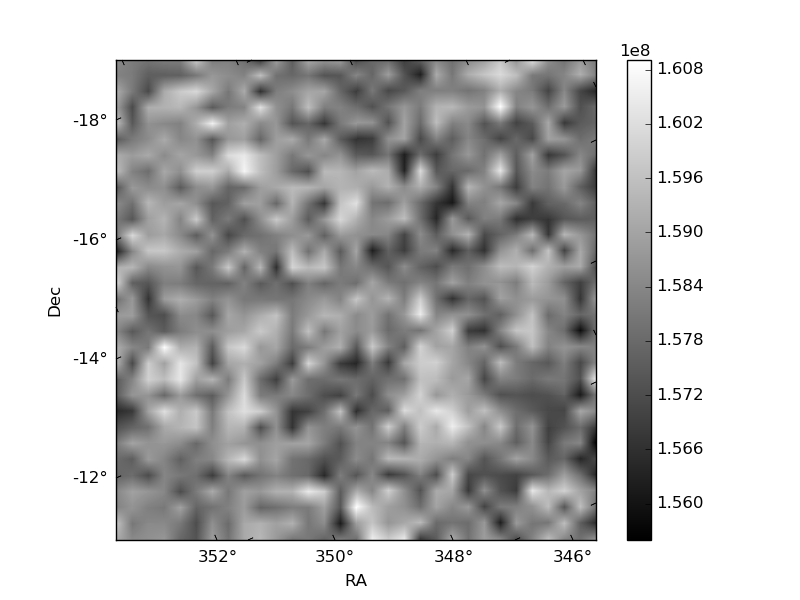
Quadrant B |
|---|---|---|---|
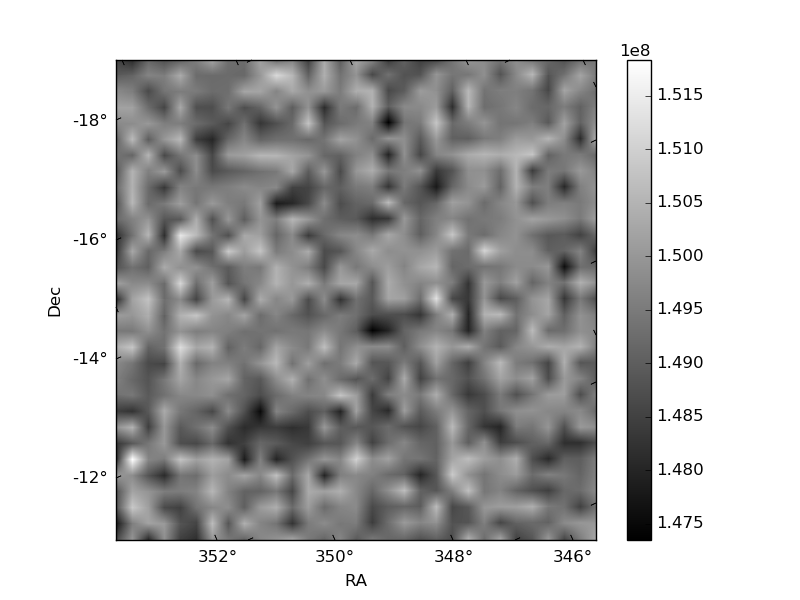
| Quadrant D | 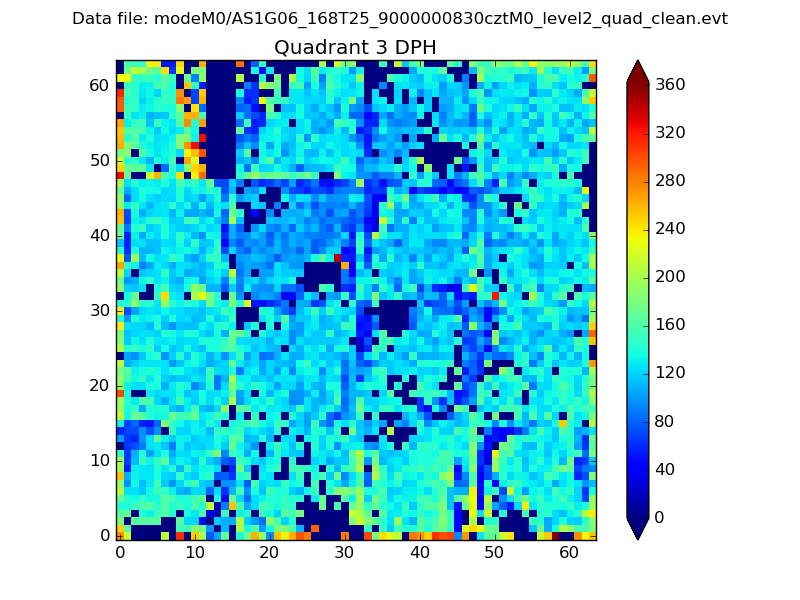 |
 |
Quadrant C |
| Plot type | Count rate plots | Images |
|---|---|---|
| Comparison with Poisson distribution Blue bars denote a histogram of data divided into 1 sec bins. Red curve is a Poisson curve with rate = median count rate of data. |
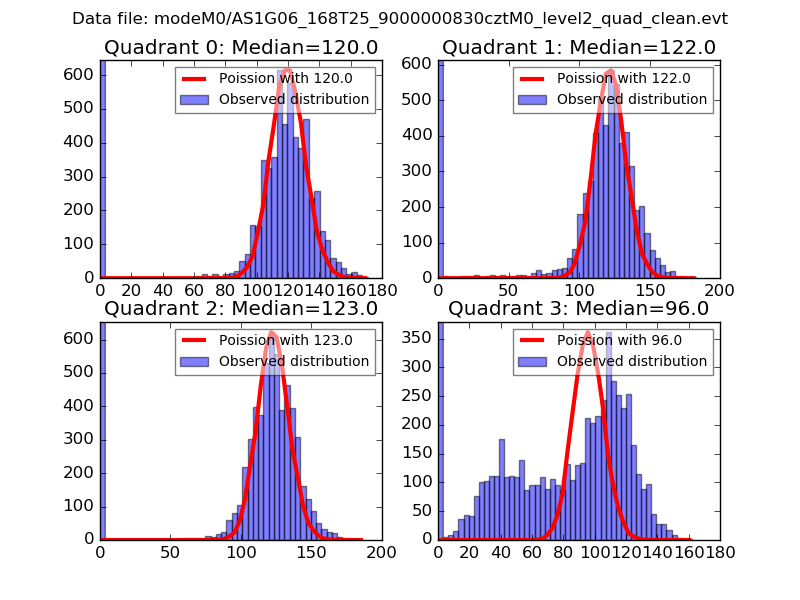 |
 |
| Quadrant-wise count rates Data is divided into 100 sec bins |
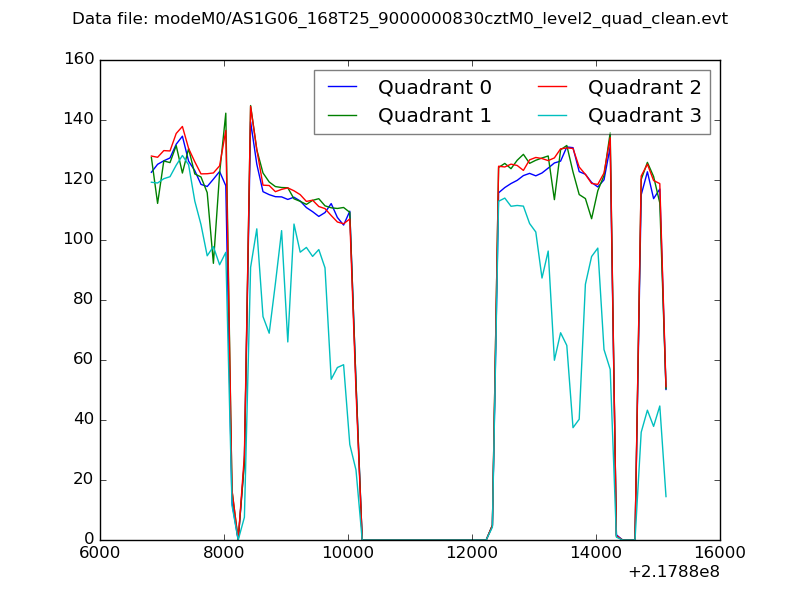 |
|
| Module-wise count rates for Quadrant A Data is divided into 100 sec bins |
 |
 |
| Module-wise count rates for Quadrant B Data is divided into 100 sec bins |
 |
 |
| Module-wise count rates for Quadrant C Data is divided into 100 sec bins |
 |
 |
| Module-wise count rates for Quadrant D Data is divided into 100 sec bins |
 |
 |
| Parameter | Plot |
|---|---|
| CZT HV Monitor |  |
| D_VDD | 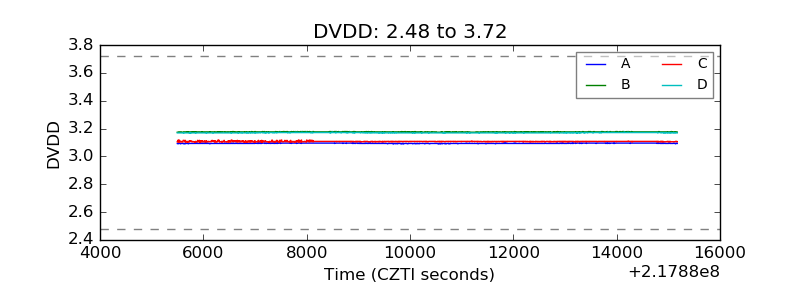 |
| Temperature 1 |  |
| Veto HV Monitor |  |
| Veto LLD | 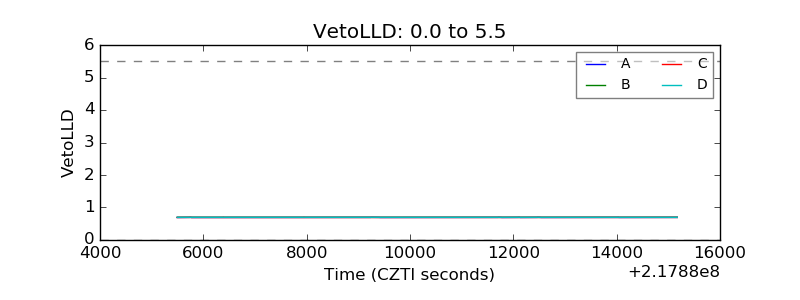 |
| Alpha Counter | 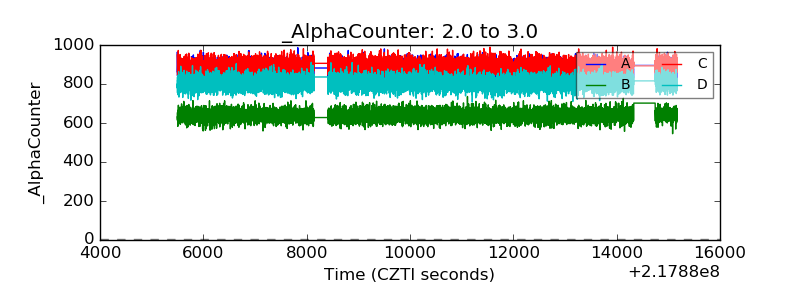 |
| _CPM_Rate | 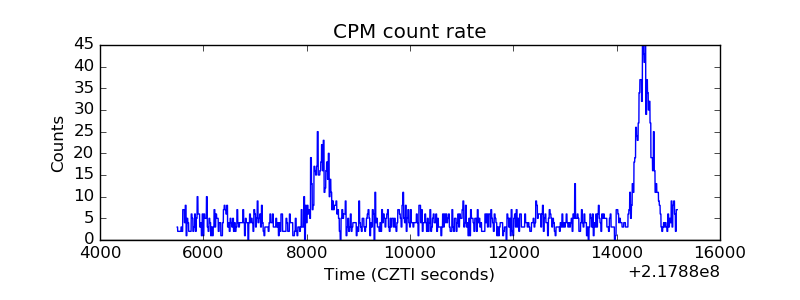 |
| CZT Counter | 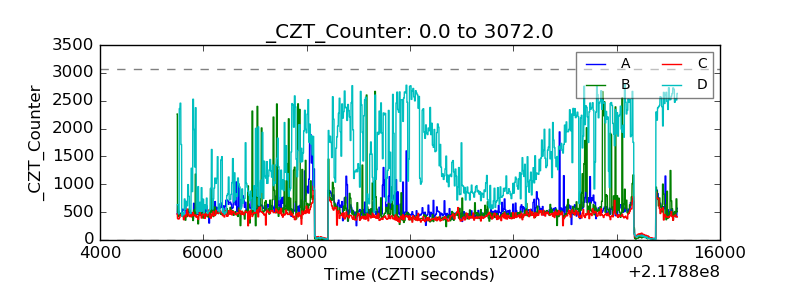 |
| +2.5 Volts monitor |  |
| +5 Volts monitor |  |
| _ROLL_ROT |  |
| _Roll_DEC | 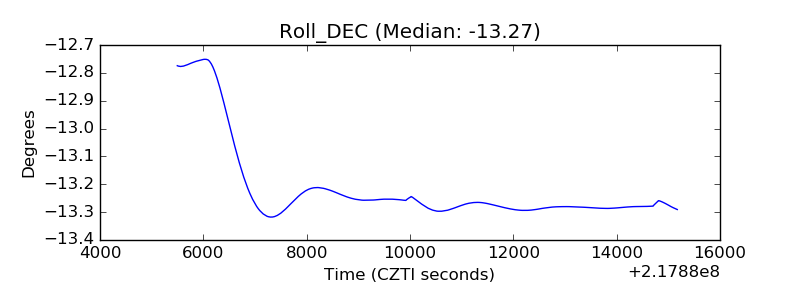 |
| _Roll_RA | 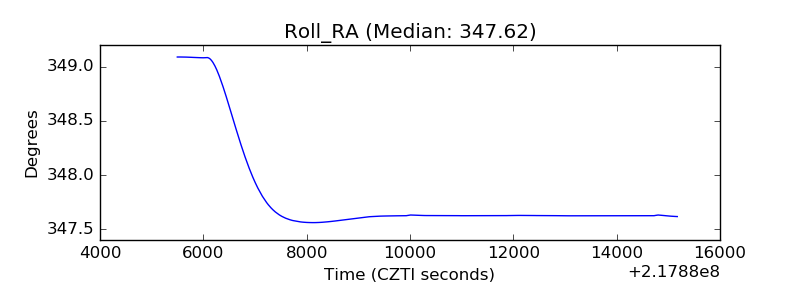 |
| Veto Counter | 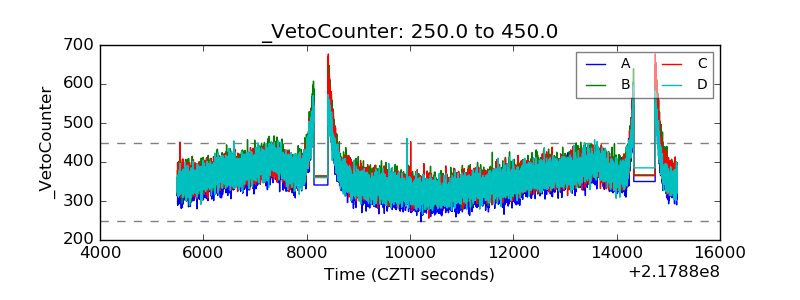 |