| Param | Original file | Final file |
|---|---|---|
| Filename | modeM0/AS1G06_168T25_9000000830_06301cztM0_level2.evt | modeM0/AS1G06_168T25_9000000830_06301cztM0_level2_quad_clean.evt |
| Size (bytes) | 465,696,000 | 59,978,880 |
| Size | 444.1 MB | 57.2 MB |
| Events in quadrant A | 2,793,521 | 391,553 |
| Events in quadrant B | 2,712,803 | 397,156 |
| Events in quadrant C | 2,009,648 | 402,798 |
| Events in quadrant D | 6,289,353 | 314,753 |
| Mode SS | |||
|---|---|---|---|
| Quadrant | BADHDUFLAG | Total packets | Discarded packets |
| A | 0 | 90 | 0 |
| B | 0 | 90 | 0 |
| C | 0 | 90 | 0 |
| D | 0 | 90 | 0 |
| Mode M9 | |||
|---|---|---|---|
| Quadrant | BADHDUFLAG | Total packets | Discarded packets |
| A | 0 | 3 | 0 |
| B | 0 | 3 | 0 |
| C | 0 | 3 | 0 |
| D | 0 | 3 | 0 |
| Mode M0 | |||
|---|---|---|---|
| Quadrant | BADHDUFLAG | Total packets | Discarded packets |
| A | 0 | 11247 | 2 |
| B | 0 | 10937 | 1 |
| C | 0 | 8973 | 1 |
| D | 0 | 21719 | 1 |
| Quadrant | Total seconds | Saturated seconds | Saturation percentage |
|---|---|---|---|
| A | 4393 | 124 | 2.822672% |
| B | 4393 | 181 | 4.120191% |
| C | 4393 | 7 | 0.159344% |
| D | 4393 | 1384 | 31.504667% |
Noise dominated data is calculated using 1-second bins in cleaned event files. If a bin has >2000 counts, and if more than 50% of those come from <1% of pixels, then it is considered to be noise-dominated and hence unusable.
| Quadrant | # 1 sec bins | Bins with >0 counts | Bins with >2000 counts | High rate bins dominated by noise | Noise dominated (total time) | Noise dominated (detector-on time) | Marked lightcurve |
|---|---|---|---|---|---|---|---|
| A | 4663 | 4393 | 26 | 26 | 0.56% | 0.59% | 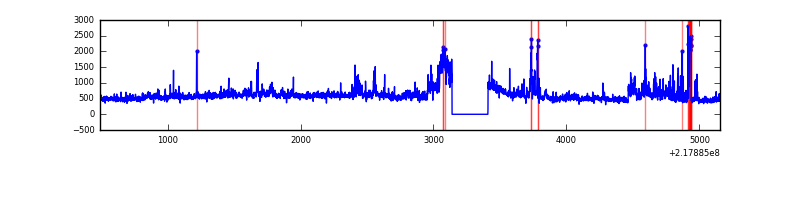 |
| B | 4663 | 4394 | 112 | 112 | 2.40% | 2.55% | 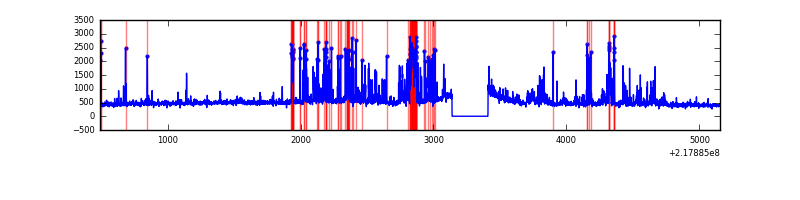 |
| C | 4663 | 4394 | 0 | 0 | 0.00% | 0.00% | 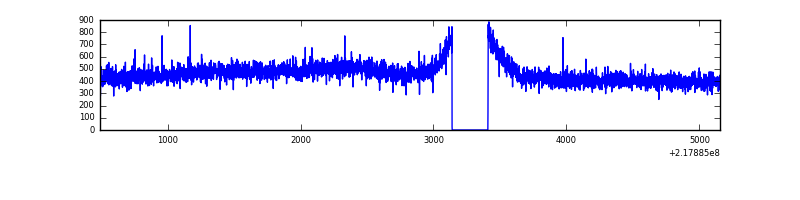 |
| D | 4662 | 4392 | 1245 | 1245 | 26.71% | 28.35% | 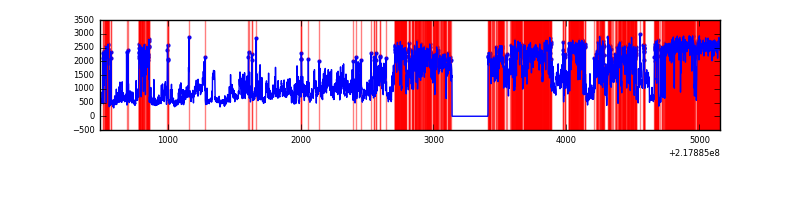 |
Top three noisy pixels from each quadrant. If the there are fewer than three noisy pixels in the level2.evt file, extra rows are filled as -1
| Pixel properties | Quadrant properties | ||||||
|---|---|---|---|---|---|---|---|
| Quadrant | DetID | PixID | Counts | Sigma | Mean | Median | Sigma |
| A | 8 | 15 | 416044 | 3777.53 | 523 | 510 | 110.0 |
| A | 13 | 251 | 155104 | 1405.38 | 523 | 510 | 110.0 |
| A | 15 | 236 | 121192 | 1097.09 | 523 | 510 | 110.0 |
| B | 3 | 64 | 539959 | 5255.11 | 523 | 512 | 102.7 |
| B | 4 | 81 | 69521 | 672.26 | 523 | 512 | 102.7 |
| B | 0 | 219 | 34998 | 335.95 | 523 | 512 | 102.7 |
| C | 8 | 128 | 6183 | 47.4 | 510 | 512 | 119.6 |
| C | 13 | 61 | 4147 | 30.38 | 510 | 512 | 119.6 |
| C | 9 | 54 | 3792 | 27.42 | 510 | 512 | 119.6 |
| D | 2 | 63 | 3599053 | 31840.37 | 453 | 438 | 113.0 |
| D | 12 | 220 | 701693 | 6204.67 | 453 | 438 | 113.0 |
| D | 2 | 14 | 126220 | 1112.91 | 453 | 438 | 113.0 |
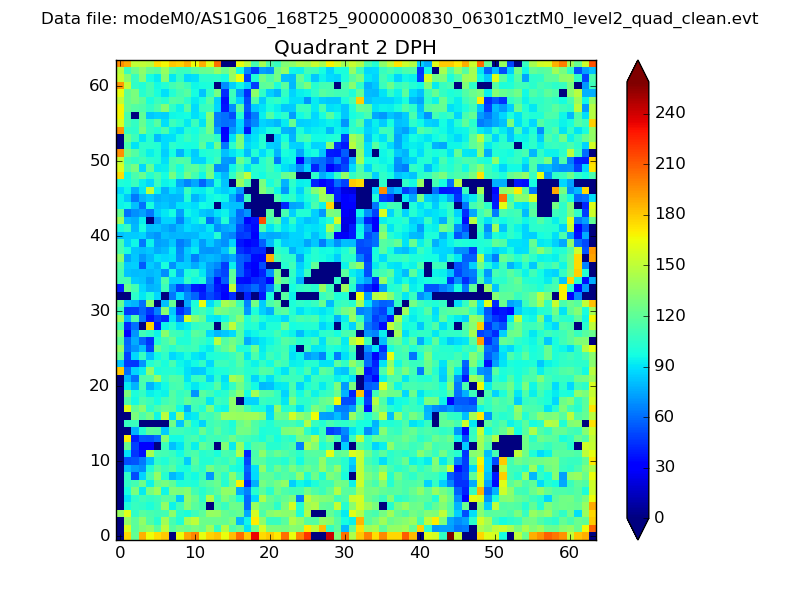
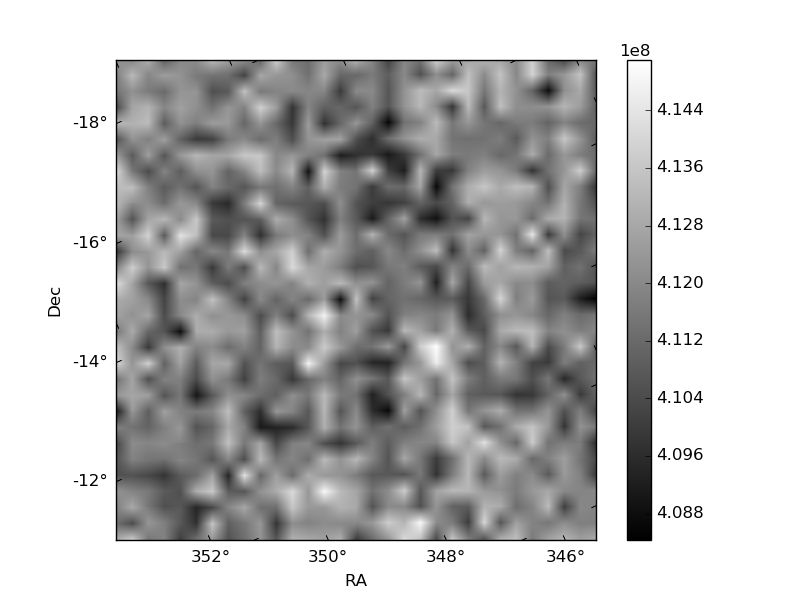
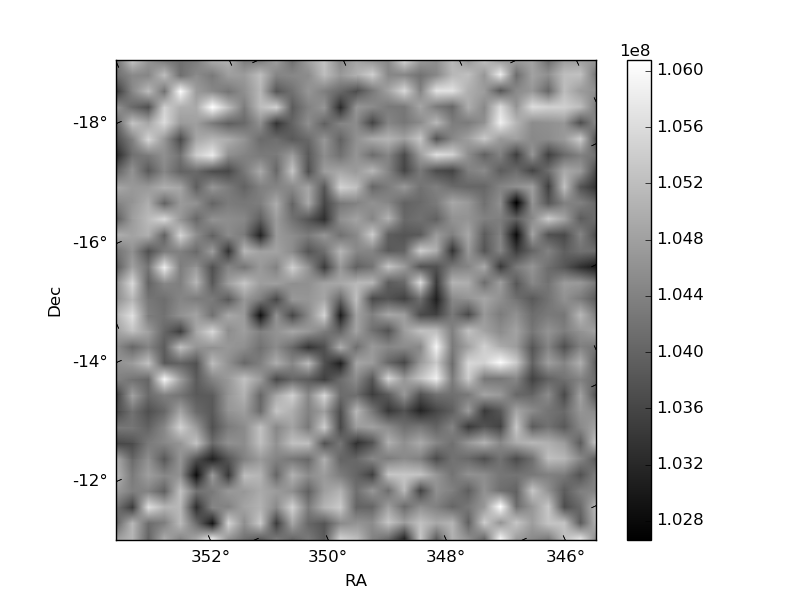
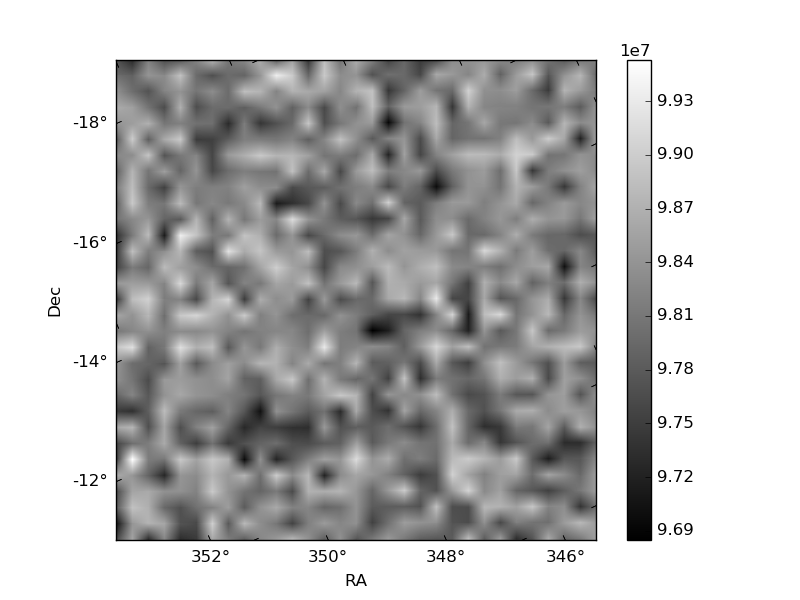
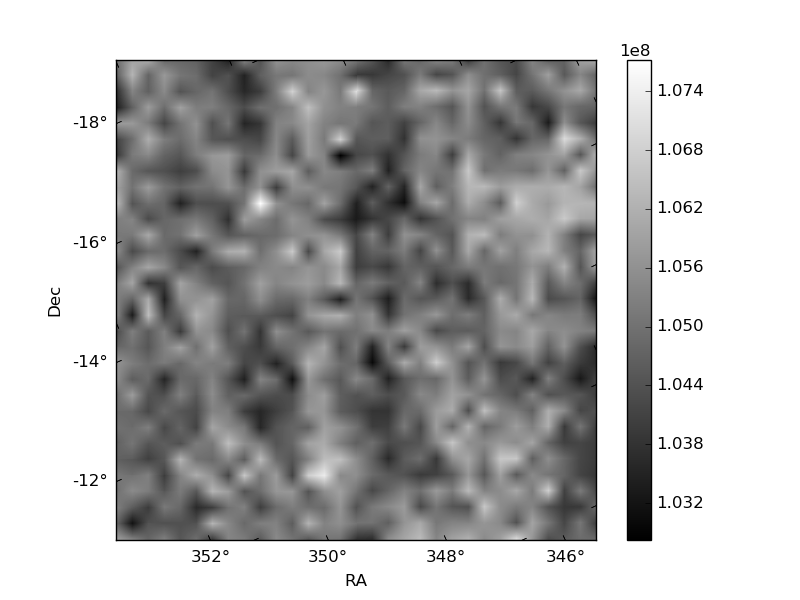
Histogram calculated using DETX and DETY for each event in the final _common_clean file
| Quadrant A | 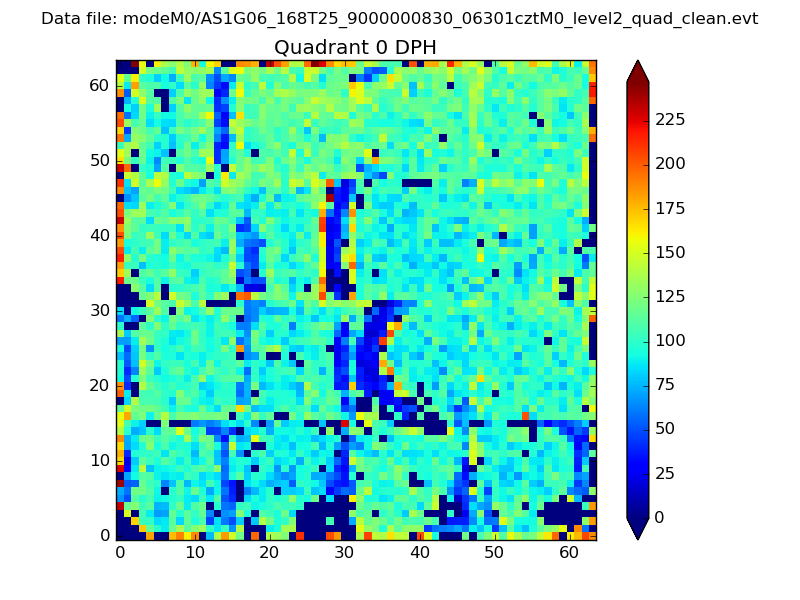 |
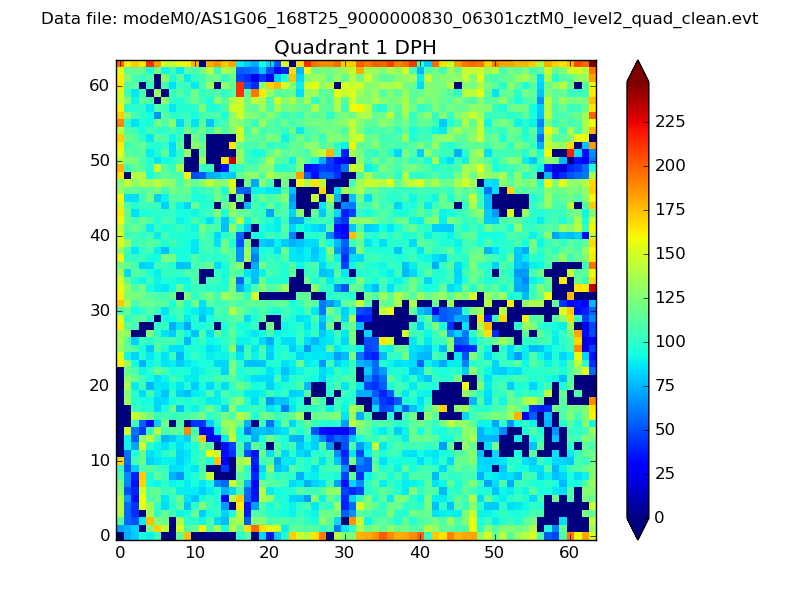 |
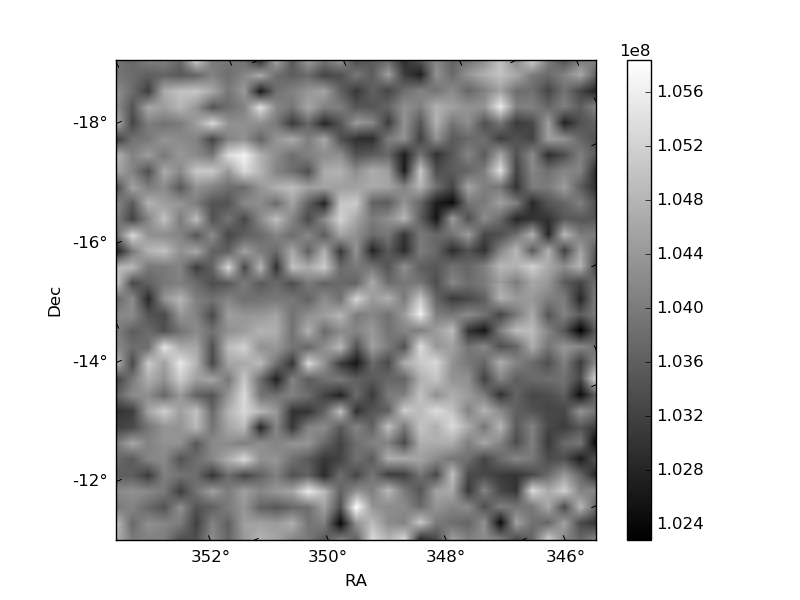
Quadrant B |
|---|---|---|---|
| Quadrant D | 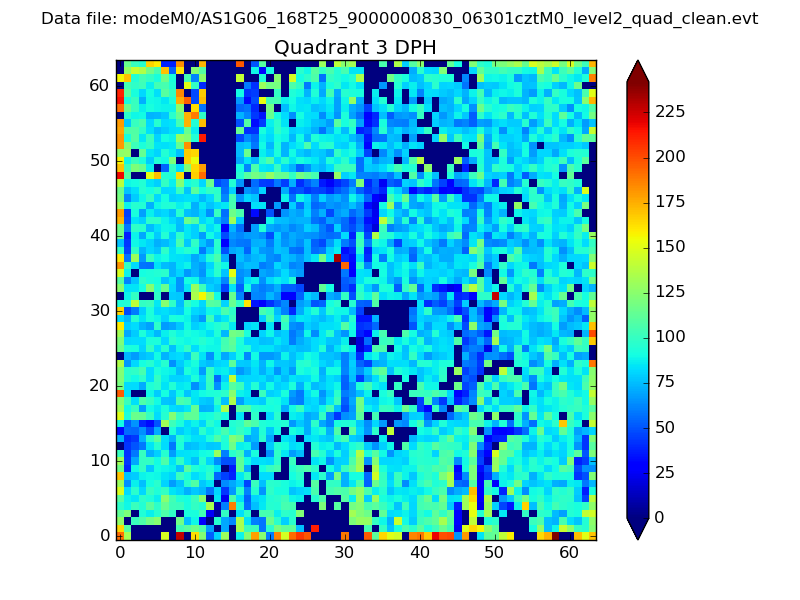 |
 |
Quadrant C |
| Plot type | Count rate plots | Images |
|---|---|---|
| Comparison with Poisson distribution Blue bars denote a histogram of data divided into 1 sec bins. Red curve is a Poisson curve with rate = median count rate of data. |
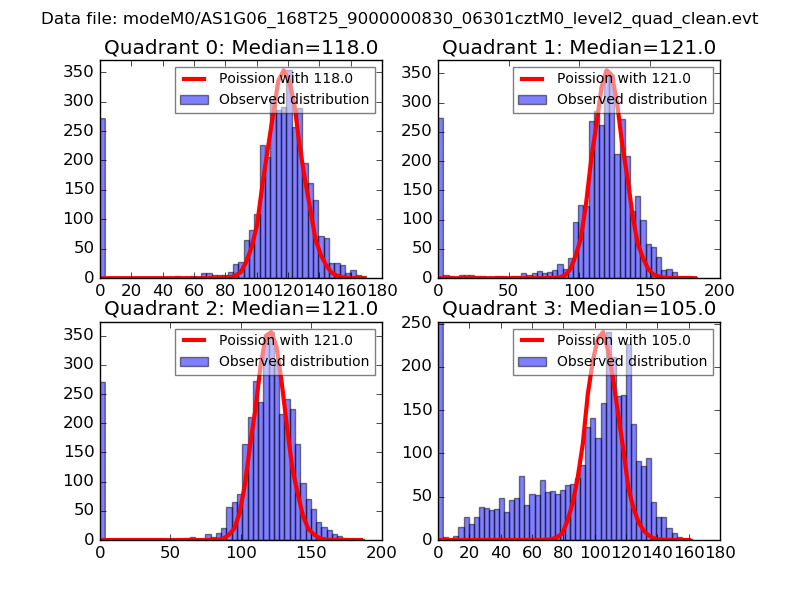 |
 |
| Quadrant-wise count rates Data is divided into 100 sec bins |
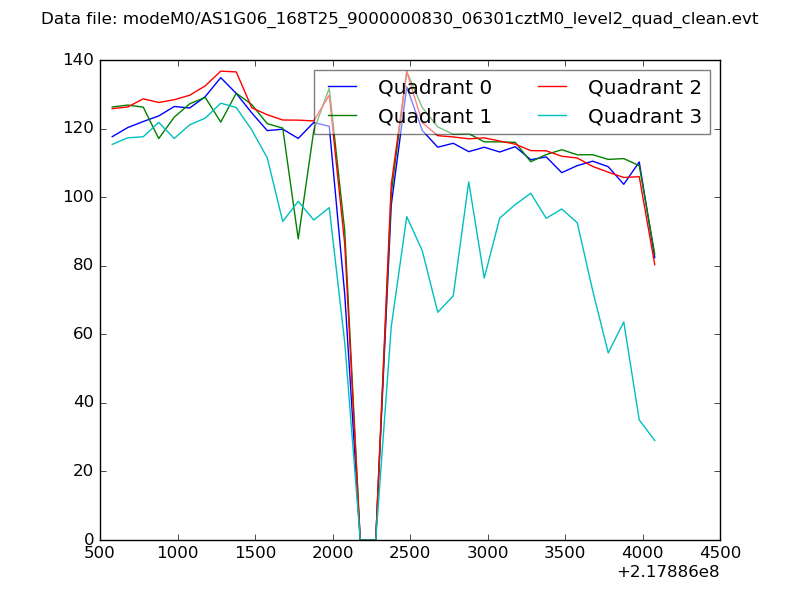 |
|
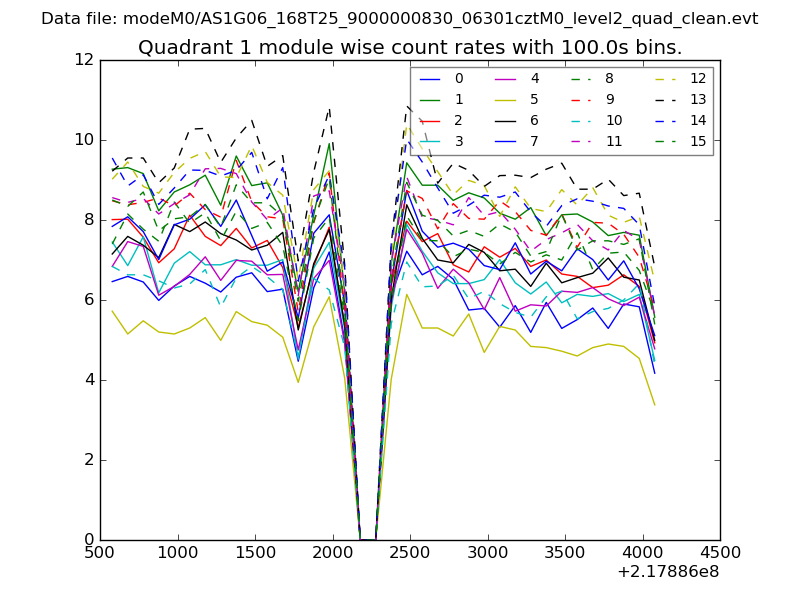
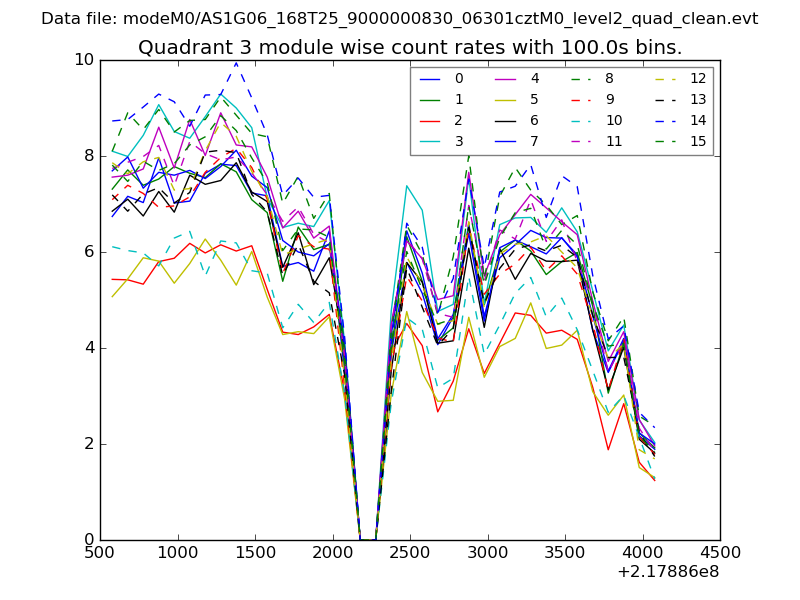
| Module-wise count rates for Quadrant A Data is divided into 100 sec bins |
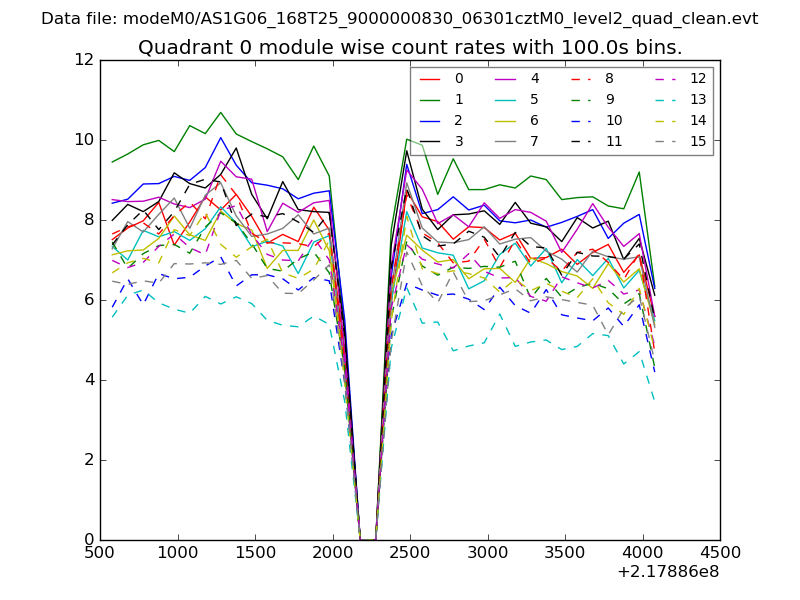 |
 |
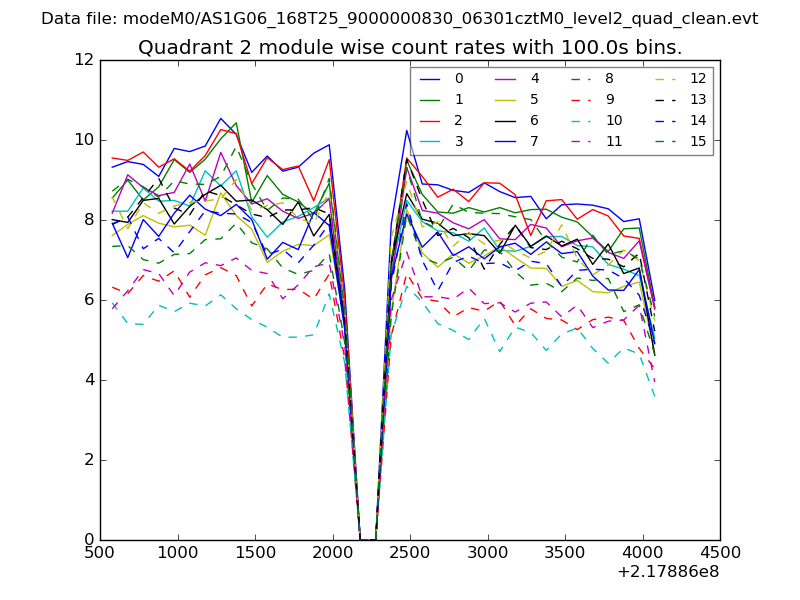
| Module-wise count rates for Quadrant B Data is divided into 100 sec bins |
 |
 |
| Module-wise count rates for Quadrant C Data is divided into 100 sec bins |
 |
 |
| Module-wise count rates for Quadrant D Data is divided into 100 sec bins |
 |
 |
| Parameter | Plot |
|---|---|
| CZT HV Monitor | 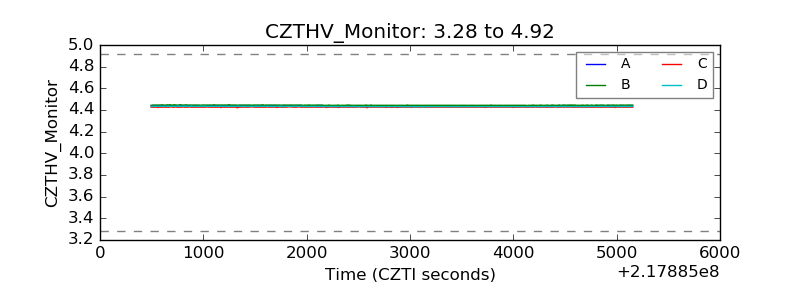 |
| D_VDD |  |
| Temperature 1 | 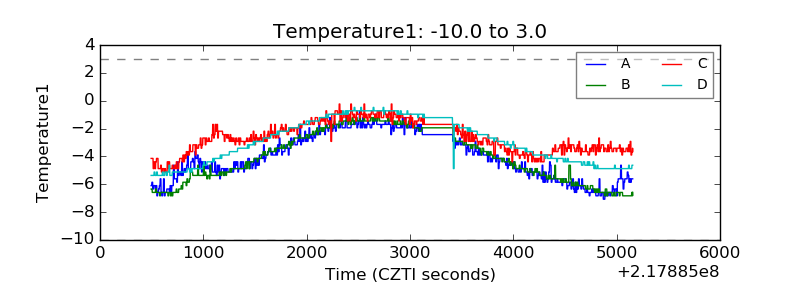 |
| Veto HV Monitor | 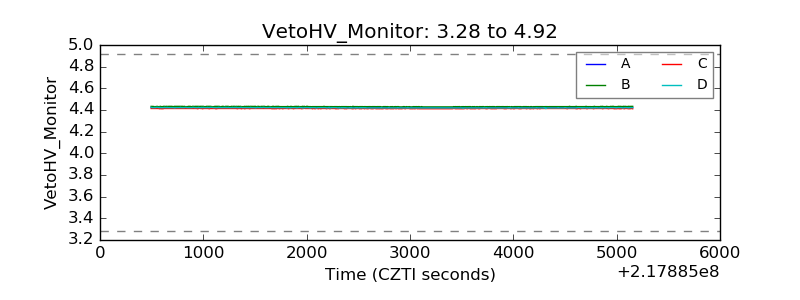 |
| Veto LLD |  |
| Alpha Counter | 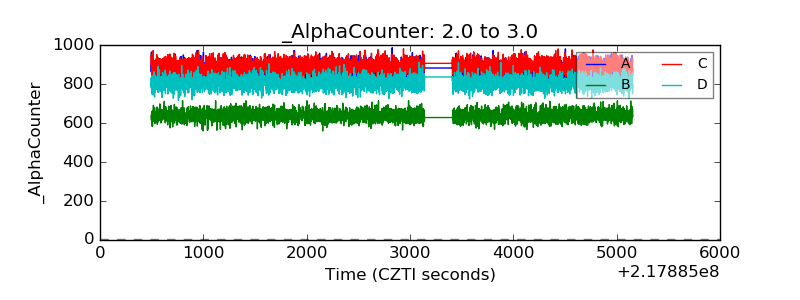 |
| _CPM_Rate | 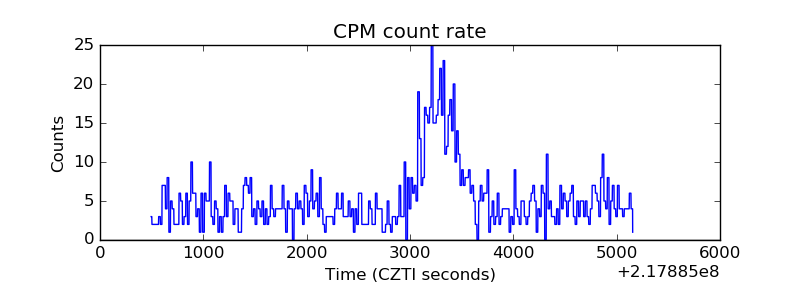 |
| CZT Counter | 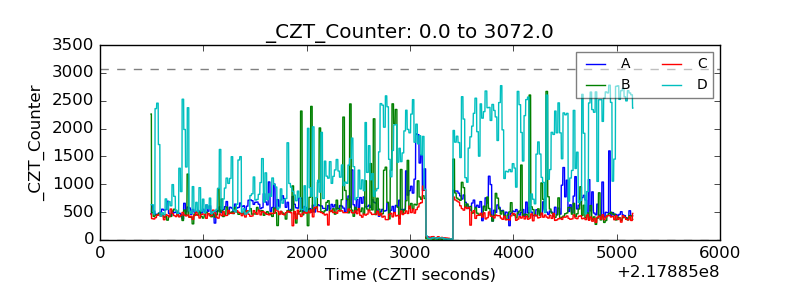 |
| +2.5 Volts monitor |  |
| +5 Volts monitor |  |
| _ROLL_ROT | 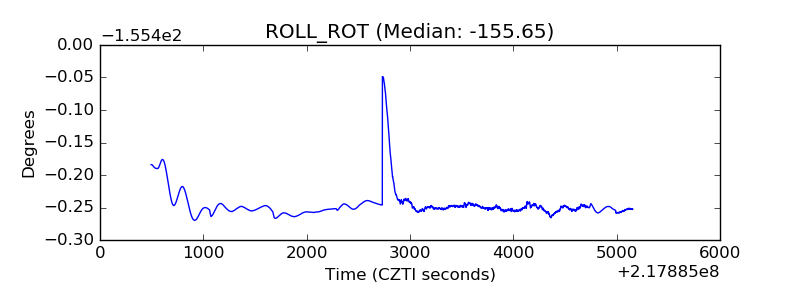 |
| _Roll_DEC | 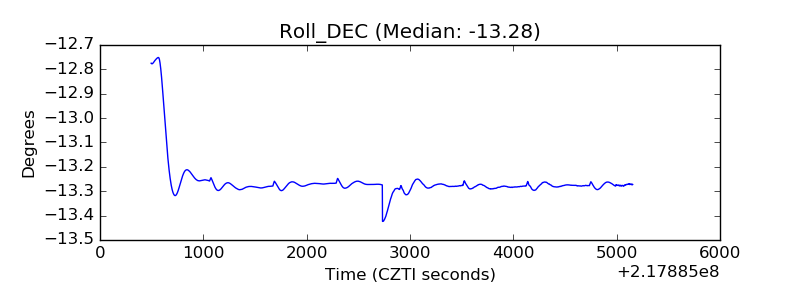 |
| _Roll_RA | 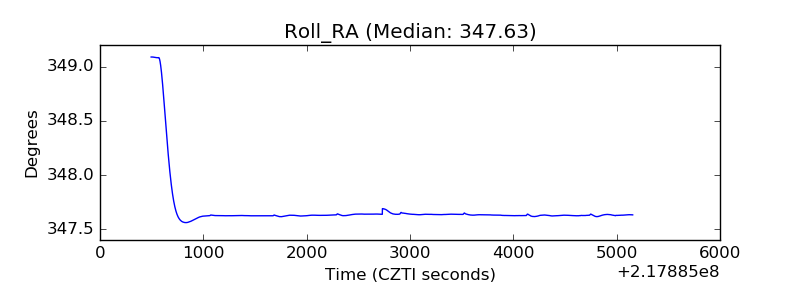 |
| Veto Counter | 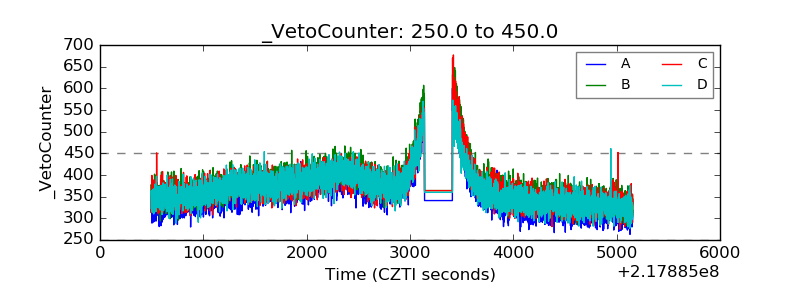 |