| Param | Original file | Final file |
|---|---|---|
| Filename | modeM0/AS1G06_028T01_9000000834cztM0_level2.fits | modeM0/AS1G06_028T01_9000000834cztM0_level2_quad_clean.evt |
| Size (bytes) | 304,968,960 | 310,317,120 |
| Size | 290.8 MB | 295.9 MB |
| Events in quadrant A | 1,876,854 | 1,938,557 |
| Events in quadrant B | 1,788,118 | 1,873,098 |
| Events in quadrant C | 1,821,672 | 1,803,623 |
| Events in quadrant D | 1,523,188 | 1,557,533 |
| Mode M0 | |||
|---|---|---|---|
| Quadrant | BADHDUFLAG | Total packets | Discarded packets |
| A | 0 | 68796 | 0 |
| B | 0 | 79781 | 0 |
| C | 0 | 69710 | 0 |
| D | 0 | 115289 | 0 |
| Mode SS | |||
|---|---|---|---|
| Quadrant | BADHDUFLAG | Total packets | Discarded packets |
| A | 0 | 658 | 0 |
| B | 0 | 658 | 0 |
| C | 0 | 658 | 0 |
| D | 0 | 658 | 0 |
| Mode M9 | |||
|---|---|---|---|
| Quadrant | BADHDUFLAG | Total packets | Discarded packets |
| A | 0 | 69 | 0 |
| B | 0 | 69 | 0 |
| C | 0 | 69 | 0 |
| D | 0 | 69 | 0 |
| Quadrant | Total seconds | Saturated seconds | Saturation percentage |
|---|---|---|---|
| A | 32389 | 542 | 1.673408% |
| B | 32389 | 1471 | 4.541665% |
| C | 32389 | 455 | 1.404798% |
| D | 32389 | 2510 | 7.749545% |
Noise dominated data is calculated using 1-second bins in cleaned event files. If a bin has >2000 counts, and if more than 50% of those come from <1% of pixels, then it is considered to be noise-dominated and hence unusable.
| Quadrant | # 1 sec bins | Bins with >0 counts | Bins with >2000 counts | High rate bins dominated by noise | Noise dominated (total time) | Noise dominated (detector-on time) | Marked lightcurve |
|---|---|---|---|---|---|---|---|
| A | 39084 | 32389 | 0 | 0 | 0.00% | 0.00% |  |
| B | 39084 | 32373 | 0 | 0 | 0.00% | 0.00% |  |
| C | 39084 | 32385 | 0 | 0 | 0.00% | 0.00% |  |
| D | 39083 | 32370 | 0 | 0 | 0.00% | 0.00% |  |
Top three noisy pixels from each quadrant. If the there are fewer than three noisy pixels in the level2.evt file, extra rows are filled as -1
| Pixel properties | Quadrant properties | ||||||
|---|---|---|---|---|---|---|---|
| Quadrant | DetID | PixID | Counts | Sigma | Mean | Median | Sigma |
| A | 0 | 29 | 1885 | 11.53 | 487 | 455 | 124.1 |
| A | 14 | 188 | 1851 | 11.25 | 487 | 455 | 124.1 |
| A | 7 | 110 | 1632 | 9.49 | 487 | 455 | 124.1 |
| B | 2 | 9 | 1503 | 11.19 | 469 | 448 | 94.3 |
| B | 12 | 226 | 1334 | 9.4 | 469 | 448 | 94.3 |
| B | 5 | 128 | 1235 | 8.35 | 469 | 448 | 94.3 |
| C | 1 | 80 | 1448 | 7.75 | 480 | 445 | 129.4 |
| C | 1 | 81 | 1412 | 7.47 | 480 | 445 | 129.4 |
| C | 2 | 191 | 1247 | 6.2 | 480 | 445 | 129.4 |
| D | 11 | 82 | 1165 | 6.53 | 435 | 395 | 117.8 |
| D | 3 | 14 | 1137 | 6.3 | 435 | 395 | 117.8 |
| D | 1 | 19 | 1135 | 6.28 | 435 | 395 | 117.8 |
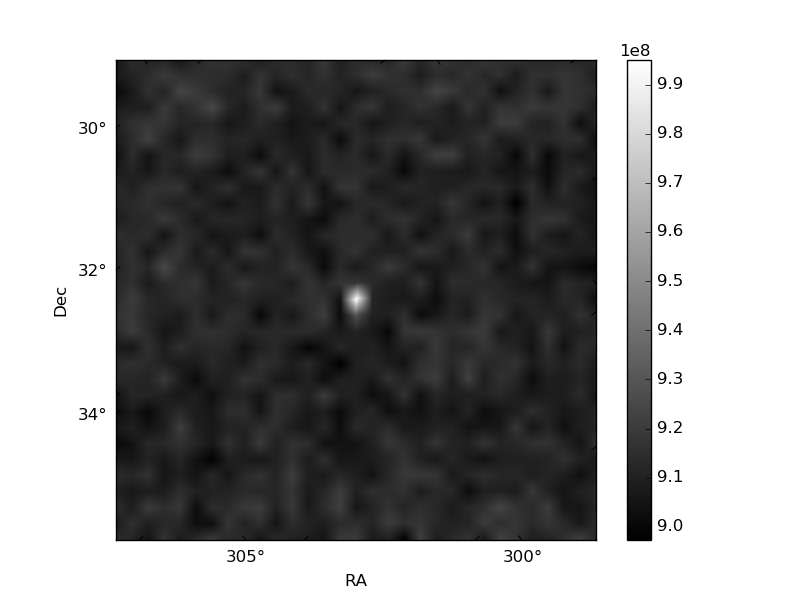
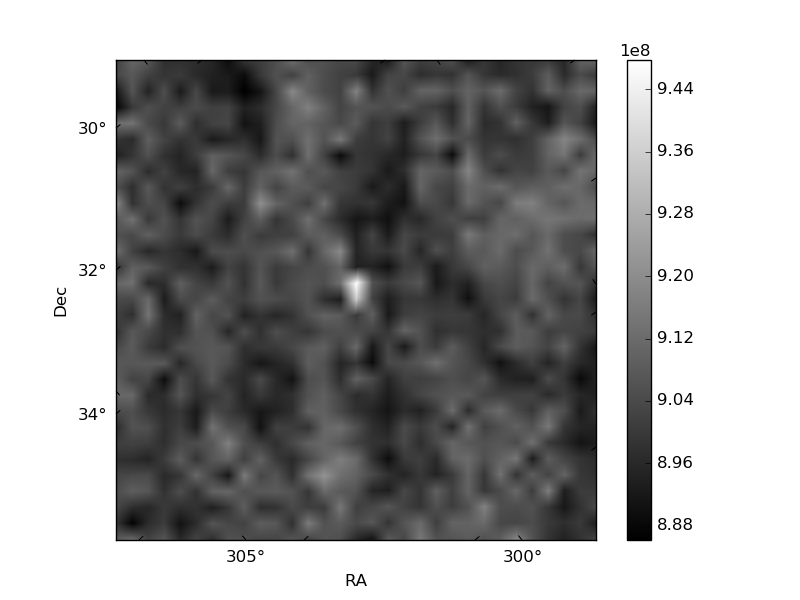
Histogram calculated using DETX and DETY for each event in the final _common_clean file
| Quadrant A | 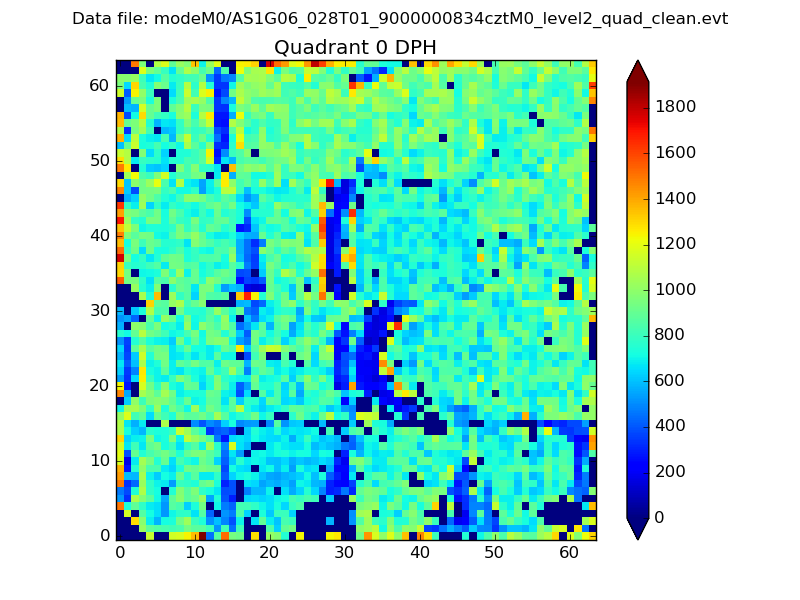 |
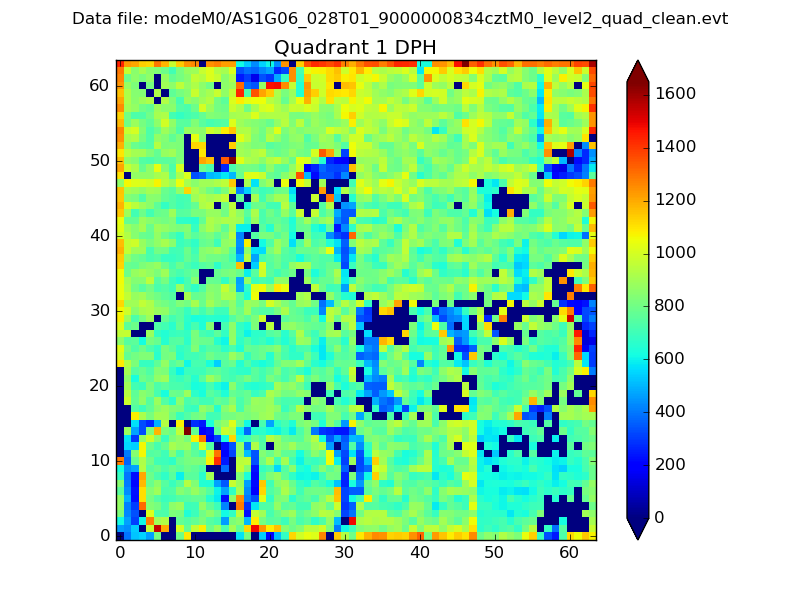 |
Quadrant B |
|---|---|---|---|
| Quadrant D |  |
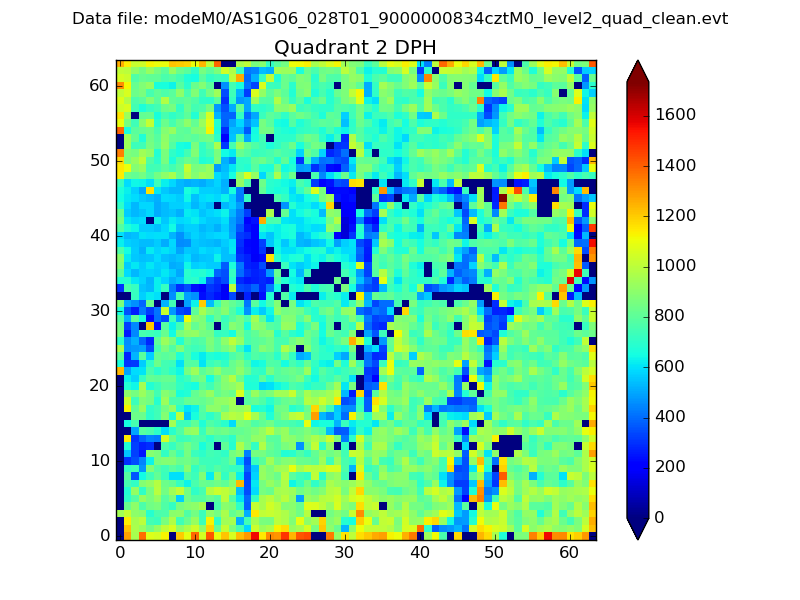 |
Quadrant C |
| Plot type | Count rate plots | Images |
|---|---|---|
| Comparison with Poisson distribution Blue bars denote a histogram of data divided into 1 sec bins. Red curve is a Poisson curve with rate = median count rate of data. |
 |
 |
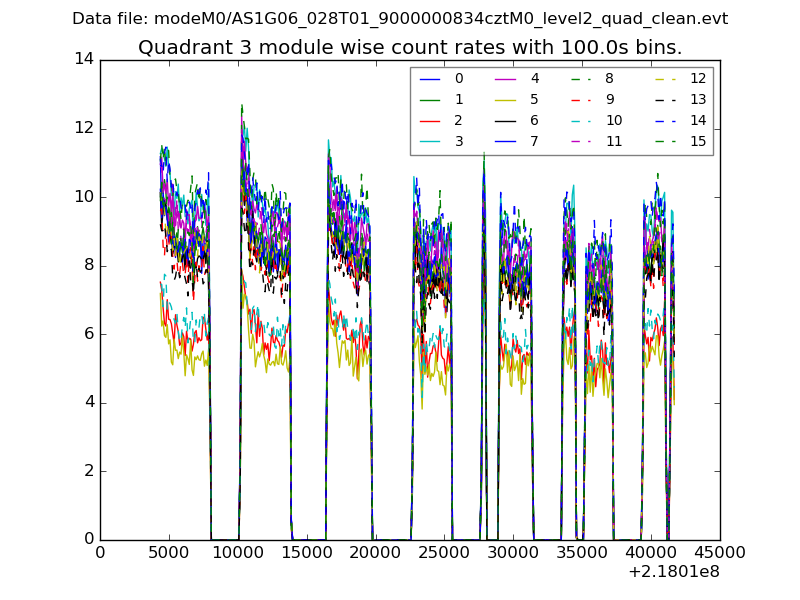
| Quadrant-wise count rates Data is divided into 100 sec bins |
 |
|
| Module-wise count rates for Quadrant A Data is divided into 100 sec bins |
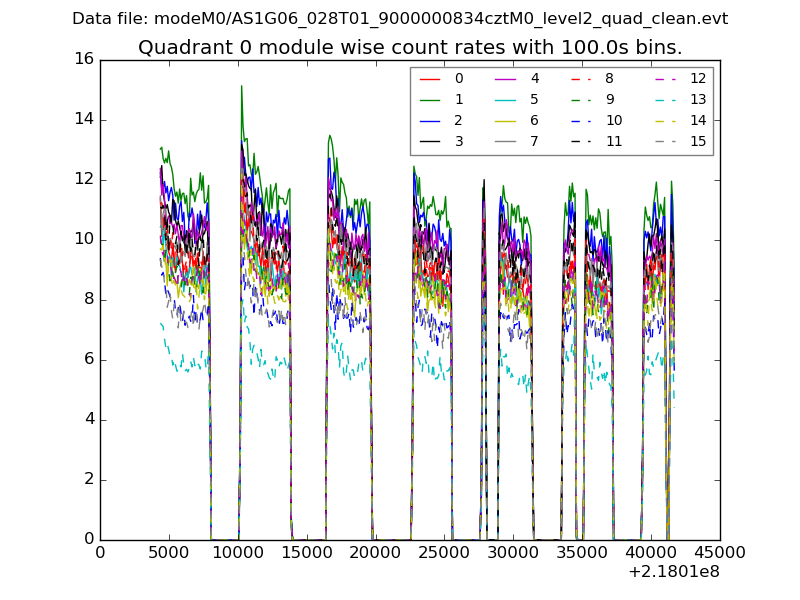 |
 |
| Module-wise count rates for Quadrant B Data is divided into 100 sec bins |
 |
 |
| Module-wise count rates for Quadrant C Data is divided into 100 sec bins |
 |
 |
| Module-wise count rates for Quadrant D Data is divided into 100 sec bins |
 |
 |
| Parameter | Plot |
|---|---|
| CZT HV Monitor |  |
| D_VDD | 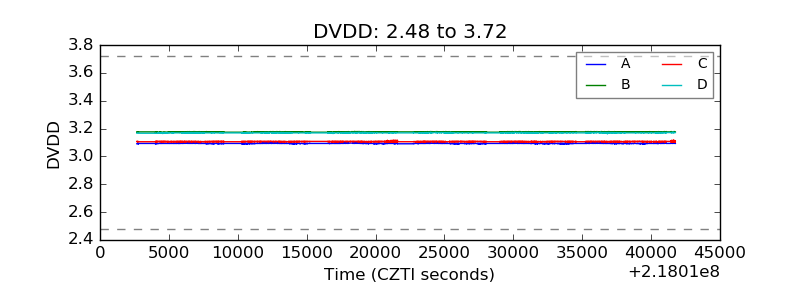 |
| Temperature 1 |  |
| Veto HV Monitor |  |
| Veto LLD |  |
| Alpha Counter |  |
| _CPM_Rate |  |
| CZT Counter | 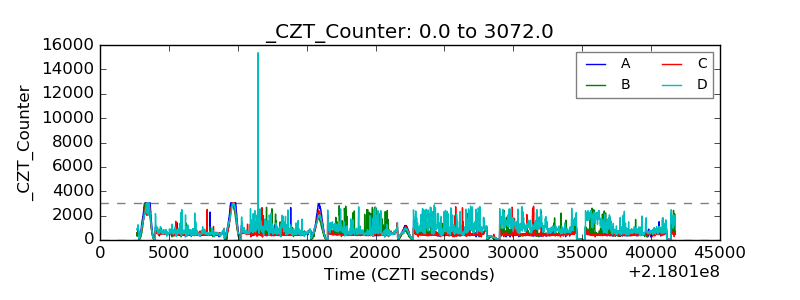 |
| +2.5 Volts monitor | 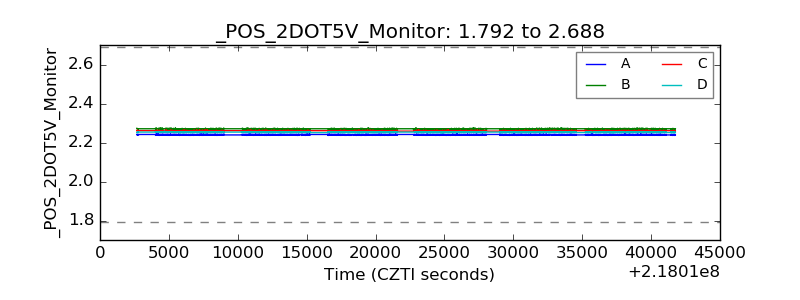 |
| +5 Volts monitor |  |
| _ROLL_ROT |  |
| _Roll_DEC |  |
| _Roll_RA |  |
| Veto Counter |  |