| Param | Original file | Final file |
|---|---|---|
| Filename | modeM0/AS1G06_028T01_9000000834_06323cztM0_level2.evt | modeM0/AS1G06_028T01_9000000834_06323cztM0_level2_quad_clean.evt |
| Size (bytes) | 124,724,160 | 24,402,240 |
| Size | 118.9 MB | 23.3 MB |
| Events in quadrant A | 875,626 | 159,200 |
| Events in quadrant B | 902,121 | 162,923 |
| Events in quadrant C | 798,452 | 156,831 |
| Events in quadrant D | 1,096,507 | 148,207 |
| Mode M0 | |||
|---|---|---|---|
| Quadrant | BADHDUFLAG | Total packets | Discarded packets |
| A | 0 | 3505 | 2 |
| B | 0 | 3621 | 1 |
| C | 0 | 3242 | 1 |
| D | 0 | 4296 | 1 |
| Mode SS | |||
|---|---|---|---|
| Quadrant | BADHDUFLAG | Total packets | Discarded packets |
| A | 0 | 32 | 0 |
| B | 0 | 32 | 0 |
| C | 0 | 32 | 0 |
| D | 0 | 32 | 0 |
| Mode M9 | |||
|---|---|---|---|
| Quadrant | BADHDUFLAG | Total packets | Discarded packets |
| A | 0 | 12 | 0 |
| B | 0 | 12 | 0 |
| C | 0 | 12 | 0 |
| D | 0 | 12 | 0 |
| Quadrant | Total seconds | Saturated seconds | Saturation percentage |
|---|---|---|---|
| A | 1501 | 50 | 3.331113% |
| B | 1501 | 53 | 3.530979% |
| C | 1501 | 19 | 1.265823% |
| D | 1501 | 66 | 4.397069% |
Noise dominated data is calculated using 1-second bins in cleaned event files. If a bin has >2000 counts, and if more than 50% of those come from <1% of pixels, then it is considered to be noise-dominated and hence unusable.
| Quadrant | # 1 sec bins | Bins with >0 counts | Bins with >2000 counts | High rate bins dominated by noise | Noise dominated (total time) | Noise dominated (detector-on time) | Marked lightcurve |
|---|---|---|---|---|---|---|---|
| A | 2706 | 1502 | 0 | 0 | 0.00% | 0.00% | 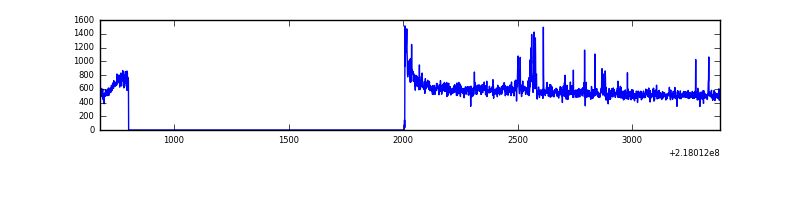 |
| B | 2706 | 1502 | 4 | 4 | 0.15% | 0.27% | 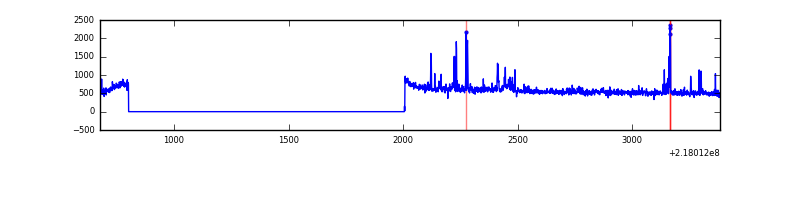 |
| C | 2706 | 1502 | 0 | 0 | 0.00% | 0.00% | 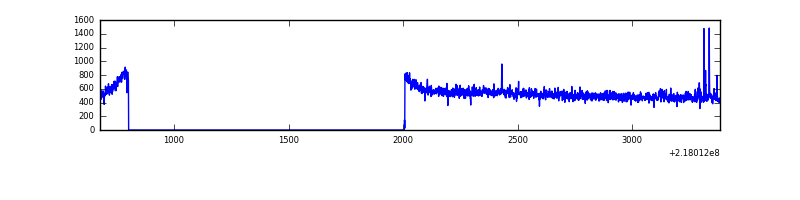 |
| D | 2706 | 1502 | 18 | 18 | 0.67% | 1.20% | 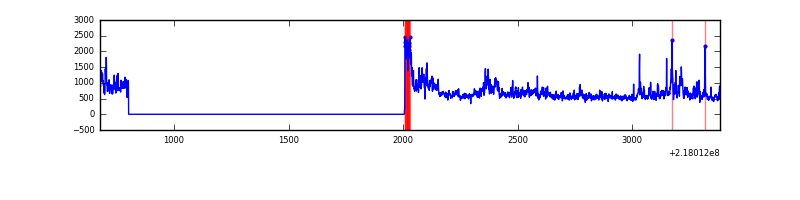 |
Top three noisy pixels from each quadrant. If the there are fewer than three noisy pixels in the level2.evt file, extra rows are filled as -1
| Pixel properties | Quadrant properties | ||||||
|---|---|---|---|---|---|---|---|
| Quadrant | DetID | PixID | Counts | Sigma | Mean | Median | Sigma |
| A | 0 | 31 | 31444 | 686.97 | 216 | 211 | 45.5 |
| A | 15 | 236 | 7772 | 166.3 | 216 | 211 | 45.5 |
| A | 13 | 251 | 2646 | 53.56 | 216 | 211 | 45.5 |
| B | 3 | 64 | 33060 | 756.73 | 216 | 213 | 43.4 |
| B | 4 | 81 | 28307 | 647.23 | 216 | 213 | 43.4 |
| B | 12 | 111 | 4049 | 88.37 | 216 | 213 | 43.4 |
| C | 4 | 254 | 8696 | 175.78 | 202 | 203 | 48.3 |
| C | 13 | 61 | 1631 | 29.56 | 202 | 203 | 48.3 |
| C | 8 | 222 | 647 | 9.19 | 202 | 203 | 48.3 |
| D | 12 | 221 | 280966 | 5572.14 | 201 | 195 | 50.4 |
| D | 12 | 220 | 18912 | 371.46 | 201 | 195 | 50.4 |
| D | 5 | 97 | 11935 | 232.99 | 201 | 195 | 50.4 |
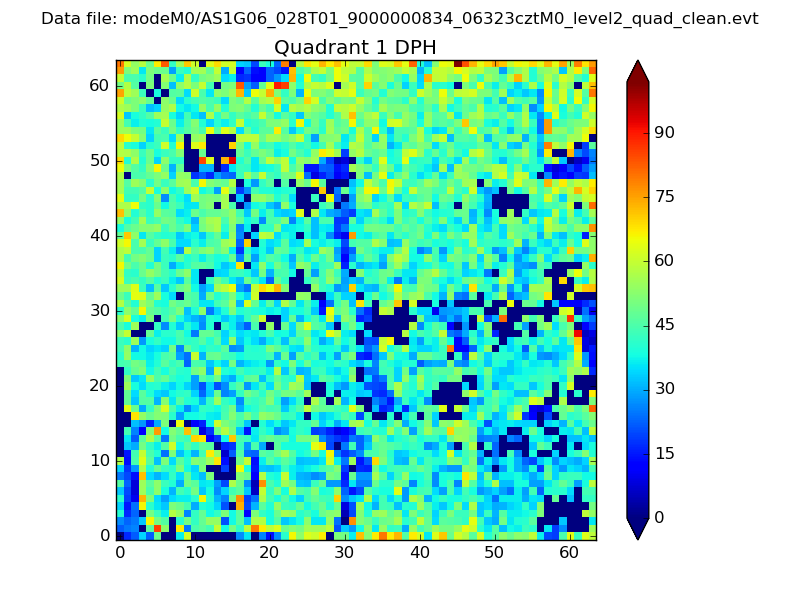
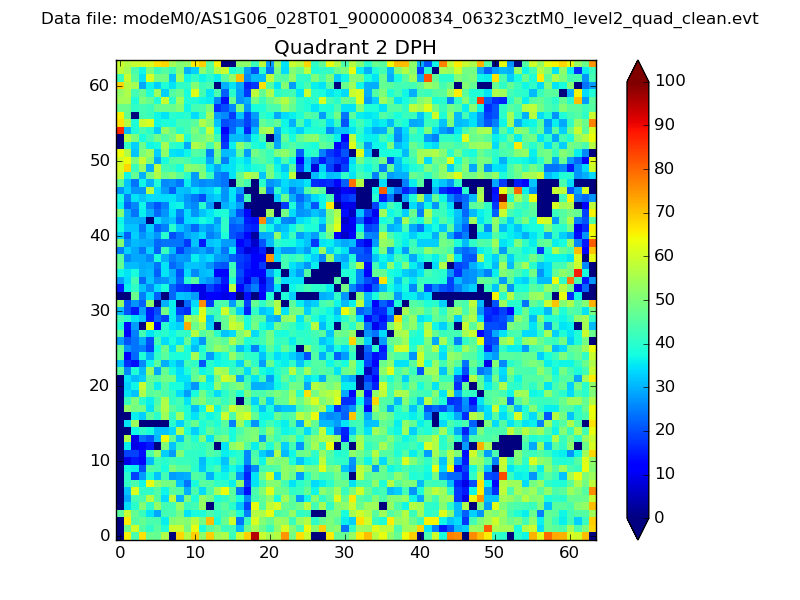
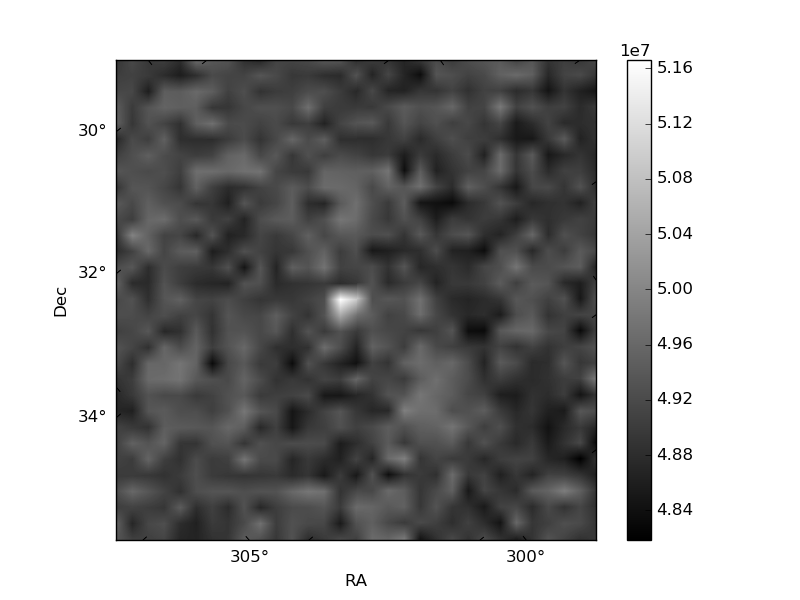
Histogram calculated using DETX and DETY for each event in the final _common_clean file
| Quadrant A |  |
 |
Quadrant B |
|---|---|---|---|
| Quadrant D | 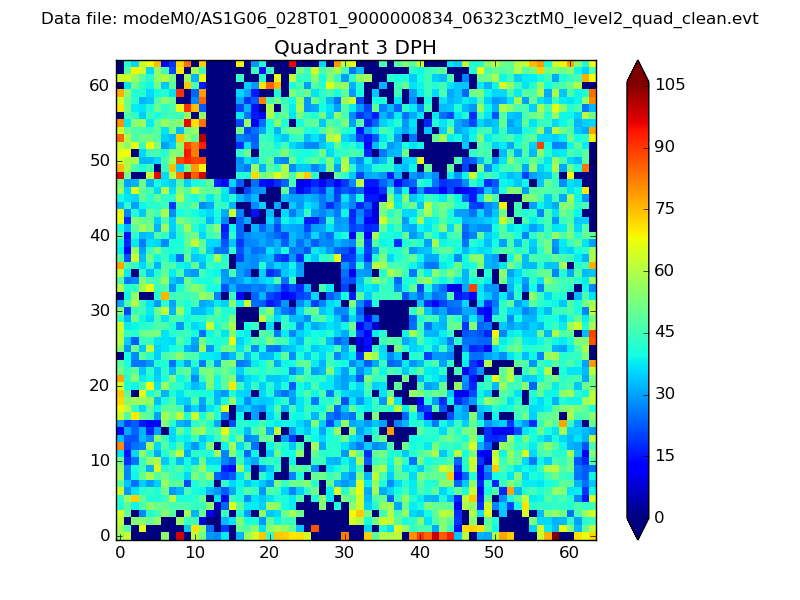 |
 |
Quadrant C |
| Plot type | Count rate plots | Images |
|---|---|---|
| Comparison with Poisson distribution Blue bars denote a histogram of data divided into 1 sec bins. Red curve is a Poisson curve with rate = median count rate of data. |
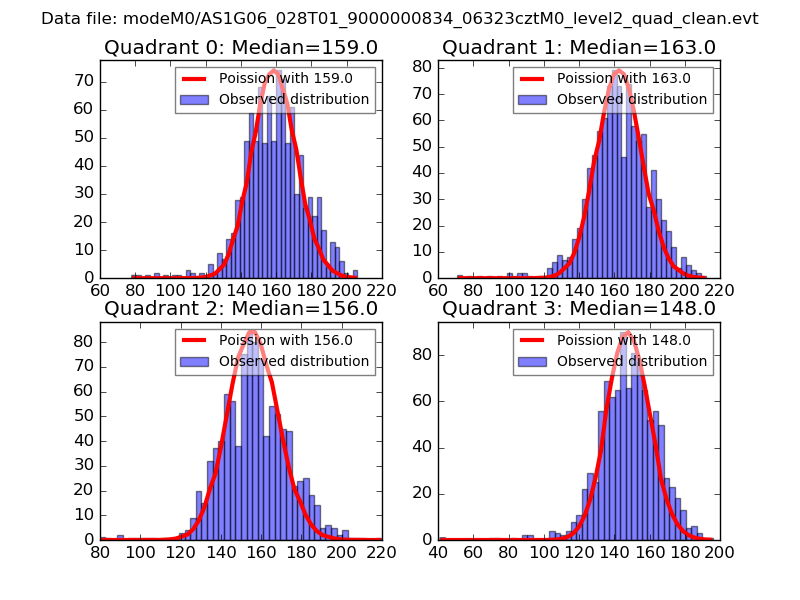 |
 |
| Quadrant-wise count rates Data is divided into 100 sec bins |
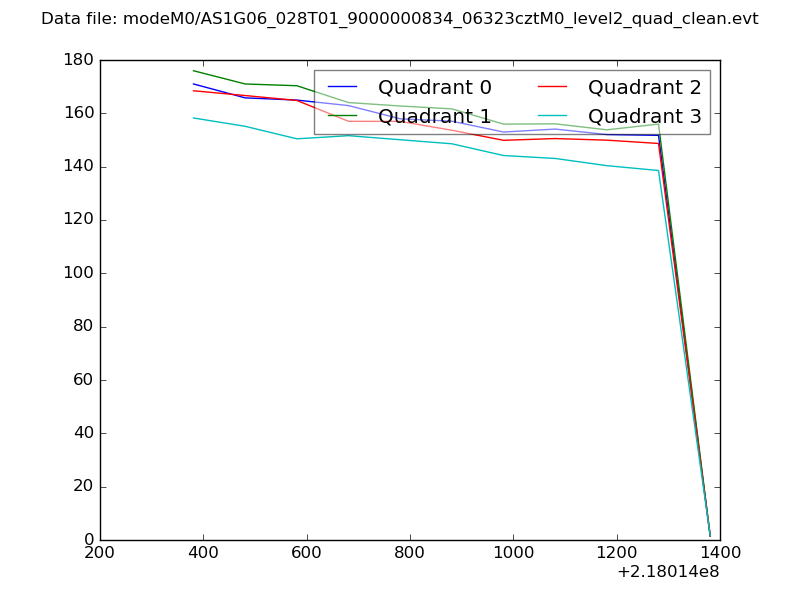 |
|
| Module-wise count rates for Quadrant A Data is divided into 100 sec bins |
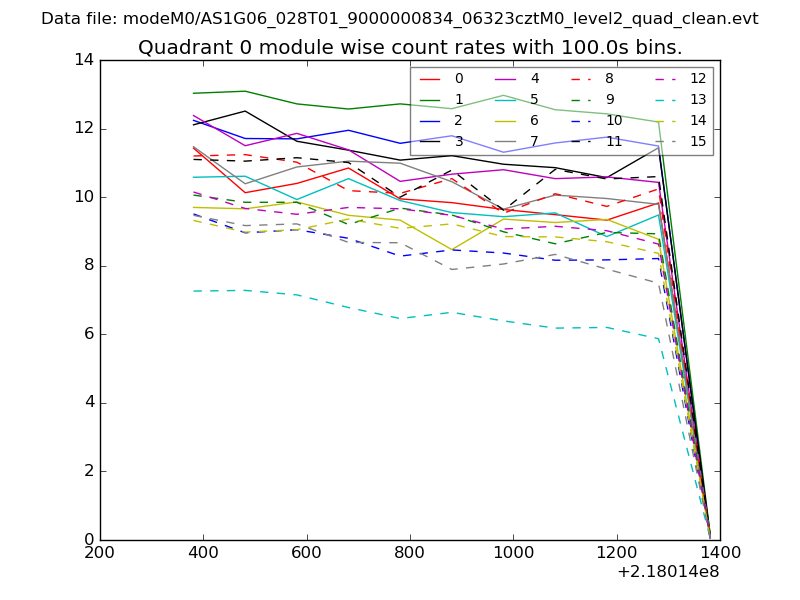 |
 |
| Module-wise count rates for Quadrant B Data is divided into 100 sec bins |
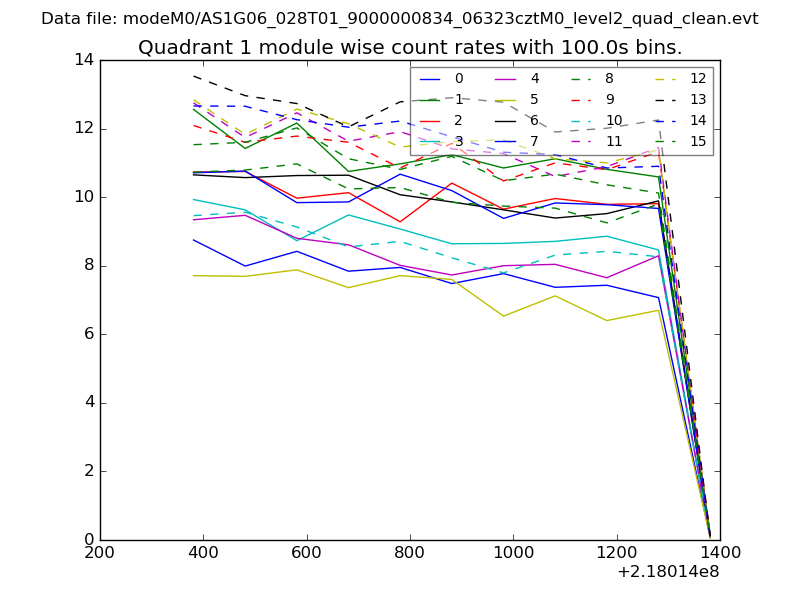 |
 |
| Module-wise count rates for Quadrant C Data is divided into 100 sec bins |
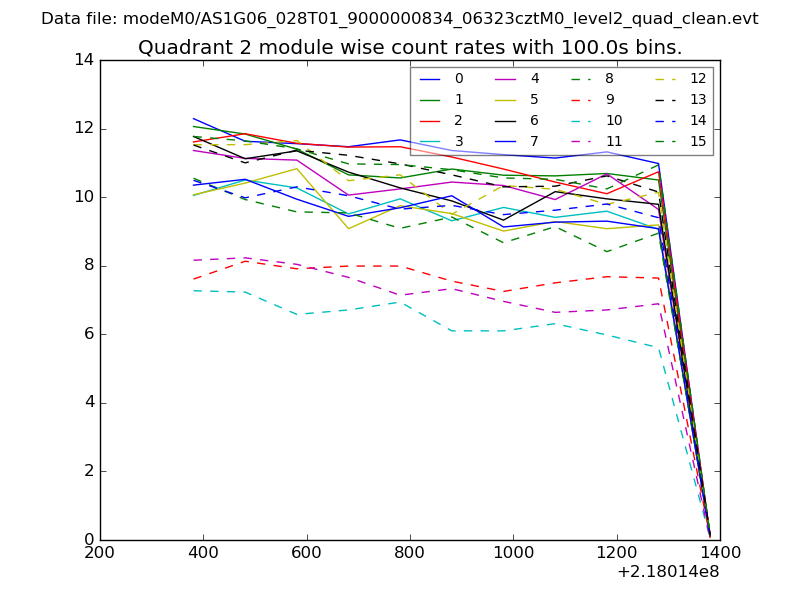 |
 |
| Module-wise count rates for Quadrant D Data is divided into 100 sec bins |
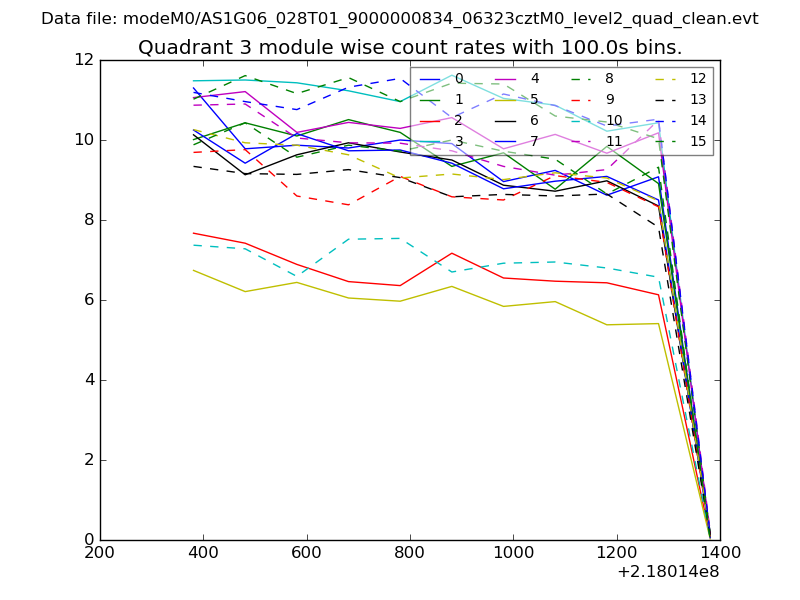 |
 |
| Parameter | Plot |
|---|---|
| CZT HV Monitor | 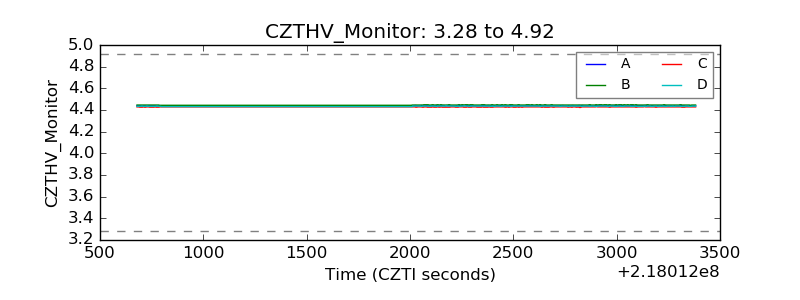 |
| D_VDD | 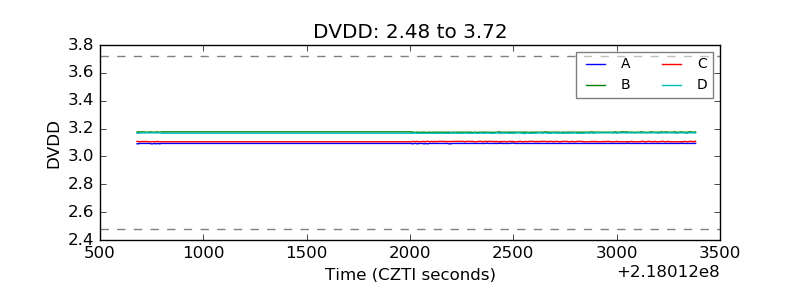 |
| Temperature 1 | 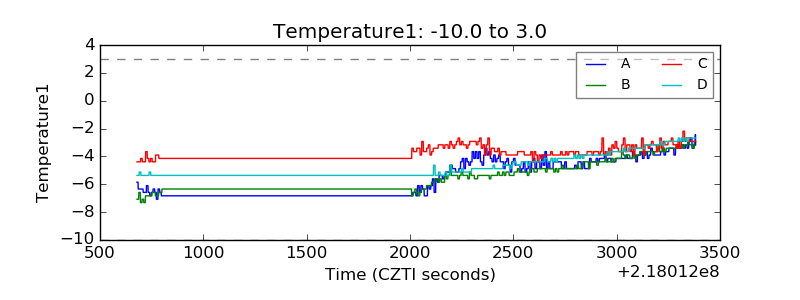 |
| Veto HV Monitor | 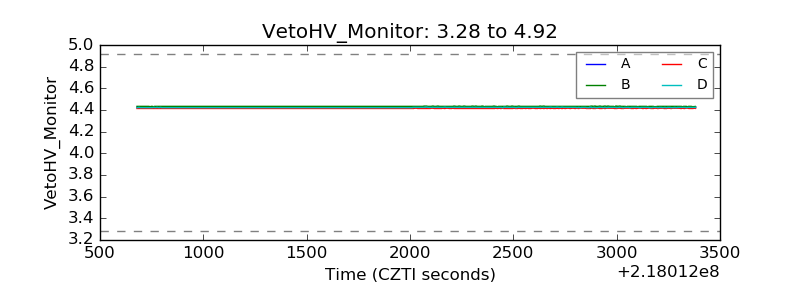 |
| Veto LLD | 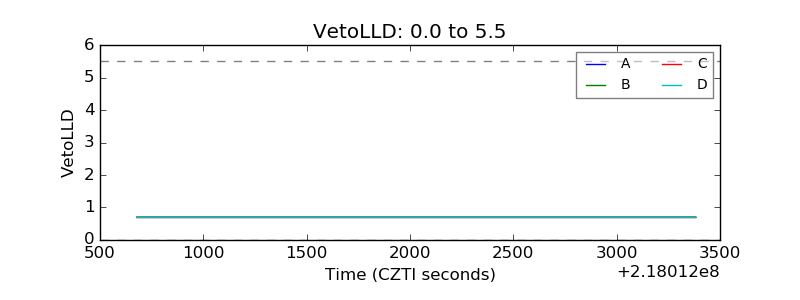 |
| Alpha Counter | 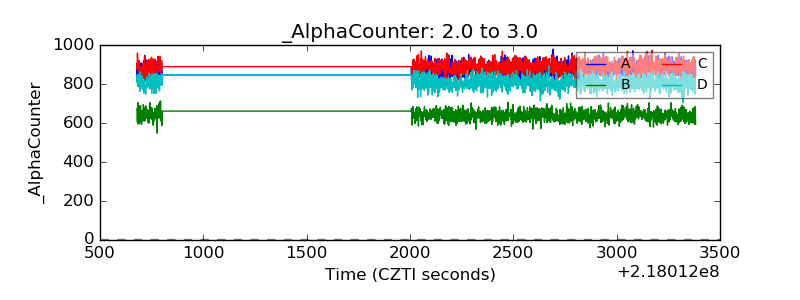 |
| _CPM_Rate | 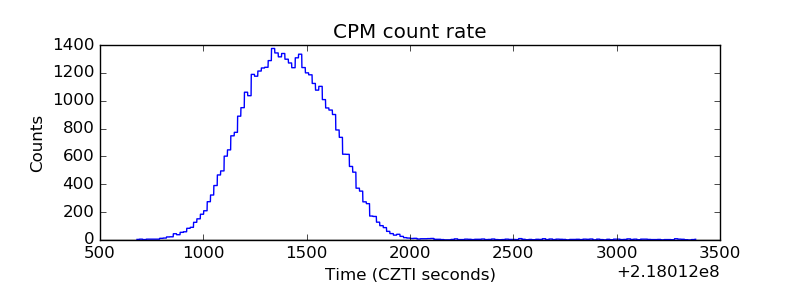 |
| CZT Counter | 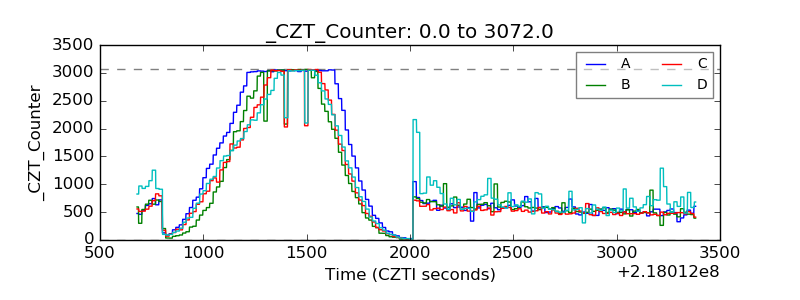 |
| +2.5 Volts monitor |  |
| +5 Volts monitor |  |
| _ROLL_ROT | 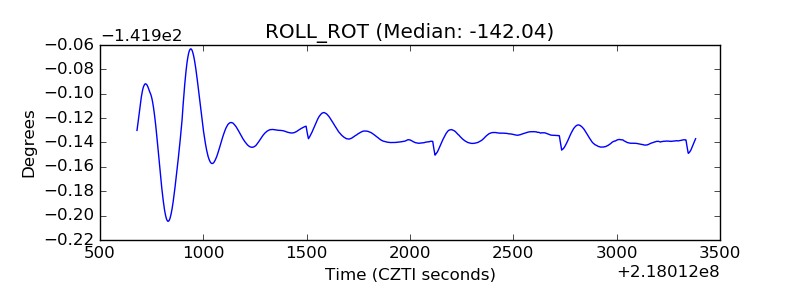 |
| _Roll_DEC | 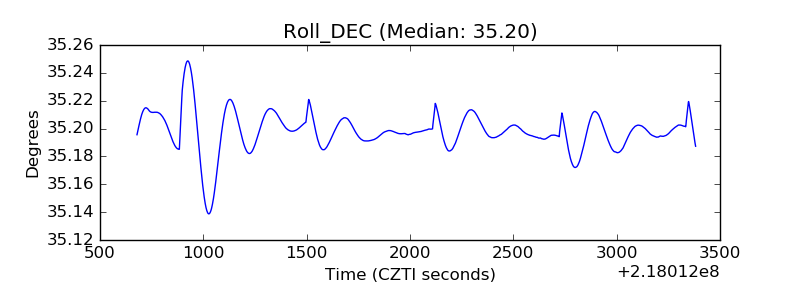 |
| _Roll_RA | 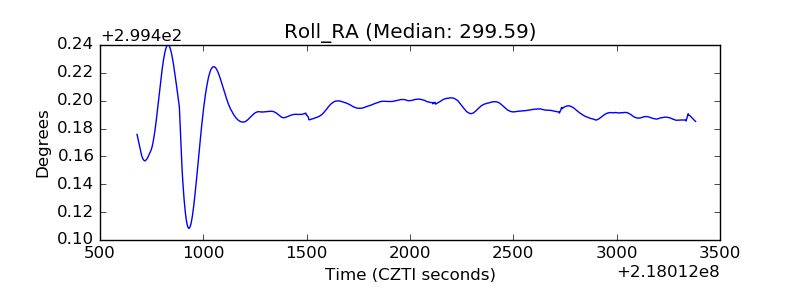 |
| Veto Counter | 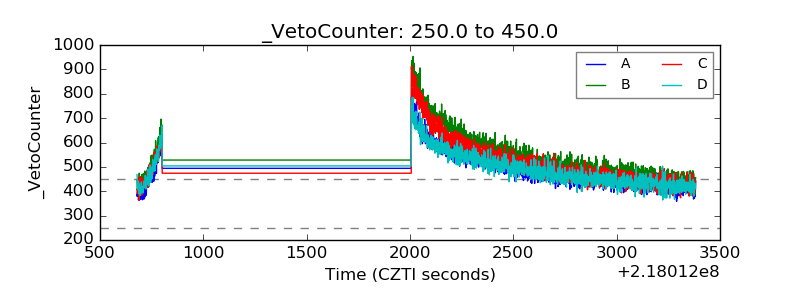 |