| Param | Original file | Final file |
|---|---|---|
| Filename | modeM0/AS1G06_028T01_9000000834_06324cztM0_level2.evt | modeM0/AS1G06_028T01_9000000834_06324cztM0_level2_quad_clean.evt |
| Size (bytes) | 442,408,320 | 106,499,520 |
| Size | 421.9 MB | 101.6 MB |
| Events in quadrant A | 2,932,580 | 724,855 |
| Events in quadrant B | 2,970,375 | 734,390 |
| Events in quadrant C | 2,971,625 | 702,367 |
| Events in quadrant D | 4,133,779 | 662,491 |
| Mode M0 | |||
|---|---|---|---|
| Quadrant | BADHDUFLAG | Total packets | Discarded packets |
| A | 0 | 12197 | 2 |
| B | 0 | 12303 | 1 |
| C | 0 | 12482 | 1 |
| D | 0 | 16109 | 1 |
| Mode SS | |||
|---|---|---|---|
| Quadrant | BADHDUFLAG | Total packets | Discarded packets |
| A | 0 | 116 | 0 |
| B | 0 | 116 | 0 |
| C | 0 | 116 | 0 |
| D | 0 | 116 | 0 |
| Mode M9 | |||
|---|---|---|---|
| Quadrant | BADHDUFLAG | Total packets | Discarded packets |
| A | 0 | 12 | 0 |
| B | 0 | 12 | 0 |
| C | 0 | 12 | 0 |
| D | 0 | 12 | 0 |
| Quadrant | Total seconds | Saturated seconds | Saturation percentage |
|---|---|---|---|
| A | 5746 | 88 | 1.531500% |
| B | 5746 | 85 | 1.479290% |
| C | 5746 | 72 | 1.253046% |
| D | 5746 | 169 | 2.941176% |
Noise dominated data is calculated using 1-second bins in cleaned event files. If a bin has >2000 counts, and if more than 50% of those come from <1% of pixels, then it is considered to be noise-dominated and hence unusable.
| Quadrant | # 1 sec bins | Bins with >0 counts | Bins with >2000 counts | High rate bins dominated by noise | Noise dominated (total time) | Noise dominated (detector-on time) | Marked lightcurve |
|---|---|---|---|---|---|---|---|
| A | 6981 | 5747 | 4 | 4 | 0.06% | 0.07% | 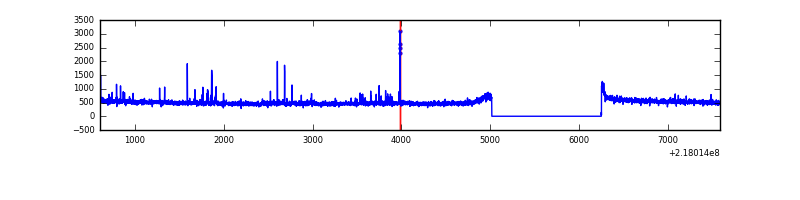 |
| B | 6981 | 5747 | 11 | 11 | 0.16% | 0.19% | 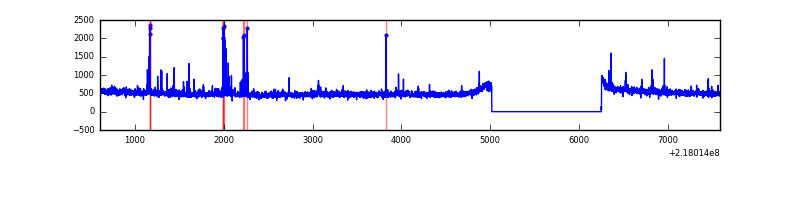 |
| C | 6981 | 5747 | 24 | 24 | 0.34% | 0.42% | 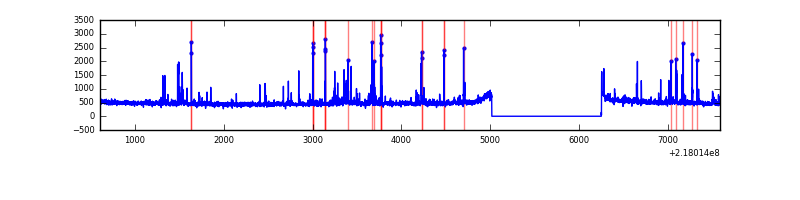 |
| D | 6981 | 5747 | 82 | 82 | 1.17% | 1.43% | 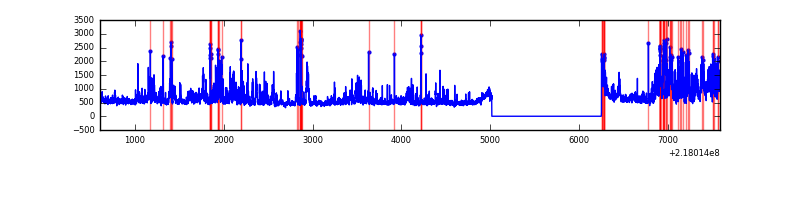 |
Top three noisy pixels from each quadrant. If the there are fewer than three noisy pixels in the level2.evt file, extra rows are filled as -1
| Pixel properties | Quadrant properties | ||||||
|---|---|---|---|---|---|---|---|
| Quadrant | DetID | PixID | Counts | Sigma | Mean | Median | Sigma |
| A | 13 | 251 | 48497 | 320.84 | 732 | 720 | 148.9 |
| A | 8 | 15 | 20802 | 134.86 | 732 | 720 | 148.9 |
| A | 0 | 31 | 20052 | 129.82 | 732 | 720 | 148.9 |
| B | 3 | 64 | 85521 | 612.65 | 729 | 716 | 138.4 |
| B | 4 | 81 | 32280 | 228.03 | 729 | 716 | 138.4 |
| B | 15 | 204 | 31521 | 222.54 | 729 | 716 | 138.4 |
| C | 4 | 254 | 253137 | 1578.15 | 693 | 700 | 160.0 |
| C | 9 | 16 | 12725 | 75.18 | 693 | 700 | 160.0 |
| C | 13 | 61 | 5386 | 29.3 | 693 | 700 | 160.0 |
| D | 12 | 221 | 812895 | 4766.32 | 697 | 678 | 170.4 |
| D | 12 | 220 | 415133 | 2432.14 | 697 | 678 | 170.4 |
| D | 5 | 97 | 75714 | 440.33 | 697 | 678 | 170.4 |
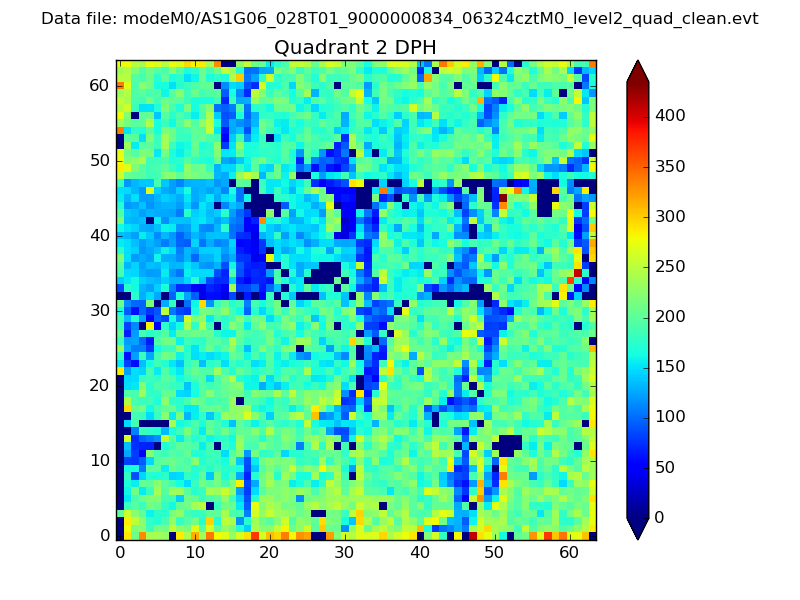
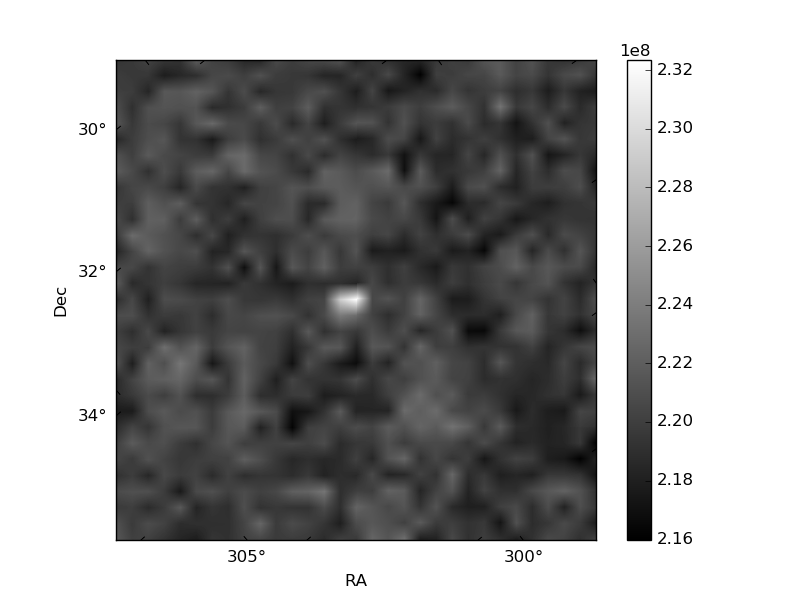
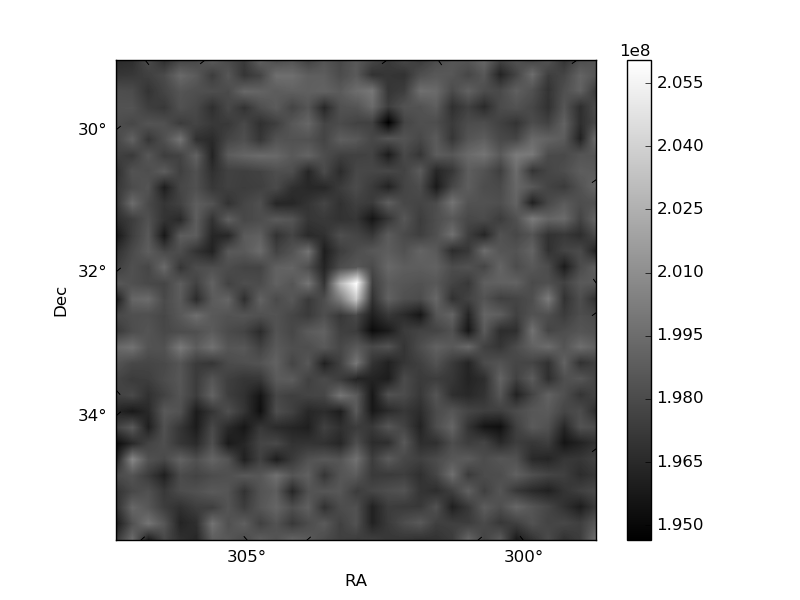
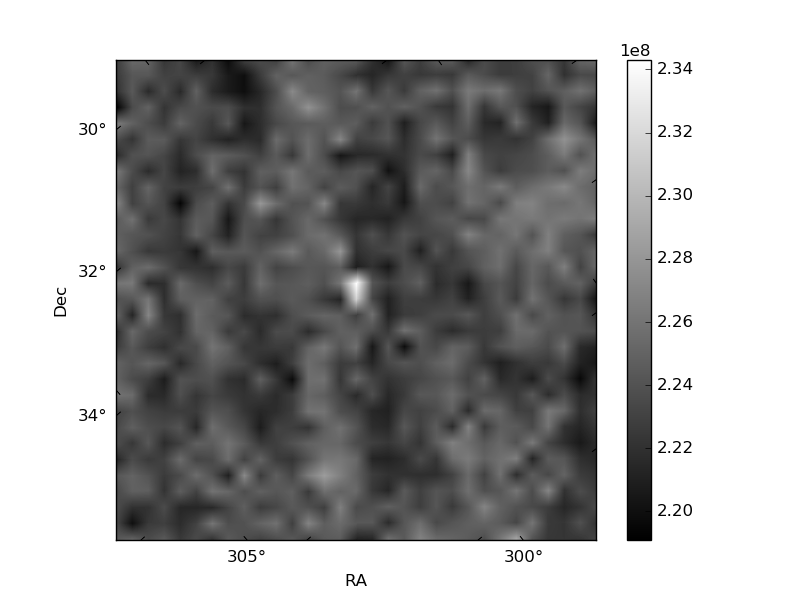
Histogram calculated using DETX and DETY for each event in the final _common_clean file
| Quadrant A |  |
 |
Quadrant B |
|---|---|---|---|
| Quadrant D | 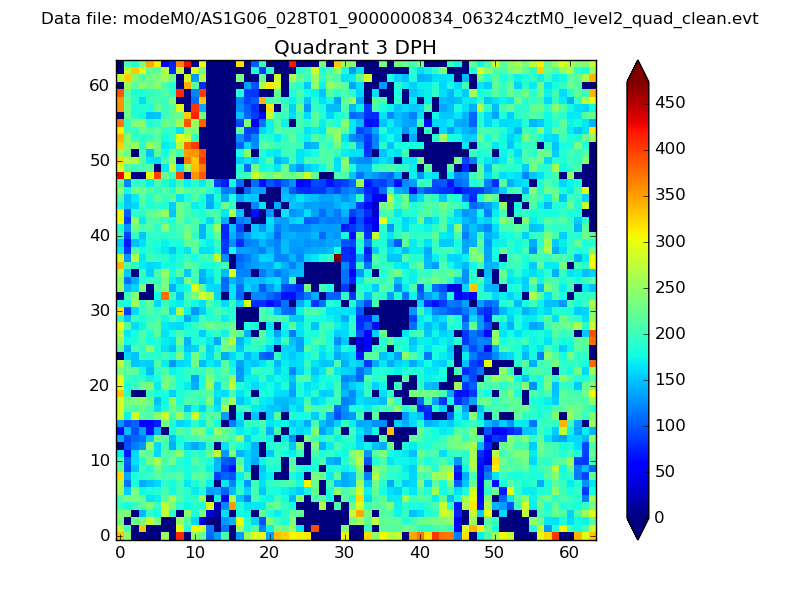 |
 |
Quadrant C |
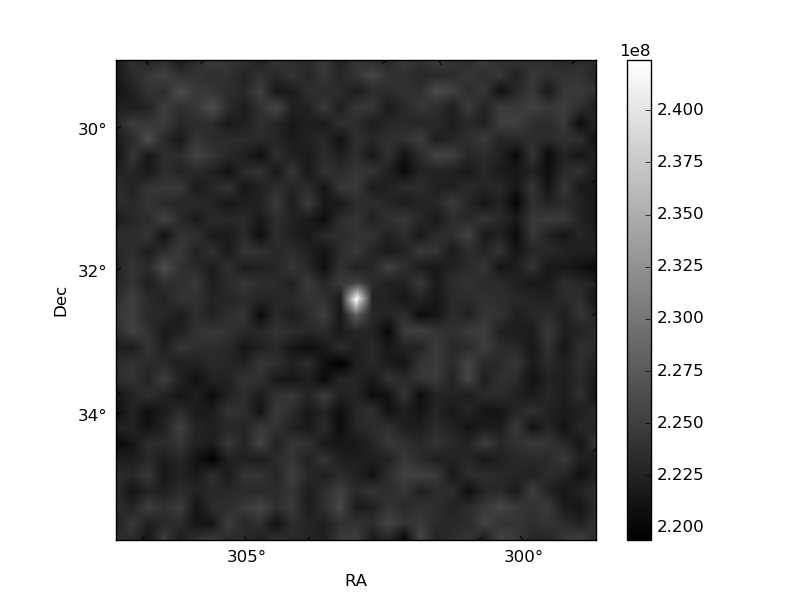
| Plot type | Count rate plots | Images |
|---|---|---|
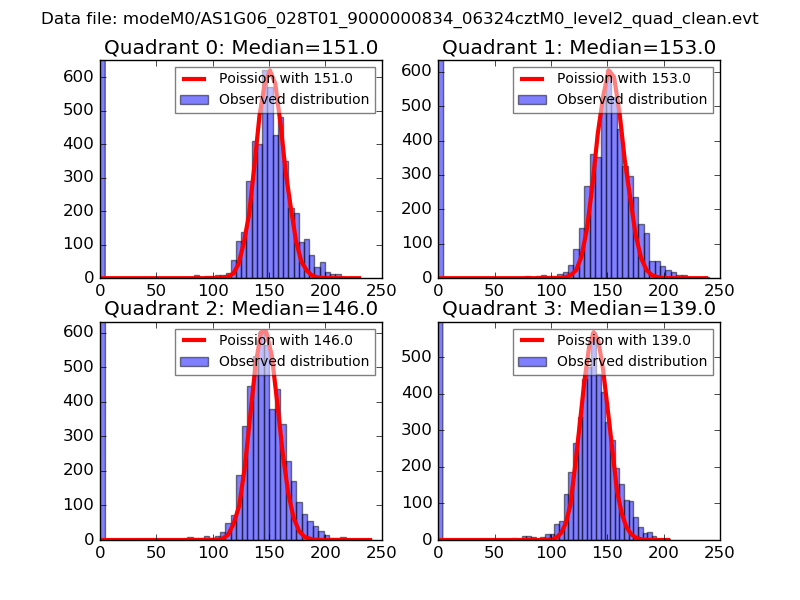
| Comparison with Poisson distribution Blue bars denote a histogram of data divided into 1 sec bins. Red curve is a Poisson curve with rate = median count rate of data. |
 |
 |
| Quadrant-wise count rates Data is divided into 100 sec bins |
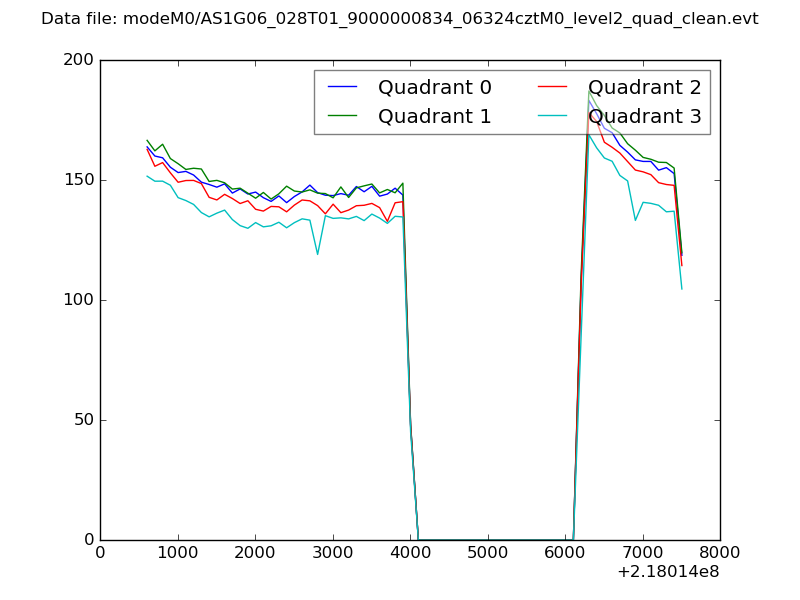 |
|
| Module-wise count rates for Quadrant A Data is divided into 100 sec bins |
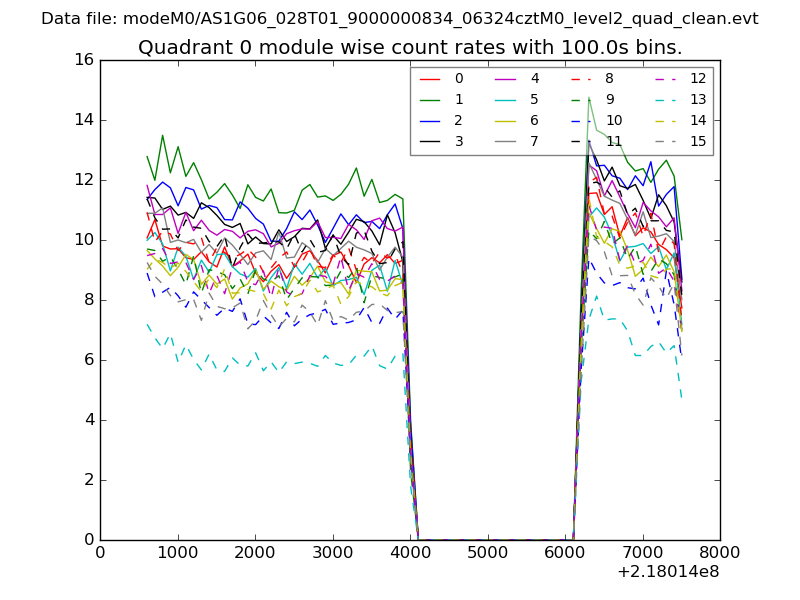 |
 |
| Module-wise count rates for Quadrant B Data is divided into 100 sec bins |
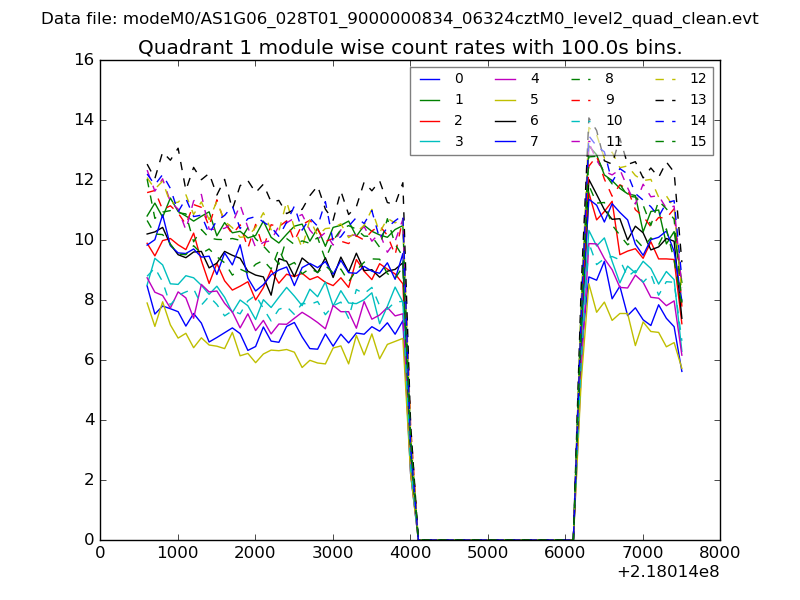 |
 |
| Module-wise count rates for Quadrant C Data is divided into 100 sec bins |
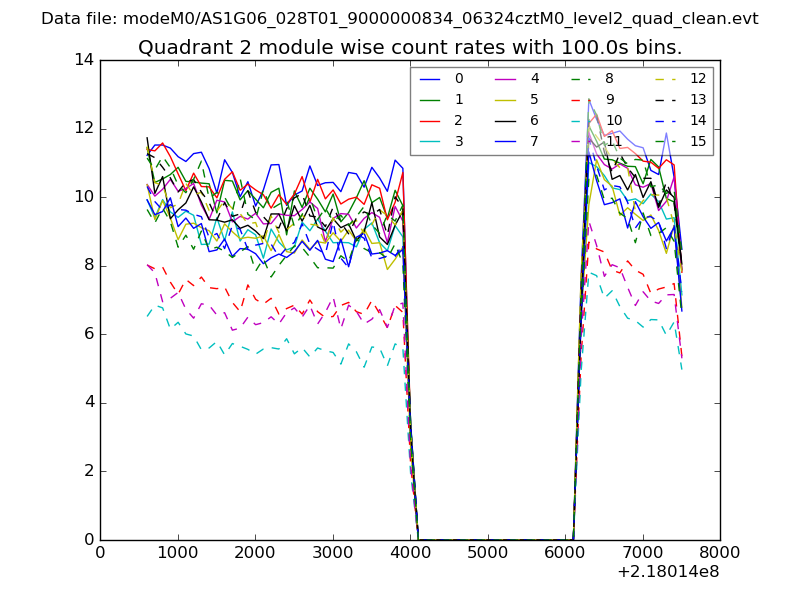 |
 |
| Module-wise count rates for Quadrant D Data is divided into 100 sec bins |
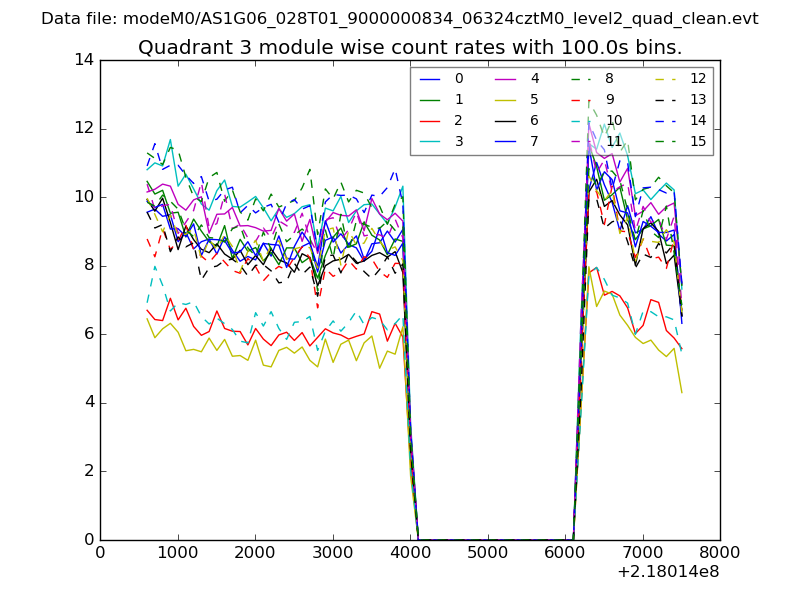 |
 |
| Parameter | Plot |
|---|---|
| CZT HV Monitor | 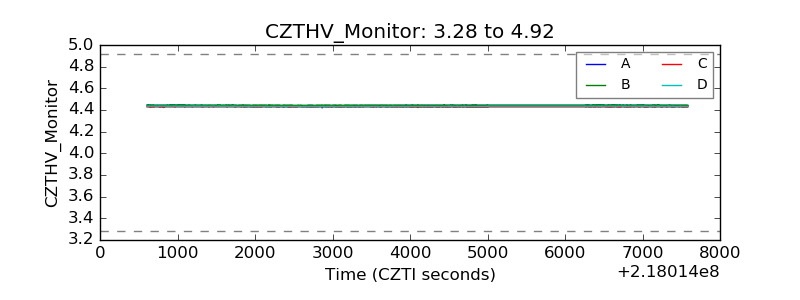 |
| D_VDD | 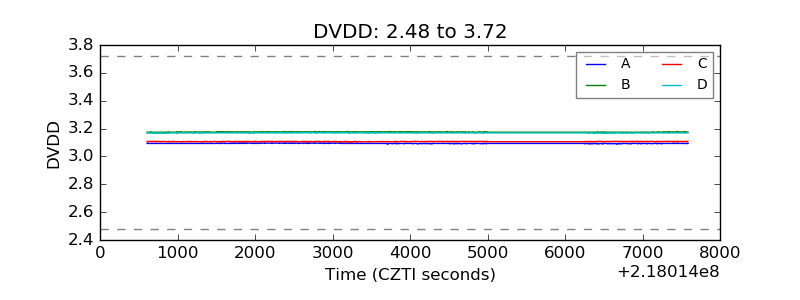 |
| Temperature 1 | 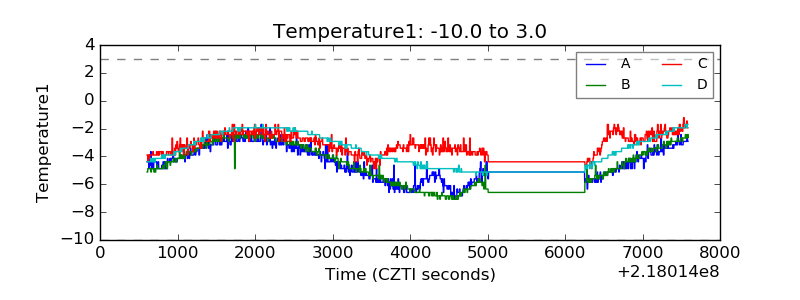 |
| Veto HV Monitor | 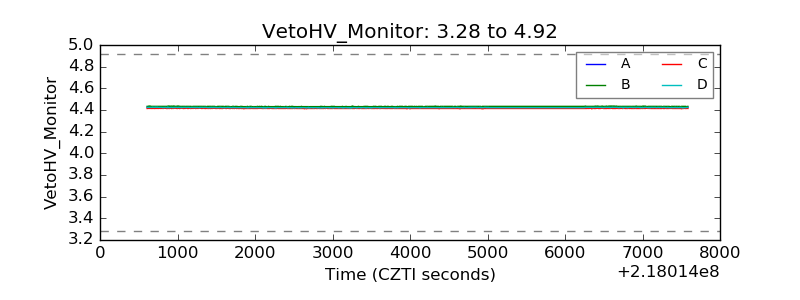 |
| Veto LLD | 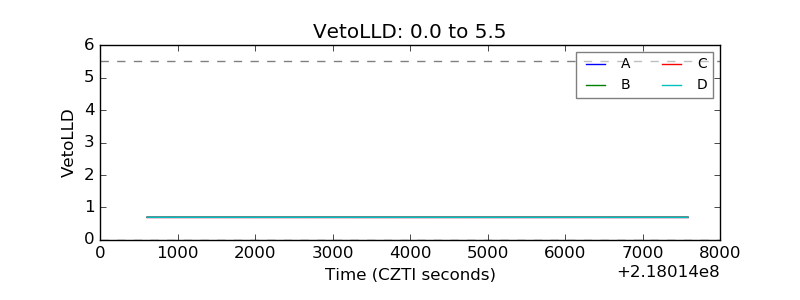 |
| Alpha Counter | 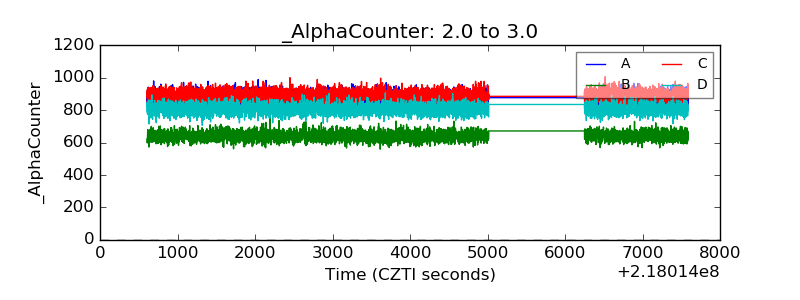 |
| _CPM_Rate | 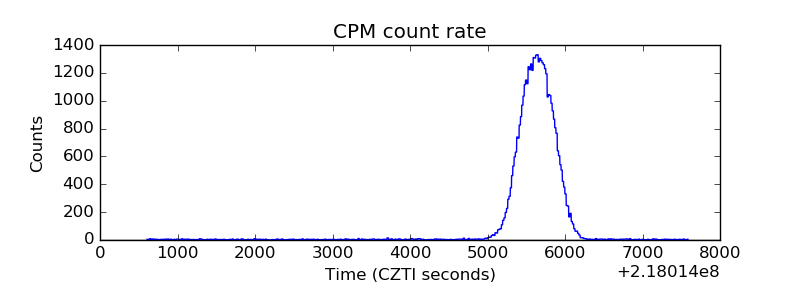 |
| CZT Counter |  |
| +2.5 Volts monitor |  |
| +5 Volts monitor |  |
| _ROLL_ROT | 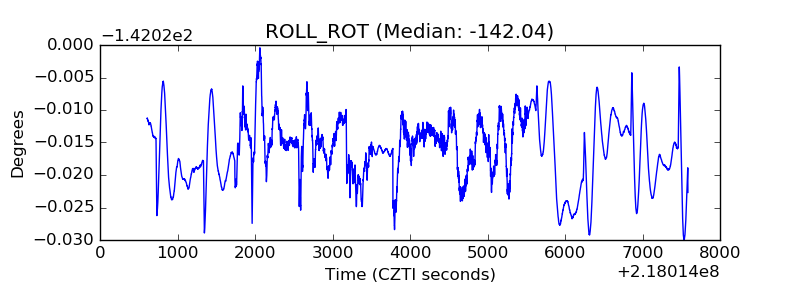 |
| _Roll_DEC | 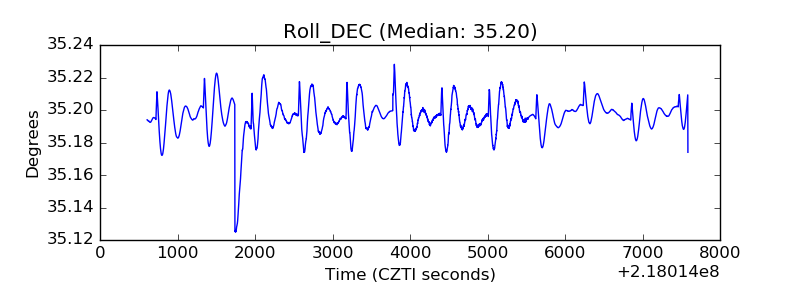 |
| _Roll_RA | 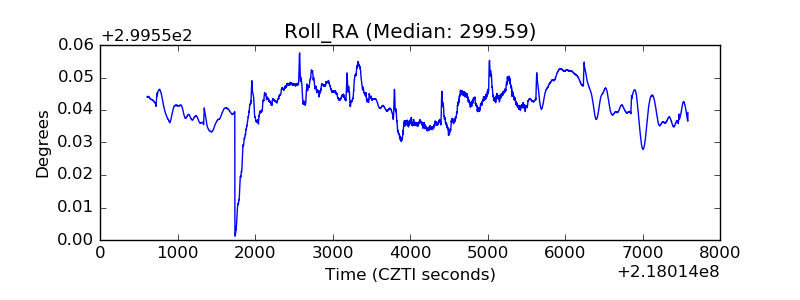 |
| Veto Counter | 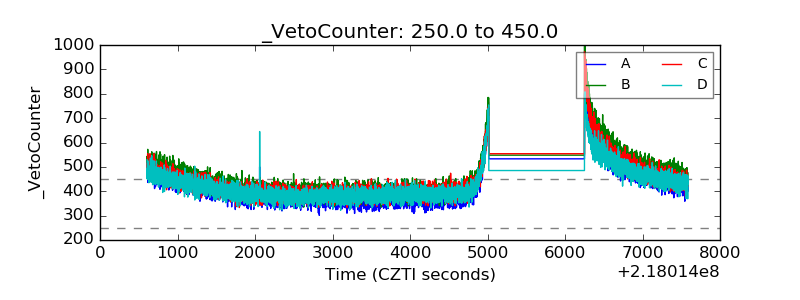 |