| Param | Original file | Final file |
|---|---|---|
| Filename | modeM0/AS1G06_028T01_9000000834_06325cztM0_level2.evt | modeM0/AS1G06_028T01_9000000834_06325cztM0_level2_quad_clean.evt |
| Size (bytes) | 517,919,040 | 97,395,840 |
| Size | 493.9 MB | 92.9 MB |
| Events in quadrant A | 2,951,850 | 662,030 |
| Events in quadrant B | 4,077,113 | 642,543 |
| Events in quadrant C | 2,875,219 | 639,926 |
| Events in quadrant D | 5,386,489 | 598,191 |
| Mode M0 | |||
|---|---|---|---|
| Quadrant | BADHDUFLAG | Total packets | Discarded packets |
| A | 0 | 12378 | 2 |
| B | 0 | 15792 | 1 |
| C | 0 | 12364 | 1 |
| D | 0 | 20035 | 1 |
| Mode SS | |||
|---|---|---|---|
| Quadrant | BADHDUFLAG | Total packets | Discarded packets |
| A | 0 | 116 | 0 |
| B | 0 | 116 | 0 |
| C | 0 | 116 | 0 |
| D | 0 | 116 | 0 |
| Mode M9 | |||
|---|---|---|---|
| Quadrant | BADHDUFLAG | Total packets | Discarded packets |
| A | 0 | 13 | 0 |
| B | 0 | 13 | 0 |
| C | 0 | 13 | 0 |
| D | 0 | 13 | 0 |
| Quadrant | Total seconds | Saturated seconds | Saturation percentage |
|---|---|---|---|
| A | 5830 | 128 | 2.195540% |
| B | 5830 | 424 | 7.272727% |
| C | 5830 | 105 | 1.801029% |
| D | 5830 | 223 | 3.825043% |
Noise dominated data is calculated using 1-second bins in cleaned event files. If a bin has >2000 counts, and if more than 50% of those come from <1% of pixels, then it is considered to be noise-dominated and hence unusable.
| Quadrant | # 1 sec bins | Bins with >0 counts | Bins with >2000 counts | High rate bins dominated by noise | Noise dominated (total time) | Noise dominated (detector-on time) | Marked lightcurve |
|---|---|---|---|---|---|---|---|
| A | 7065 | 5831 | 4 | 4 | 0.06% | 0.07% | 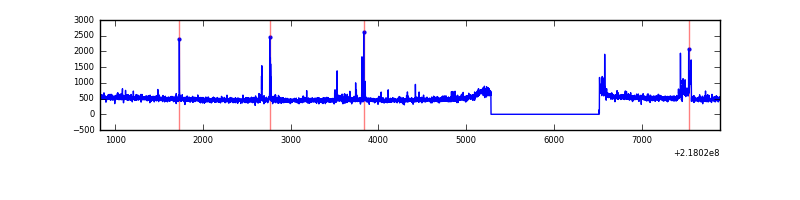 |
| B | 7065 | 5831 | 283 | 283 | 4.01% | 4.85% | 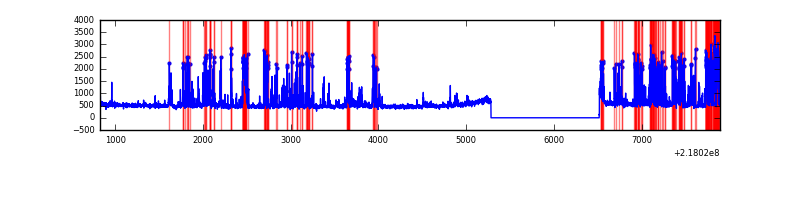 |
| C | 7065 | 5831 | 31 | 31 | 0.44% | 0.53% | 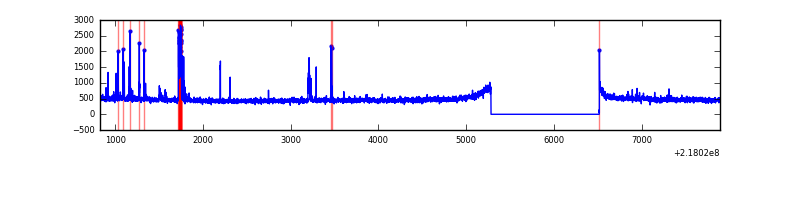 |
| D | 7065 | 5831 | 166 | 166 | 2.35% | 2.85% | 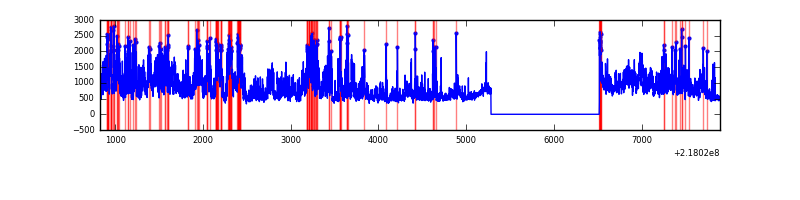 |
Top three noisy pixels from each quadrant. If the there are fewer than three noisy pixels in the level2.evt file, extra rows are filled as -1
| Pixel properties | Quadrant properties | ||||||
|---|---|---|---|---|---|---|---|
| Quadrant | DetID | PixID | Counts | Sigma | Mean | Median | Sigma |
| A | 14 | 111 | 52065 | 341.94 | 732 | 719 | 150.2 |
| A | 13 | 251 | 48666 | 319.31 | 732 | 719 | 150.2 |
| A | 8 | 15 | 25919 | 167.82 | 732 | 719 | 150.2 |
| B | 3 | 64 | 1168851 | 8569.74 | 713 | 701 | 136.3 |
| B | 4 | 81 | 121698 | 887.65 | 713 | 701 | 136.3 |
| B | 15 | 204 | 30099 | 215.67 | 713 | 701 | 136.3 |
| C | 4 | 254 | 139372 | 866.87 | 695 | 701 | 160.0 |
| C | 9 | 16 | 21895 | 132.49 | 695 | 701 | 160.0 |
| C | 13 | 61 | 5519 | 30.12 | 695 | 701 | 160.0 |
| D | 12 | 221 | 1700564 | 9823.55 | 700 | 681 | 173.0 |
| D | 12 | 220 | 726825 | 4196.36 | 700 | 681 | 173.0 |
| D | 4 | 95 | 86720 | 497.22 | 700 | 681 | 173.0 |
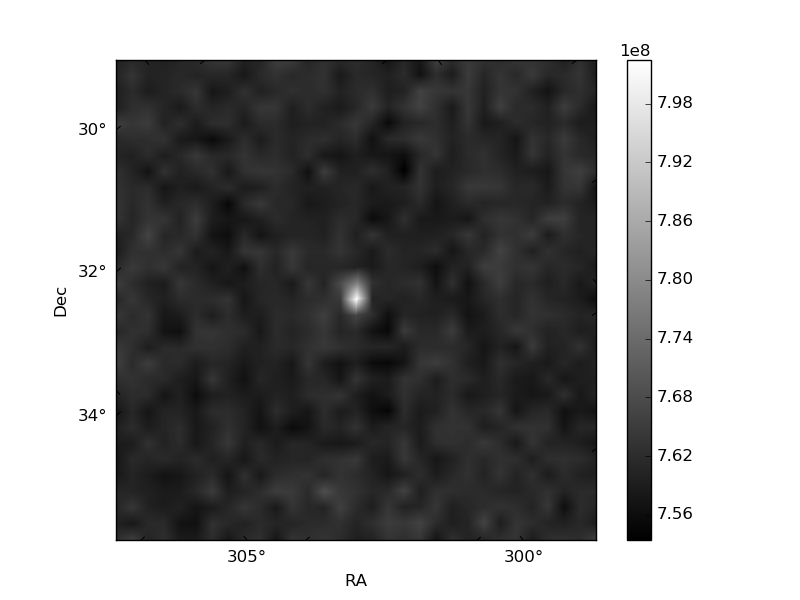
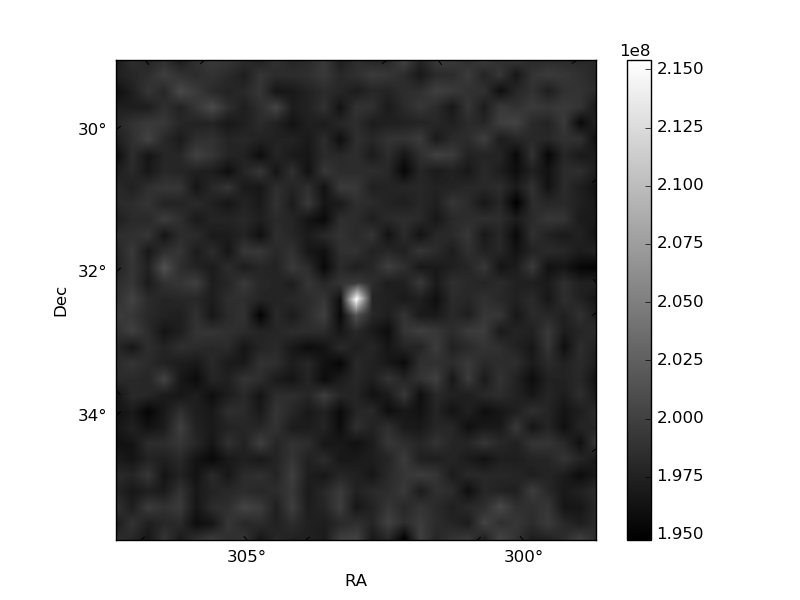
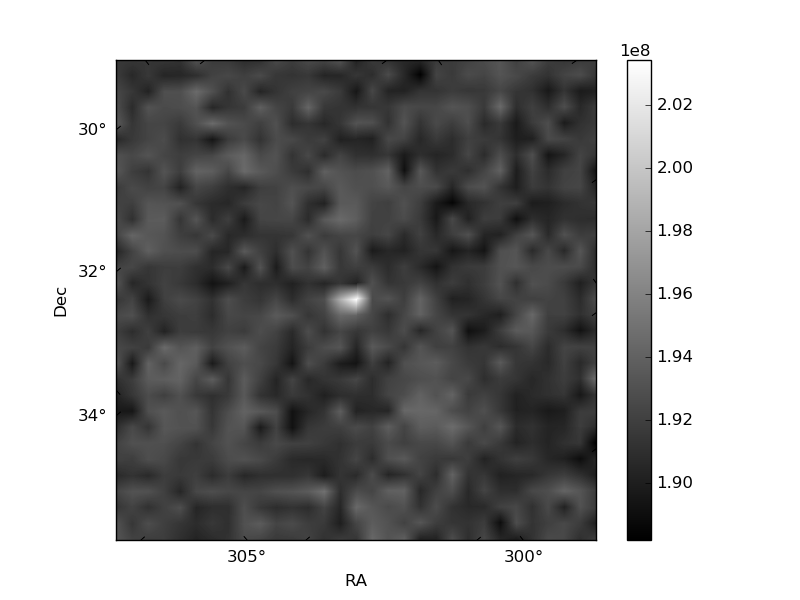
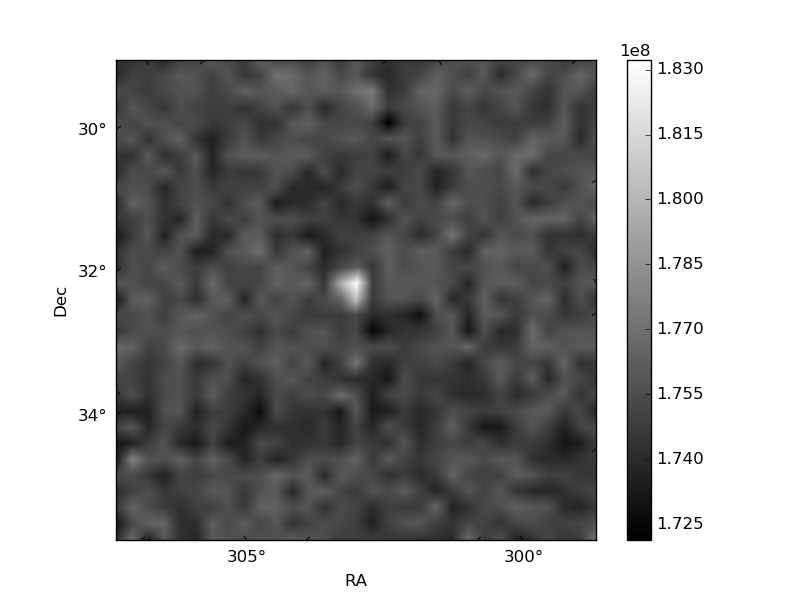
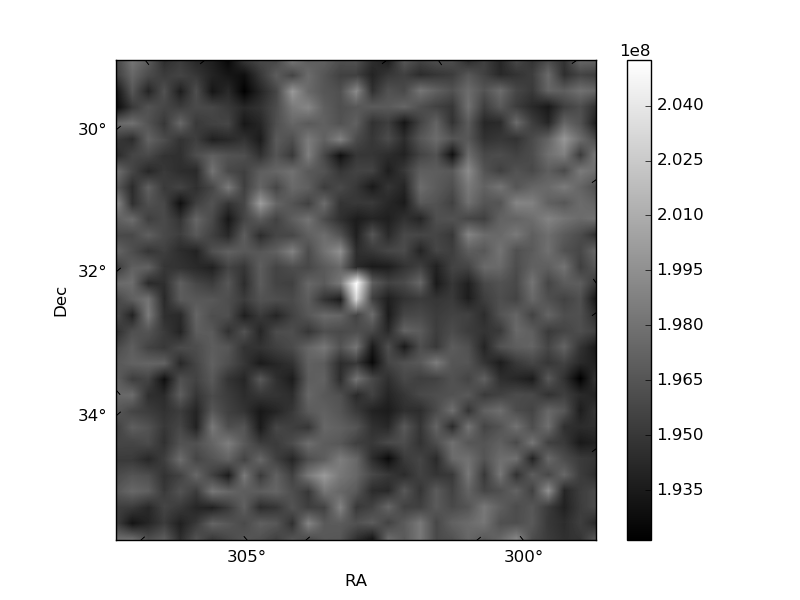
Histogram calculated using DETX and DETY for each event in the final _common_clean file
| Quadrant A | 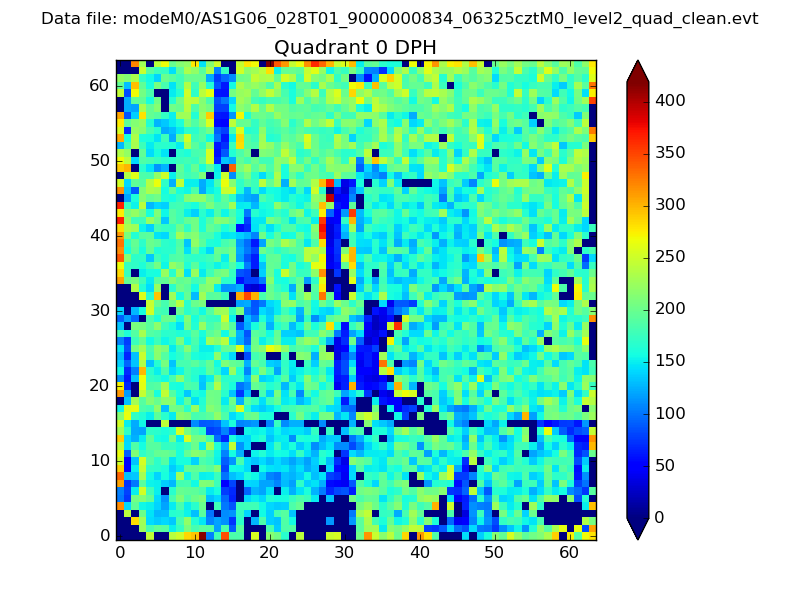 |
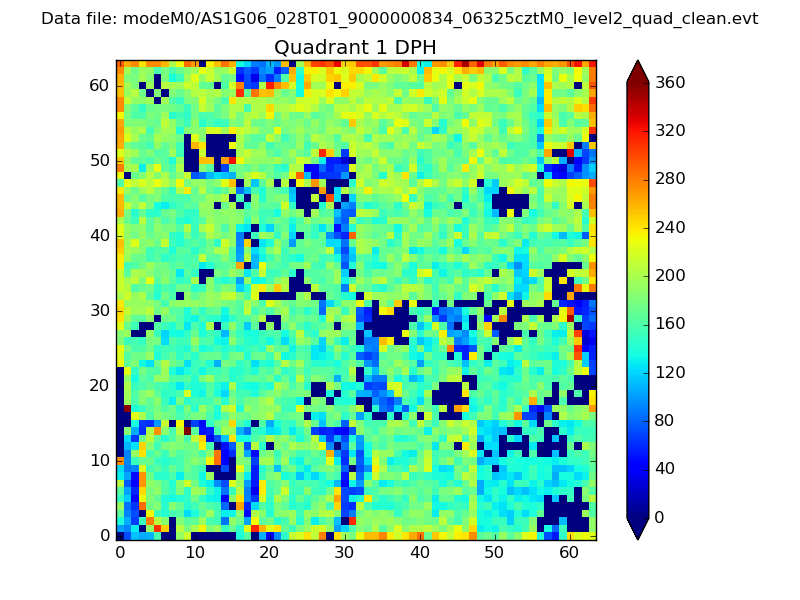 |
Quadrant B |
|---|---|---|---|
| Quadrant D | 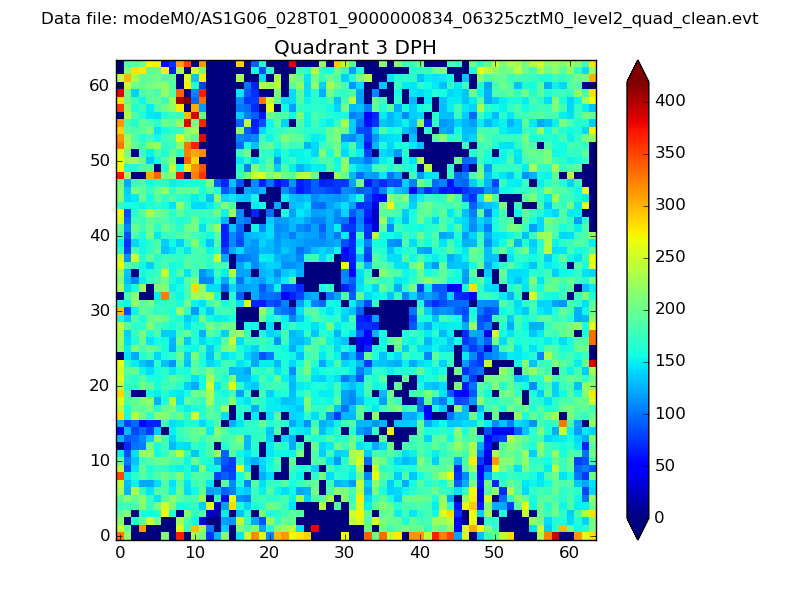 |
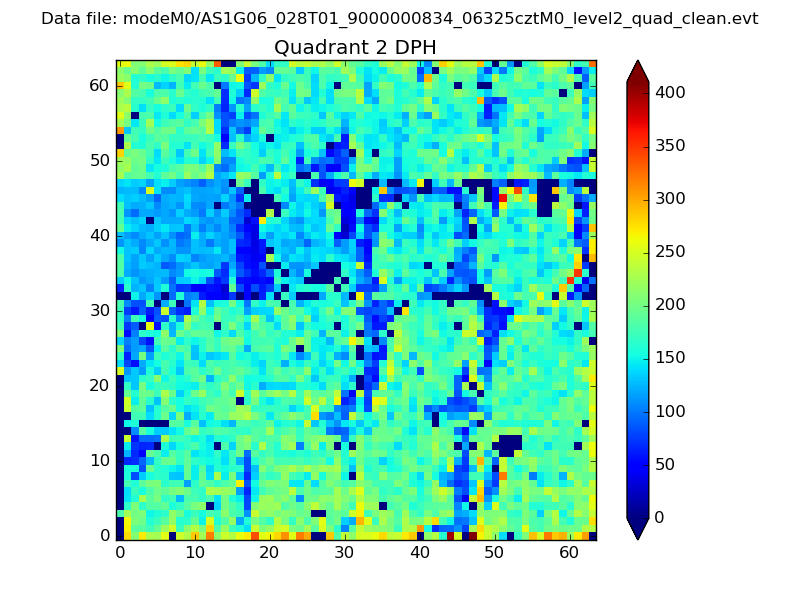 |
Quadrant C |
| Plot type | Count rate plots | Images |
|---|---|---|
| Comparison with Poisson distribution Blue bars denote a histogram of data divided into 1 sec bins. Red curve is a Poisson curve with rate = median count rate of data. |
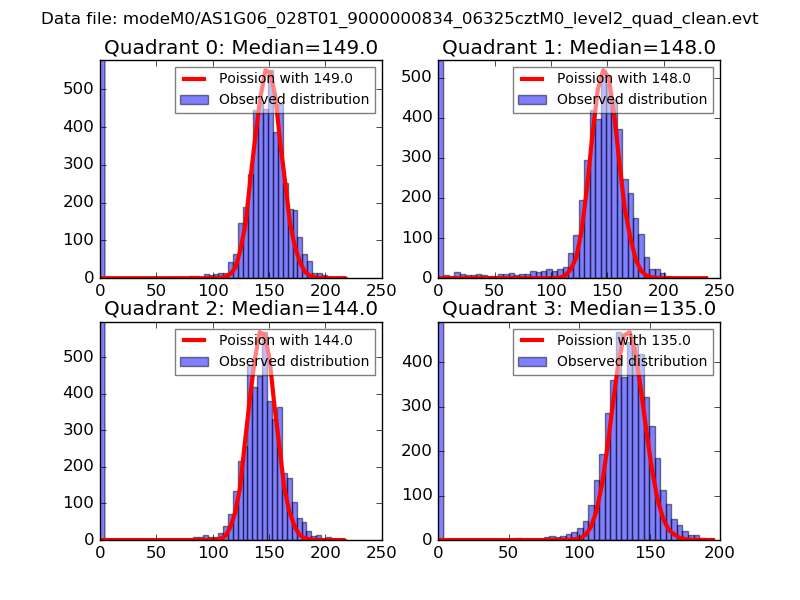 |
 |
| Quadrant-wise count rates Data is divided into 100 sec bins |
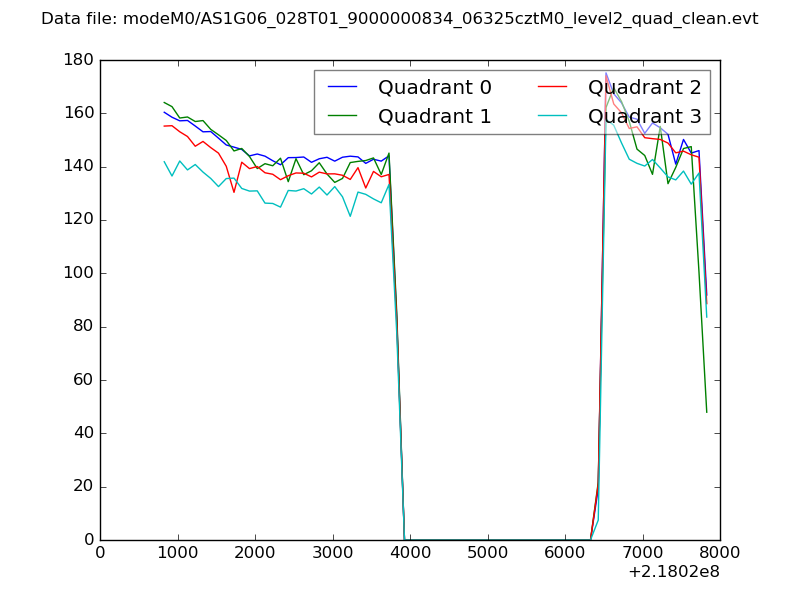 |
|
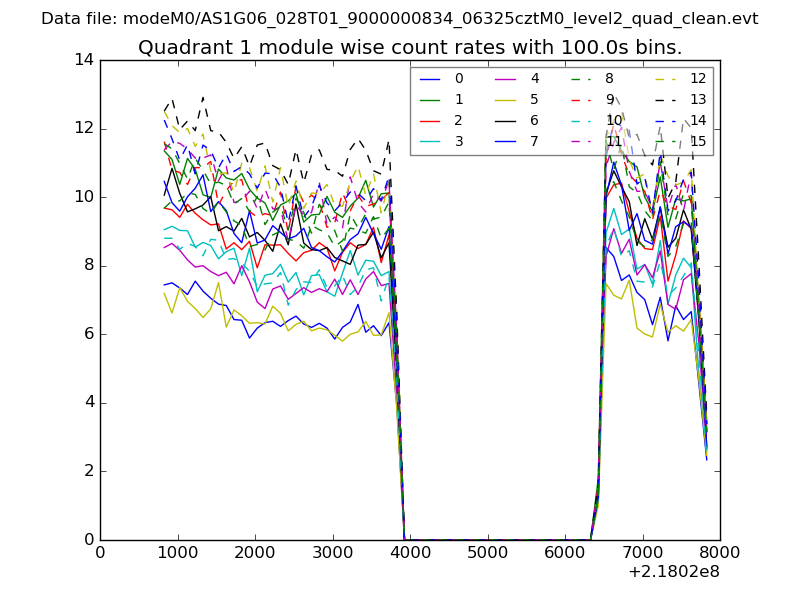
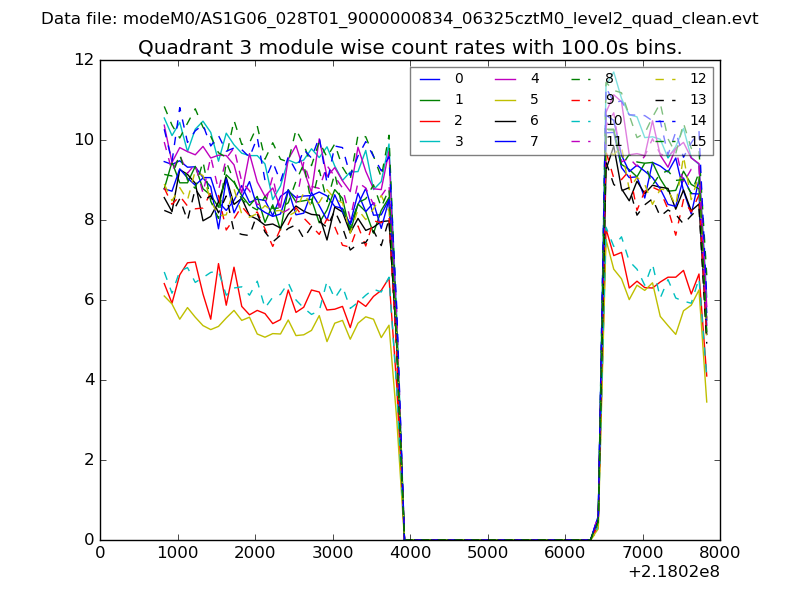
| Module-wise count rates for Quadrant A Data is divided into 100 sec bins |
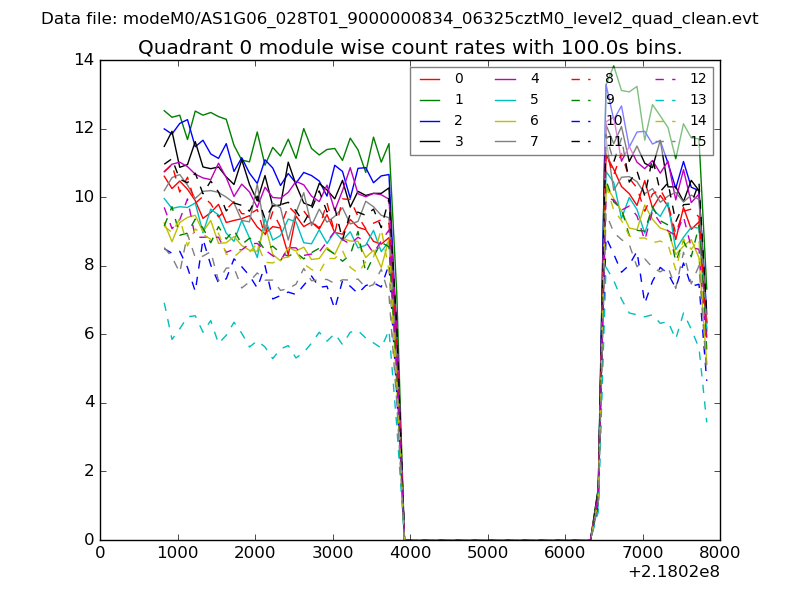 |
 |
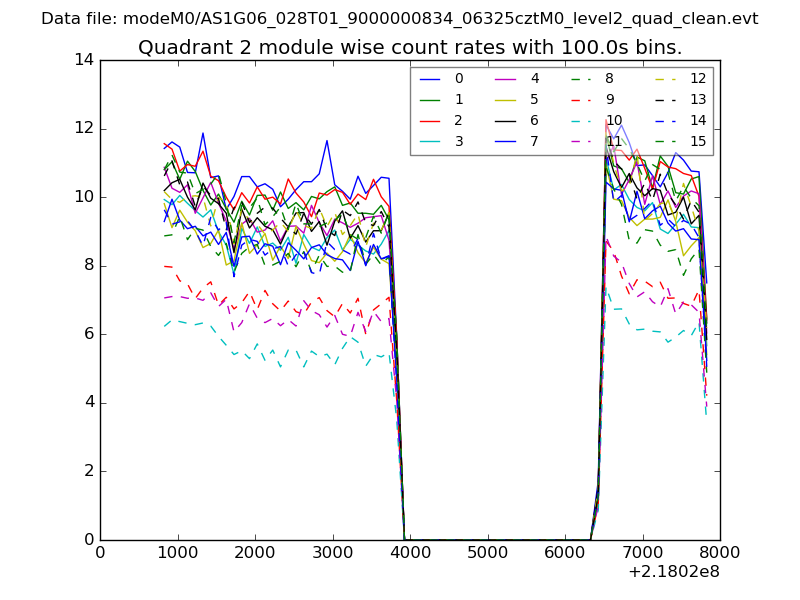
| Module-wise count rates for Quadrant B Data is divided into 100 sec bins |
 |
 |
| Module-wise count rates for Quadrant C Data is divided into 100 sec bins |
 |
 |
| Module-wise count rates for Quadrant D Data is divided into 100 sec bins |
 |
 |
| Parameter | Plot |
|---|---|
| CZT HV Monitor | 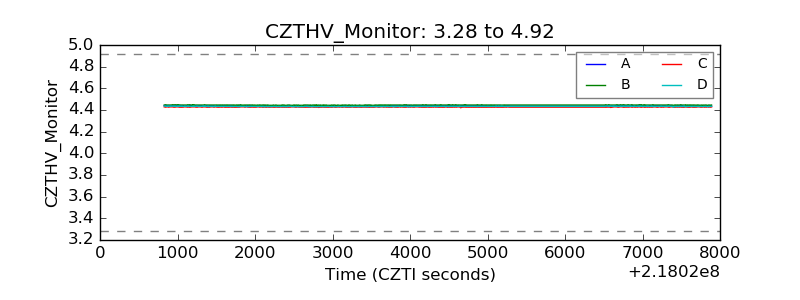 |
| D_VDD |  |
| Temperature 1 | 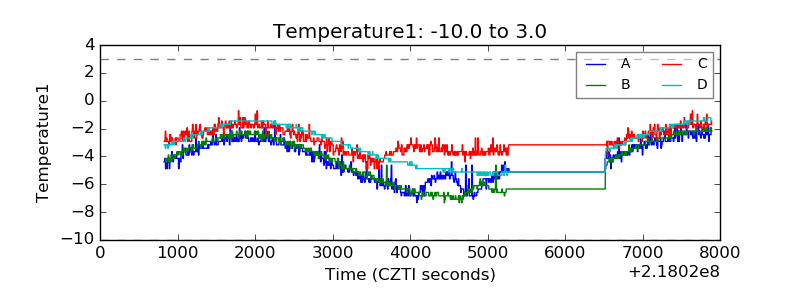 |
| Veto HV Monitor |  |
| Veto LLD | 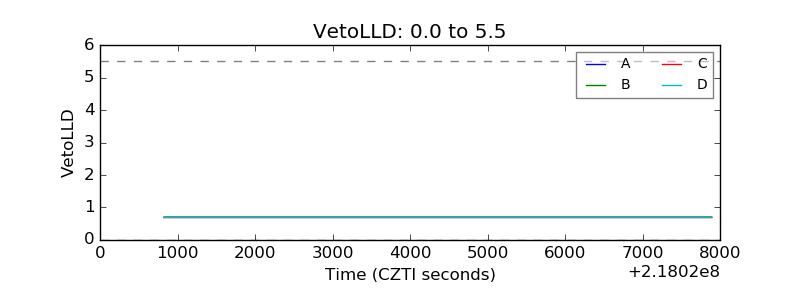 |
| Alpha Counter | 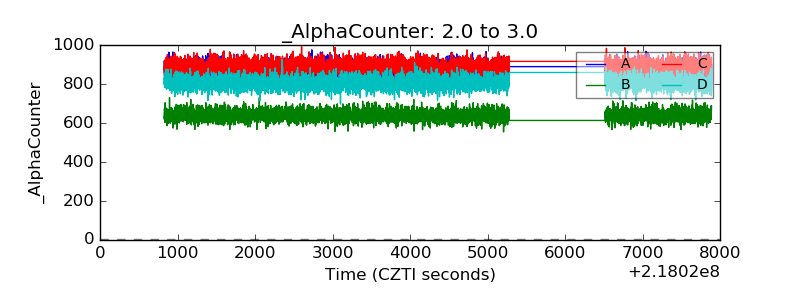 |
| _CPM_Rate | 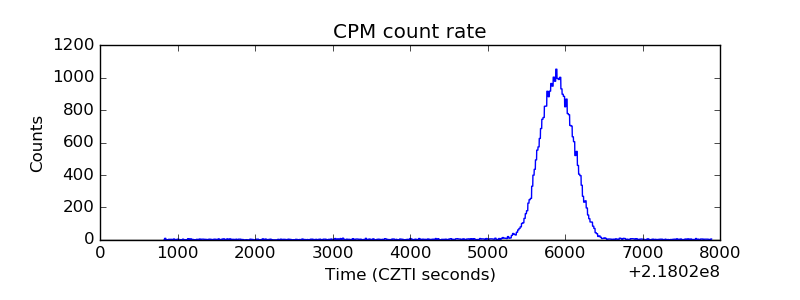 |
| CZT Counter | 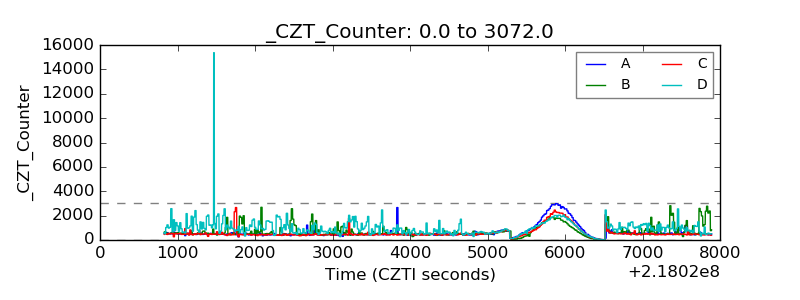 |
| +2.5 Volts monitor |  |
| +5 Volts monitor |  |
| _ROLL_ROT | 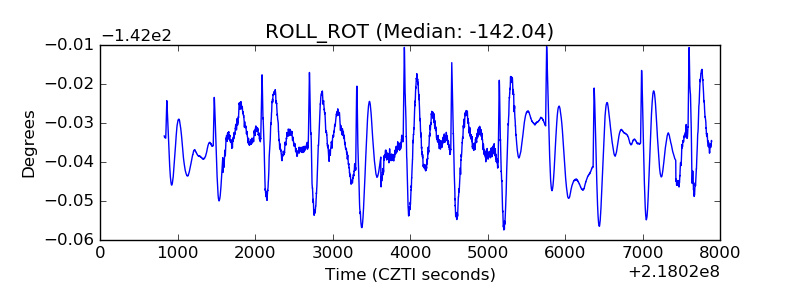 |
| _Roll_DEC | 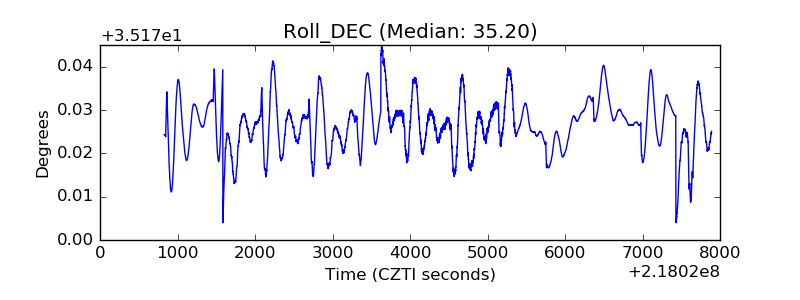 |
| _Roll_RA | 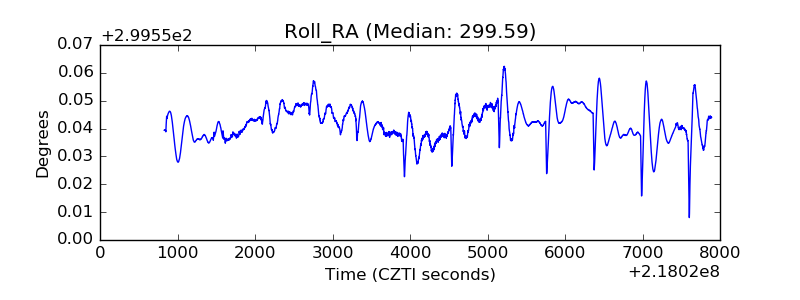 |
| Veto Counter | 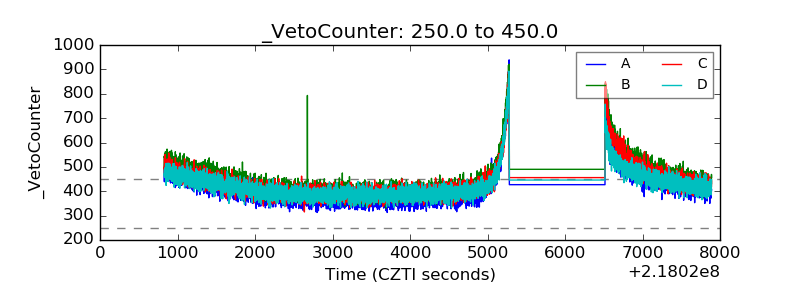 |