| Param | Original file | Final file |
|---|---|---|
| Filename | modeM0/AS1G06_028T01_9000000834_06326cztM0_level2.evt | modeM0/AS1G06_028T01_9000000834_06326cztM0_level2_quad_clean.evt |
| Size (bytes) | 528,995,520 | 86,978,880 |
| Size | 504.5 MB | 82.9 MB |
| Events in quadrant A | 3,011,050 | 579,223 |
| Events in quadrant B | 4,513,546 | 561,628 |
| Events in quadrant C | 2,751,665 | 566,302 |
| Events in quadrant D | 5,345,196 | 515,357 |
| Mode M0 | |||
|---|---|---|---|
| Quadrant | BADHDUFLAG | Total packets | Discarded packets |
| A | 0 | 12725 | 2 |
| B | 0 | 17285 | 1 |
| C | 0 | 12154 | 1 |
| D | 0 | 19940 | 1 |
| Mode SS | |||
|---|---|---|---|
| Quadrant | BADHDUFLAG | Total packets | Discarded packets |
| A | 0 | 120 | 0 |
| B | 0 | 120 | 0 |
| C | 0 | 120 | 0 |
| D | 0 | 120 | 0 |
| Mode M9 | |||
|---|---|---|---|
| Quadrant | BADHDUFLAG | Total packets | Discarded packets |
| A | 0 | 12 | 0 |
| B | 0 | 12 | 0 |
| C | 0 | 12 | 0 |
| D | 0 | 12 | 0 |
| Quadrant | Total seconds | Saturated seconds | Saturation percentage |
|---|---|---|---|
| A | 5884 | 147 | 2.498300% |
| B | 5884 | 554 | 9.415364% |
| C | 5884 | 63 | 1.070700% |
| D | 5884 | 519 | 8.820530% |
Noise dominated data is calculated using 1-second bins in cleaned event files. If a bin has >2000 counts, and if more than 50% of those come from <1% of pixels, then it is considered to be noise-dominated and hence unusable.
| Quadrant | # 1 sec bins | Bins with >0 counts | Bins with >2000 counts | High rate bins dominated by noise | Noise dominated (total time) | Noise dominated (detector-on time) | Marked lightcurve |
|---|---|---|---|---|---|---|---|
| A | 7034 | 5885 | 11 | 11 | 0.16% | 0.19% | 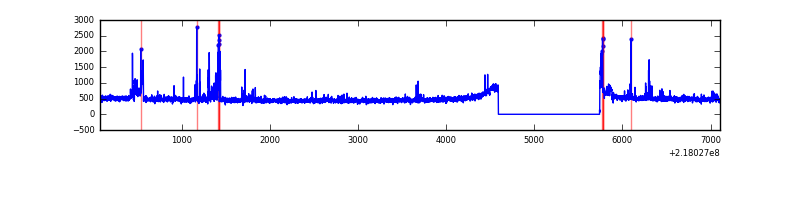 |
| B | 7034 | 5885 | 354 | 354 | 5.03% | 6.02% | 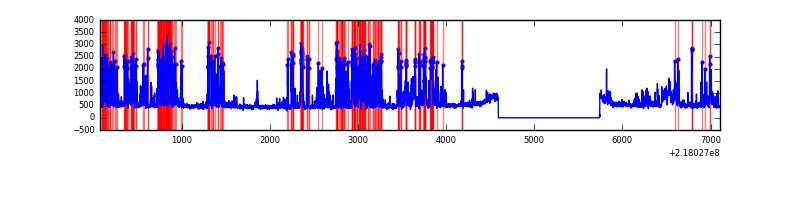 |
| C | 7034 | 5885 | 2 | 2 | 0.03% | 0.03% | 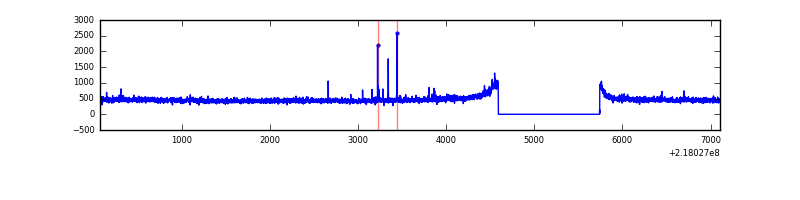 |
| D | 7034 | 5885 | 436 | 436 | 6.20% | 7.41% | 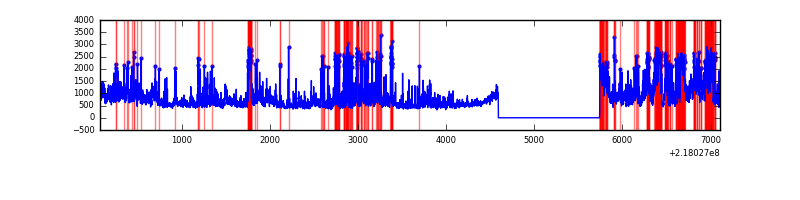 |
Top three noisy pixels from each quadrant. If the there are fewer than three noisy pixels in the level2.evt file, extra rows are filled as -1
| Pixel properties | Quadrant properties | ||||||
|---|---|---|---|---|---|---|---|
| Quadrant | DetID | PixID | Counts | Sigma | Mean | Median | Sigma |
| A | 13 | 251 | 143483 | 959.72 | 722 | 708 | 148.8 |
| A | 14 | 111 | 50948 | 337.71 | 722 | 708 | 148.8 |
| A | 8 | 15 | 30813 | 202.36 | 722 | 708 | 148.8 |
| B | 3 | 64 | 1603234 | 12079.92 | 699 | 685 | 132.7 |
| B | 4 | 81 | 173366 | 1301.66 | 699 | 685 | 132.7 |
| B | 15 | 204 | 28612 | 210.51 | 699 | 685 | 132.7 |
| C | 4 | 254 | 31681 | 191.86 | 695 | 701 | 161.5 |
| C | 13 | 61 | 5334 | 28.69 | 695 | 701 | 161.5 |
| C | 8 | 128 | 2635 | 11.98 | 695 | 701 | 161.5 |
| D | 12 | 220 | 1254536 | 7450.5 | 683 | 662 | 168.3 |
| D | 12 | 221 | 960616 | 5704.03 | 683 | 662 | 168.3 |
| D | 2 | 63 | 165796 | 981.22 | 683 | 662 | 168.3 |
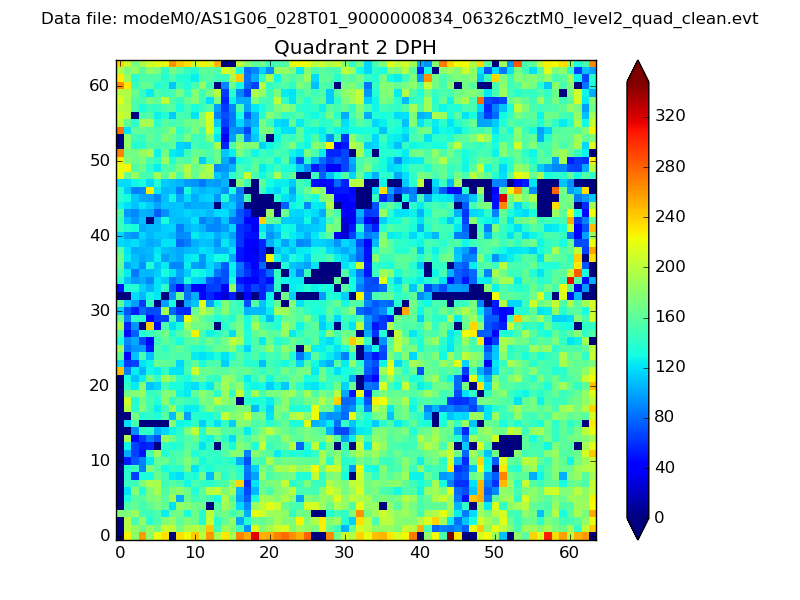
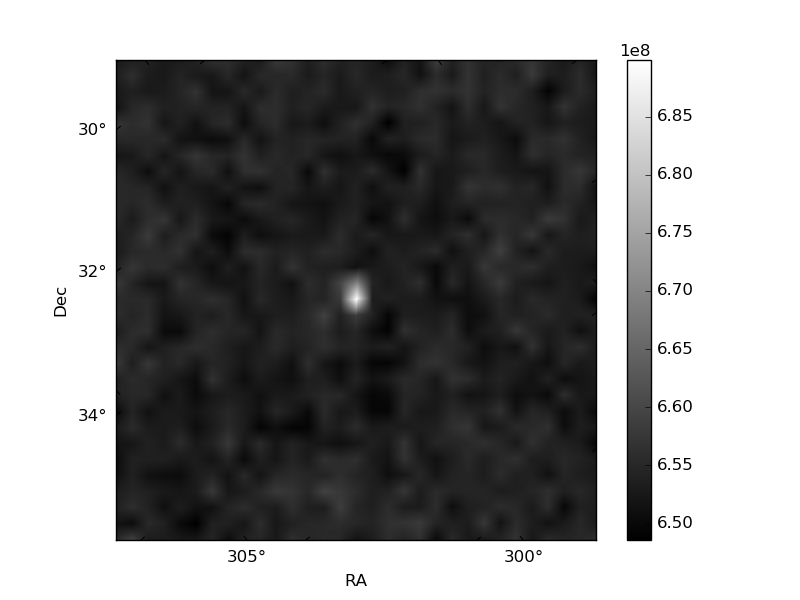
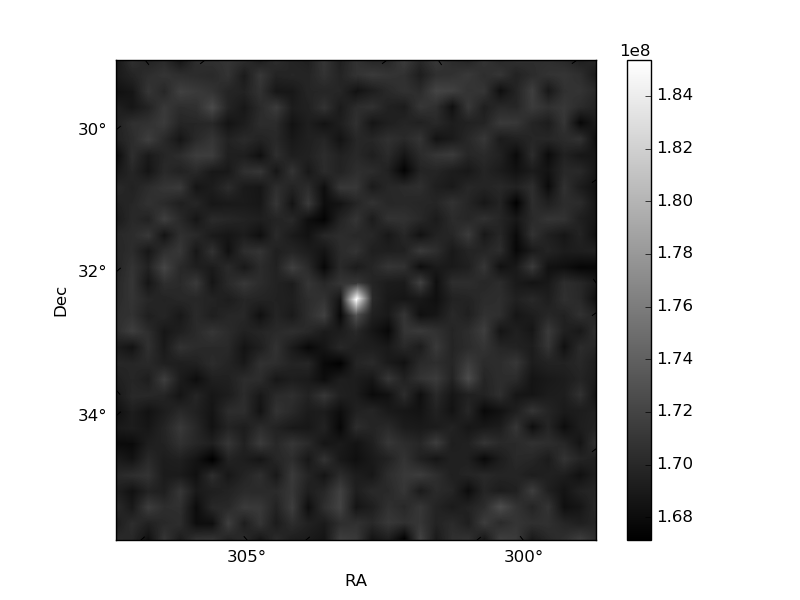
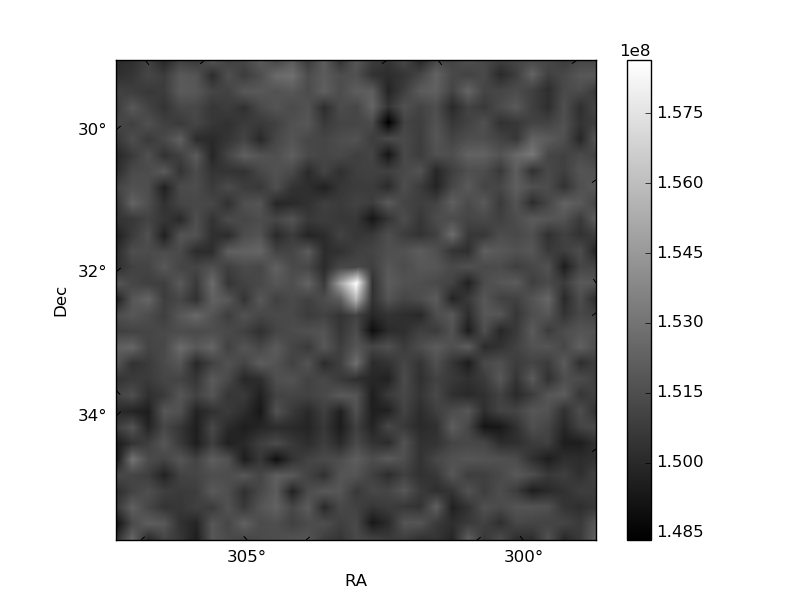
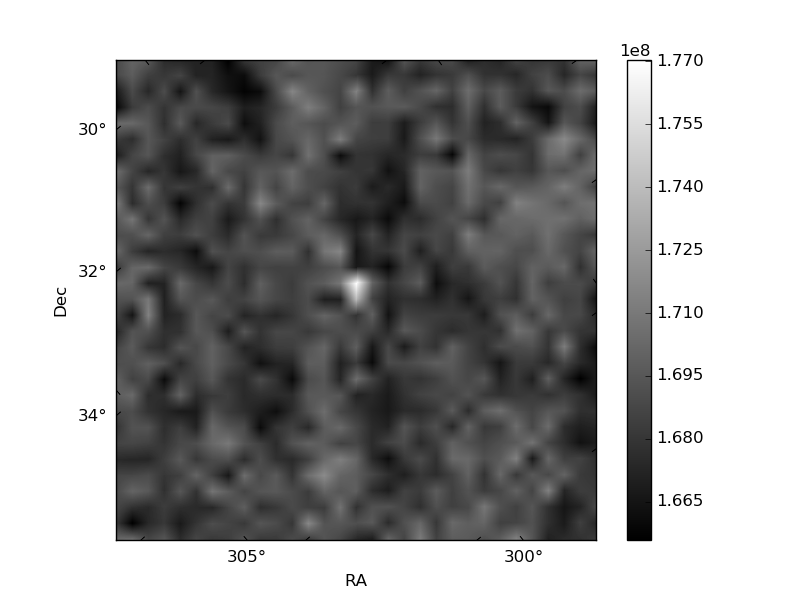
Histogram calculated using DETX and DETY for each event in the final _common_clean file
| Quadrant A | 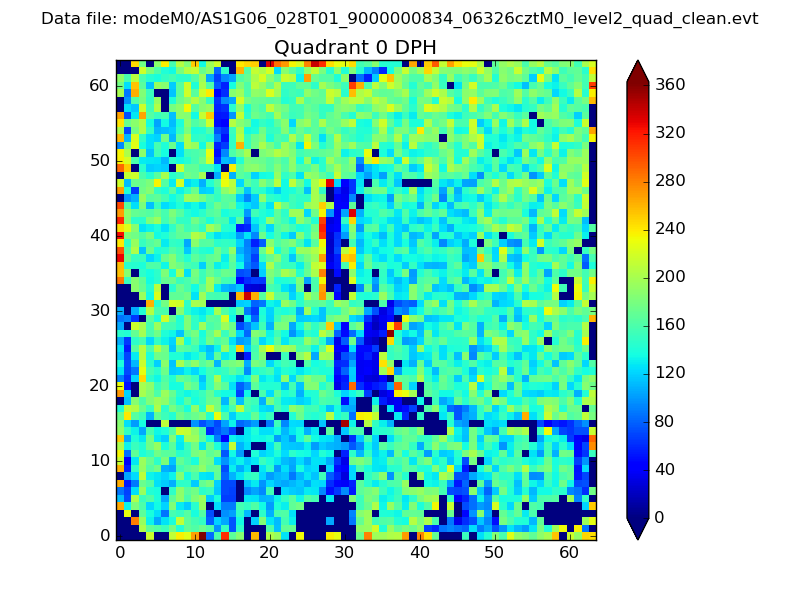 |
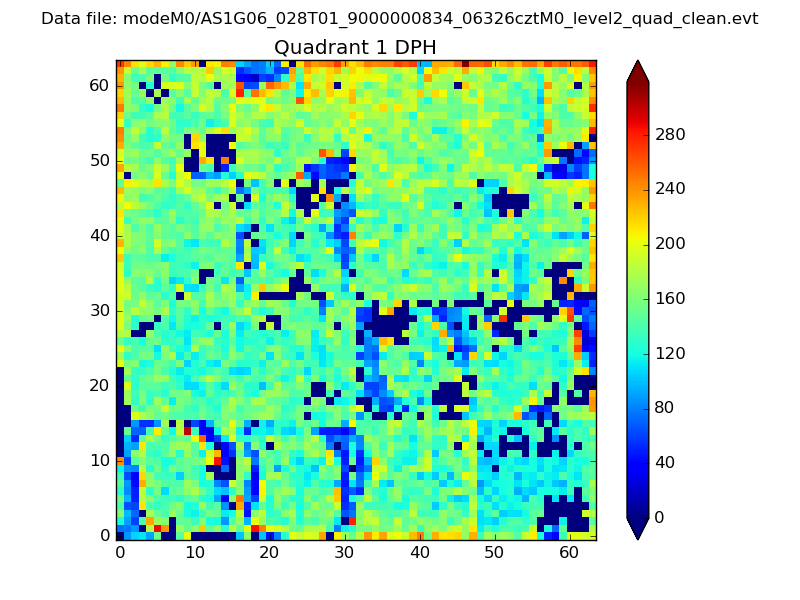 |
Quadrant B |
|---|---|---|---|
| Quadrant D | 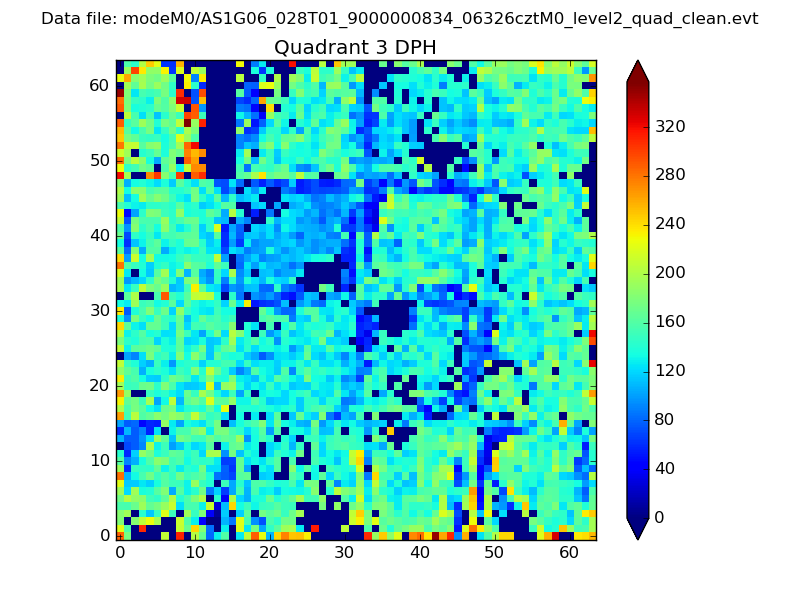 |
 |
Quadrant C |
| Plot type | Count rate plots | Images |
|---|---|---|
| Comparison with Poisson distribution Blue bars denote a histogram of data divided into 1 sec bins. Red curve is a Poisson curve with rate = median count rate of data. |
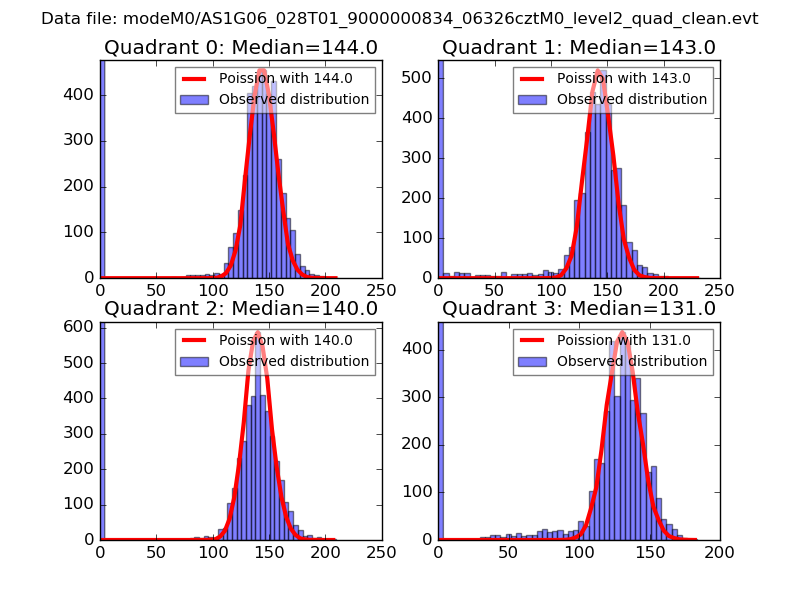 |
 |
| Quadrant-wise count rates Data is divided into 100 sec bins |
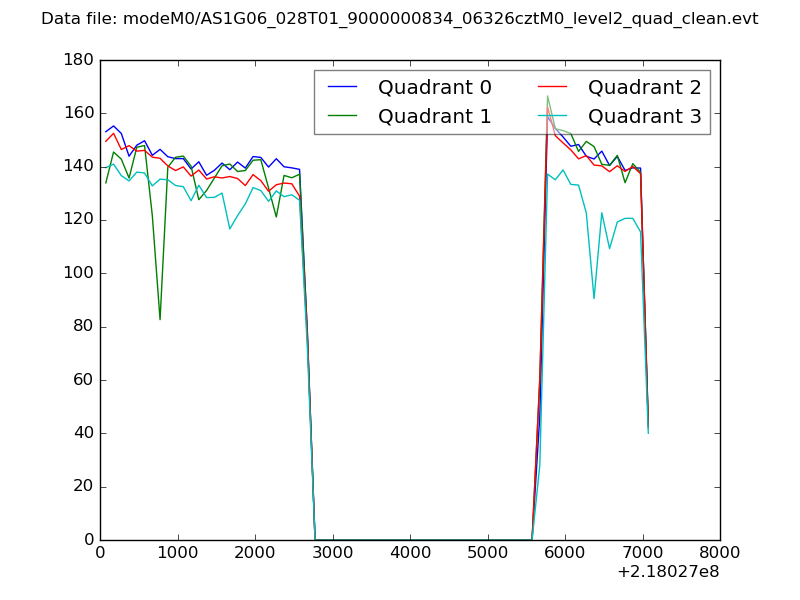 |
|
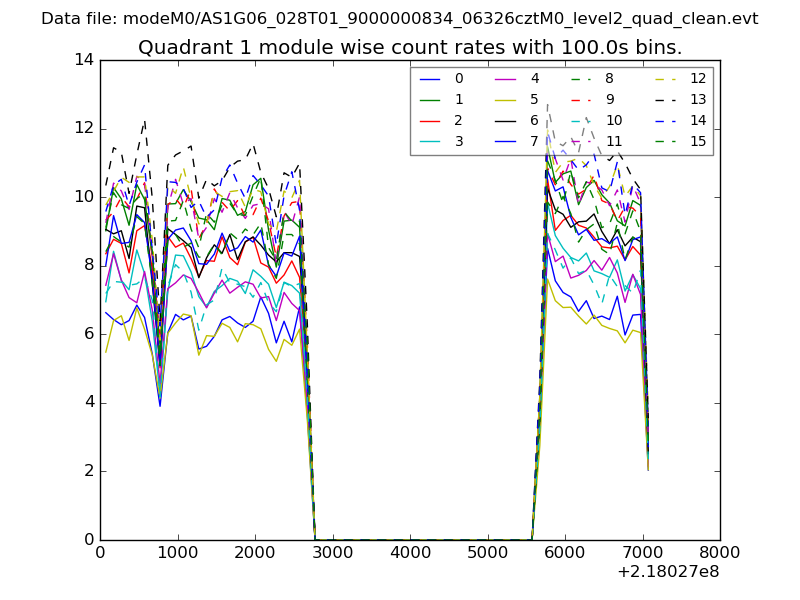
| Module-wise count rates for Quadrant A Data is divided into 100 sec bins |
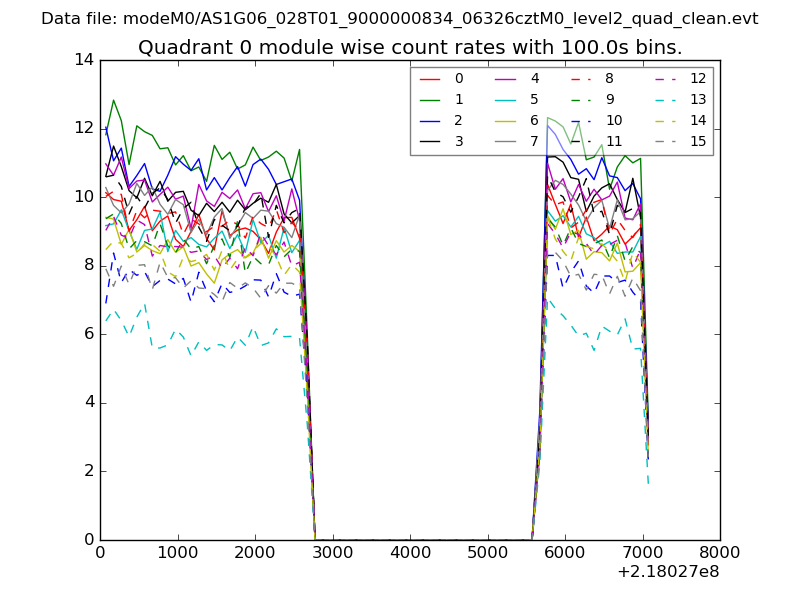 |
 |
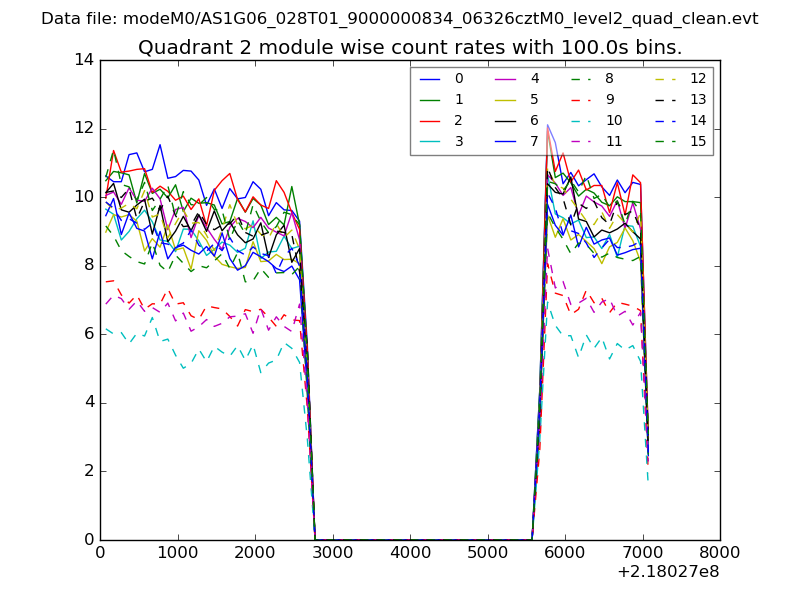
| Module-wise count rates for Quadrant B Data is divided into 100 sec bins |
 |
 |
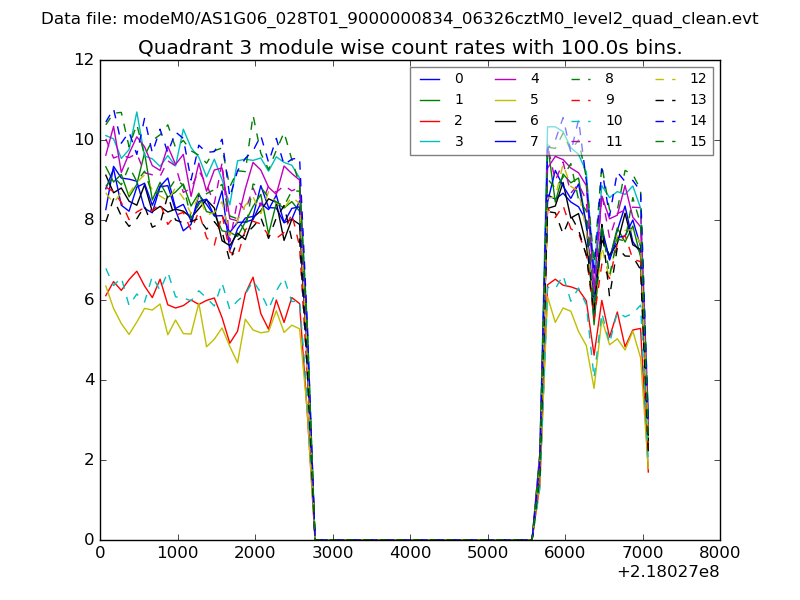
| Module-wise count rates for Quadrant C Data is divided into 100 sec bins |
 |
 |
| Module-wise count rates for Quadrant D Data is divided into 100 sec bins |
 |
 |
| Parameter | Plot |
|---|---|
| CZT HV Monitor | 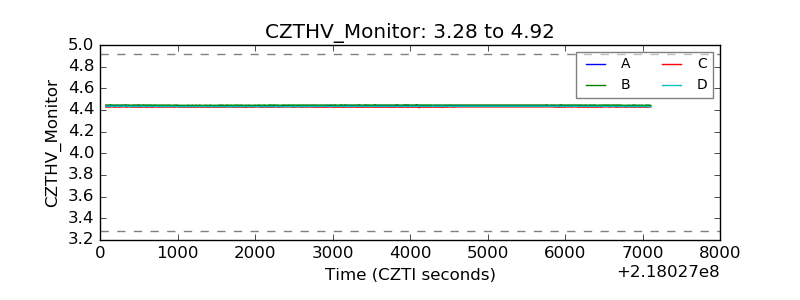 |
| D_VDD | 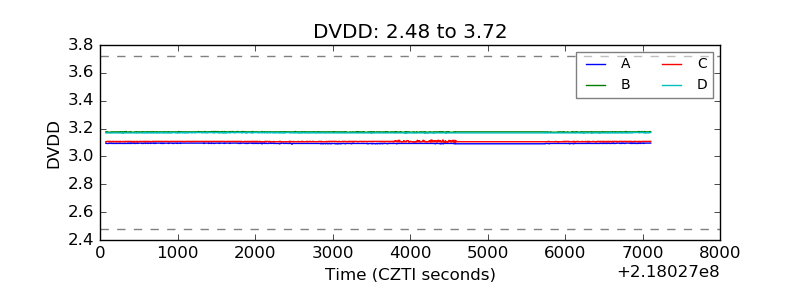 |
| Temperature 1 | 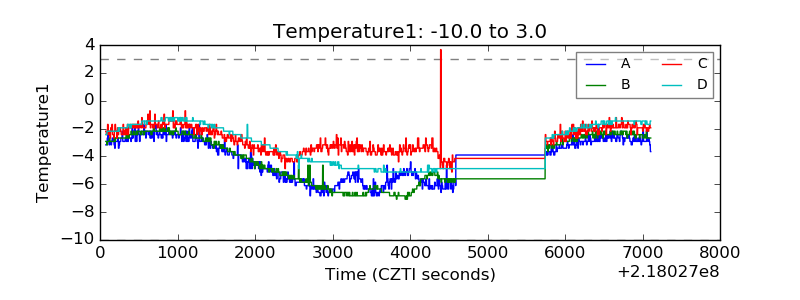 |
| Veto HV Monitor | 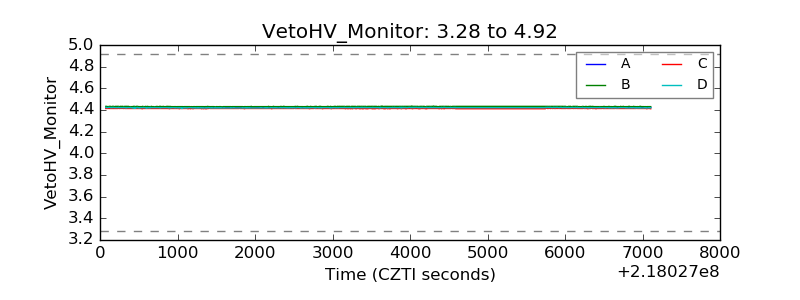 |
| Veto LLD | 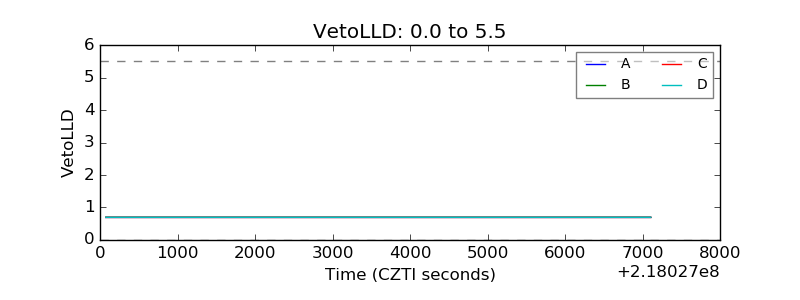 |
| Alpha Counter | 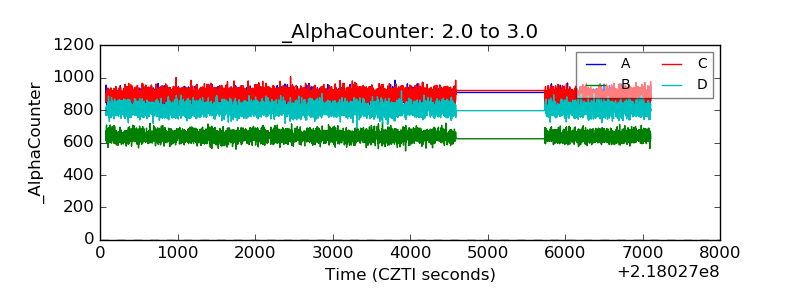 |
| _CPM_Rate | 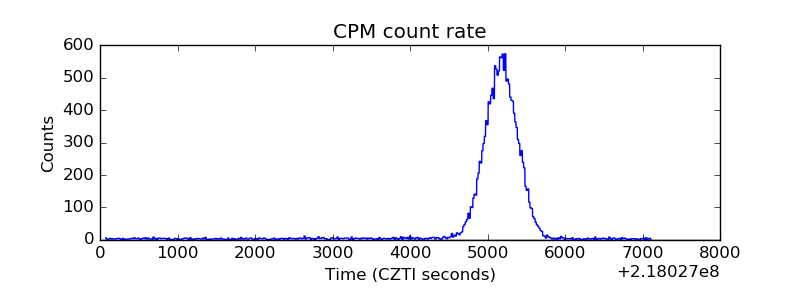 |
| CZT Counter | 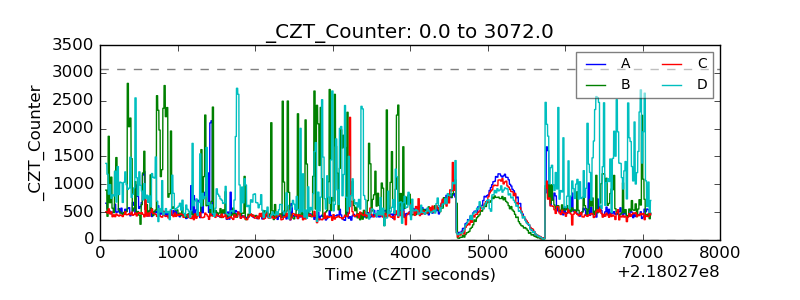 |
| +2.5 Volts monitor |  |
| +5 Volts monitor |  |
| _ROLL_ROT | 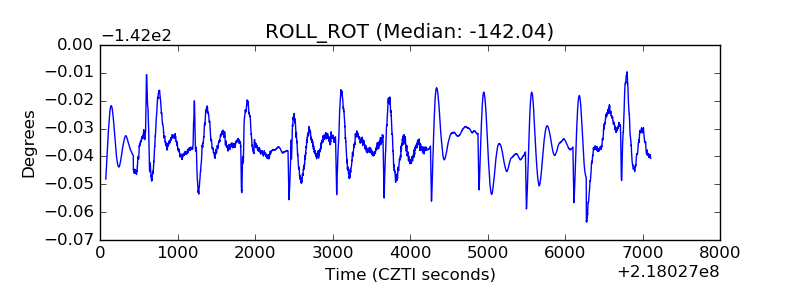 |
| _Roll_DEC | 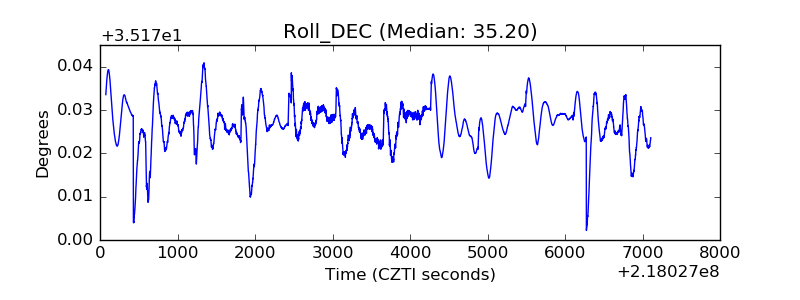 |
| _Roll_RA | 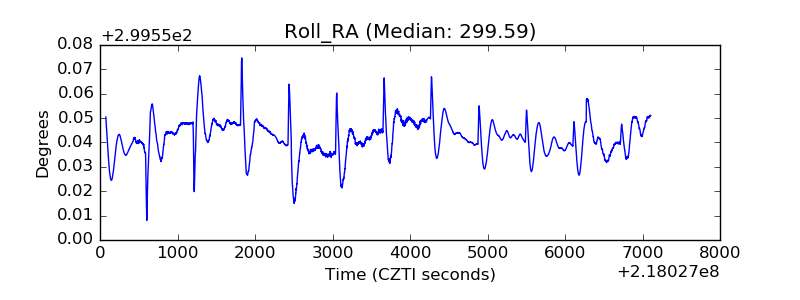 |
| Veto Counter | 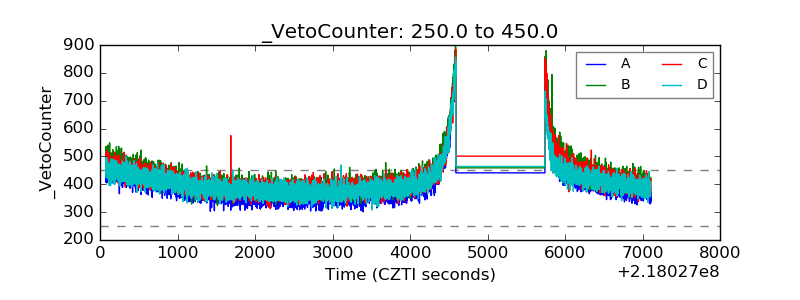 |