| Param | Original file | Final file |
|---|---|---|
| Filename | modeM0/AS1G06_028T01_9000000834_06328cztM0_level2.evt | modeM0/AS1G06_028T01_9000000834_06328cztM0_level2_quad_clean.evt |
| Size (bytes) | 614,113,920 | 87,652,800 |
| Size | 585.7 MB | 83.6 MB |
| Events in quadrant A | 3,005,143 | 576,030 |
| Events in quadrant B | 3,958,581 | 567,639 |
| Events in quadrant C | 3,191,175 | 564,907 |
| Events in quadrant D | 8,011,310 | 499,244 |
| Mode M0 | |||
|---|---|---|---|
| Quadrant | BADHDUFLAG | Total packets | Discarded packets |
| A | 0 | 13347 | 2 |
| B | 0 | 16078 | 1 |
| C | 0 | 13916 | 1 |
| D | 0 | 28416 | 1 |
| Mode SS | |||
|---|---|---|---|
| Quadrant | BADHDUFLAG | Total packets | Discarded packets |
| A | 0 | 128 | 0 |
| B | 0 | 128 | 0 |
| C | 0 | 128 | 0 |
| D | 0 | 128 | 0 |
| Mode M9 | |||
|---|---|---|---|
| Quadrant | BADHDUFLAG | Total packets | Discarded packets |
| A | 0 | 7 | 0 |
| B | 0 | 7 | 0 |
| C | 0 | 7 | 0 |
| D | 0 | 7 | 0 |
| Quadrant | Total seconds | Saturated seconds | Saturation percentage |
|---|---|---|---|
| A | 6401 | 38 | 0.593657% |
| B | 6401 | 271 | 4.233713% |
| C | 6401 | 59 | 0.921731% |
| D | 6401 | 752 | 11.748164% |
Noise dominated data is calculated using 1-second bins in cleaned event files. If a bin has >2000 counts, and if more than 50% of those come from <1% of pixels, then it is considered to be noise-dominated and hence unusable.
| Quadrant | # 1 sec bins | Bins with >0 counts | Bins with >2000 counts | High rate bins dominated by noise | Noise dominated (total time) | Noise dominated (detector-on time) | Marked lightcurve |
|---|---|---|---|---|---|---|---|
| A | 7036 | 6402 | 3 | 3 | 0.04% | 0.05% | 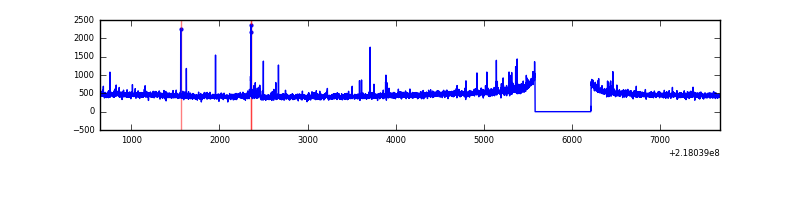 |
| B | 7036 | 6402 | 176 | 176 | 2.50% | 2.75% | 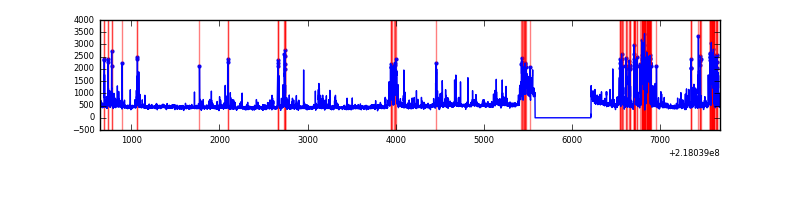 |
| C | 7036 | 6402 | 51 | 51 | 0.72% | 0.80% | 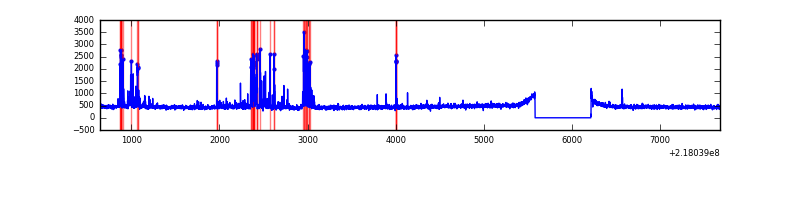 |
| D | 7036 | 6402 | 702 | 702 | 9.98% | 10.97% | 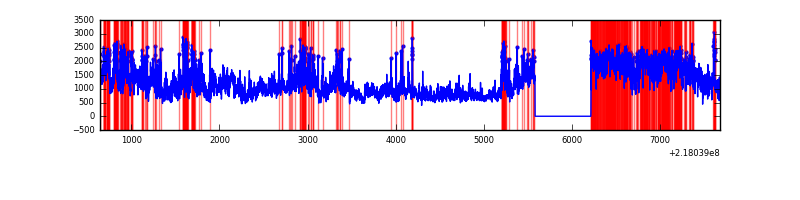 |
Top three noisy pixels from each quadrant. If the there are fewer than three noisy pixels in the level2.evt file, extra rows are filled as -1
| Pixel properties | Quadrant properties | ||||||
|---|---|---|---|---|---|---|---|
| Quadrant | DetID | PixID | Counts | Sigma | Mean | Median | Sigma |
| A | 8 | 15 | 48172 | 308.27 | 752 | 738 | 153.9 |
| A | 13 | 251 | 31155 | 197.68 | 752 | 738 | 153.9 |
| A | 14 | 111 | 16103 | 99.86 | 752 | 738 | 153.9 |
| B | 3 | 64 | 926758 | 6518.0 | 745 | 731 | 142.1 |
| B | 4 | 81 | 98926 | 691.16 | 745 | 731 | 142.1 |
| B | 15 | 204 | 25024 | 170.99 | 745 | 731 | 142.1 |
| C | 4 | 254 | 337404 | 1996.41 | 727 | 733 | 168.6 |
| C | 9 | 16 | 9288 | 50.73 | 727 | 733 | 168.6 |
| C | 13 | 61 | 5824 | 30.19 | 727 | 733 | 168.6 |
| D | 12 | 221 | 3814859 | 21952.66 | 706 | 685 | 173.7 |
| D | 12 | 220 | 1136900 | 6539.54 | 706 | 685 | 173.7 |
| D | 2 | 63 | 199165 | 1142.36 | 706 | 685 | 173.7 |
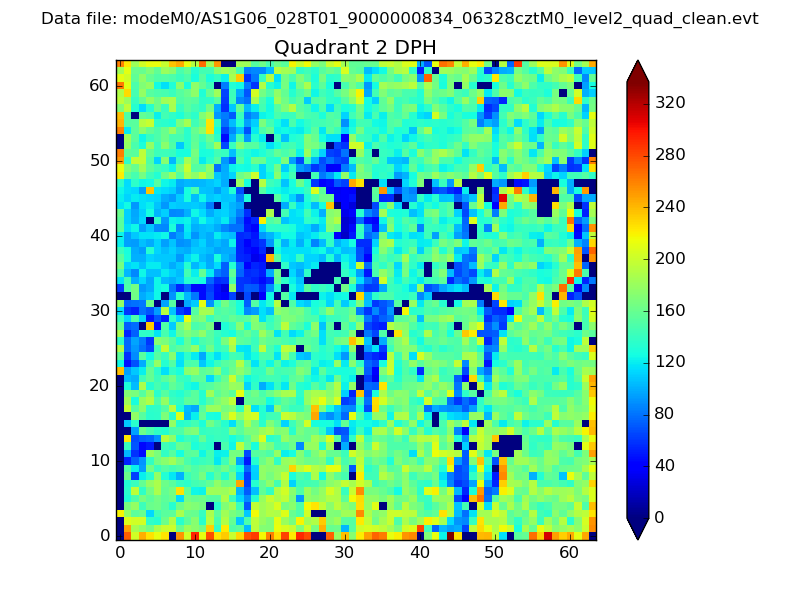
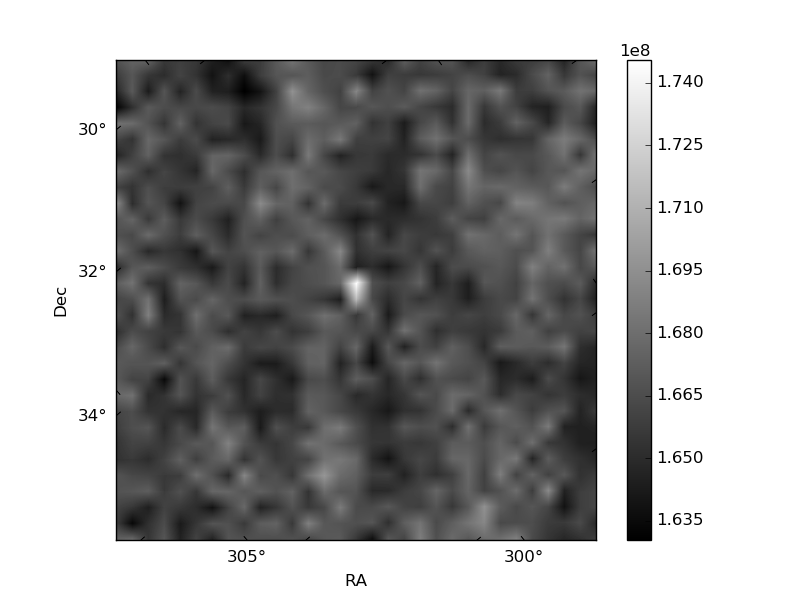
Histogram calculated using DETX and DETY for each event in the final _common_clean file
| Quadrant A | 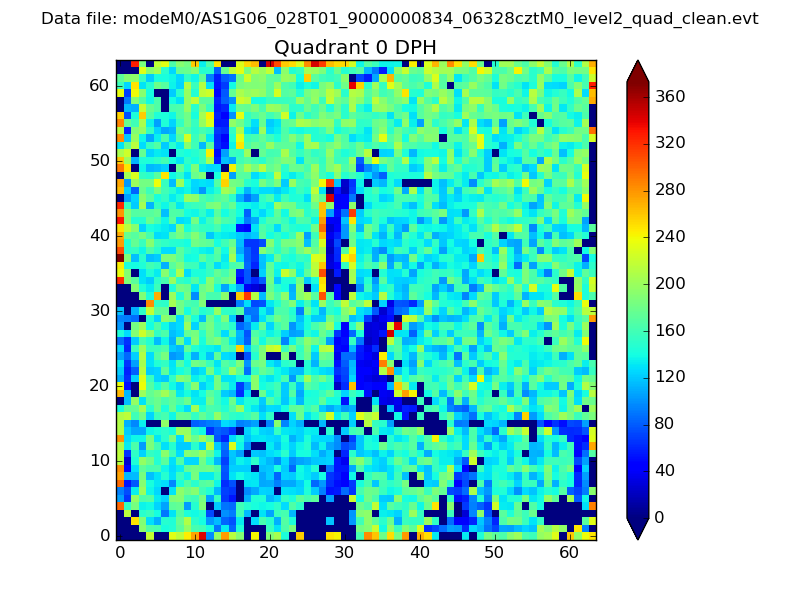 |
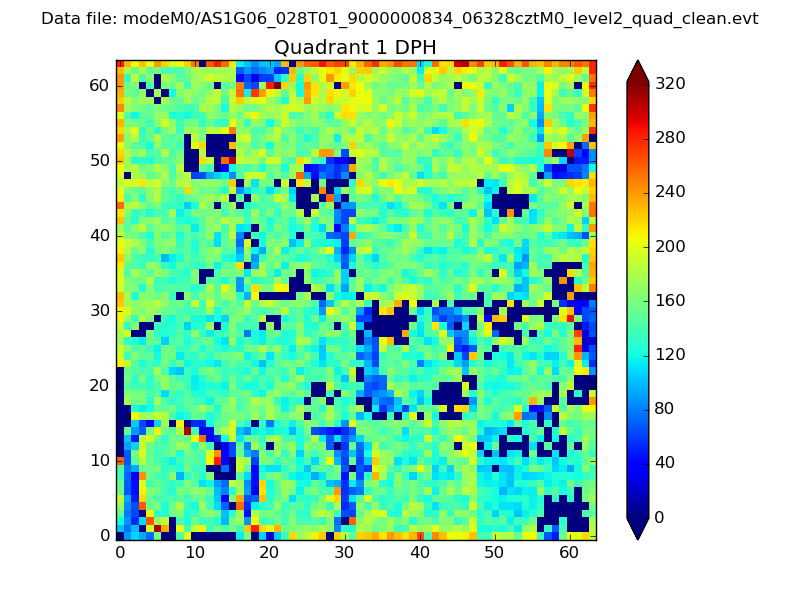 |
Quadrant B |
|---|---|---|---|
| Quadrant D | 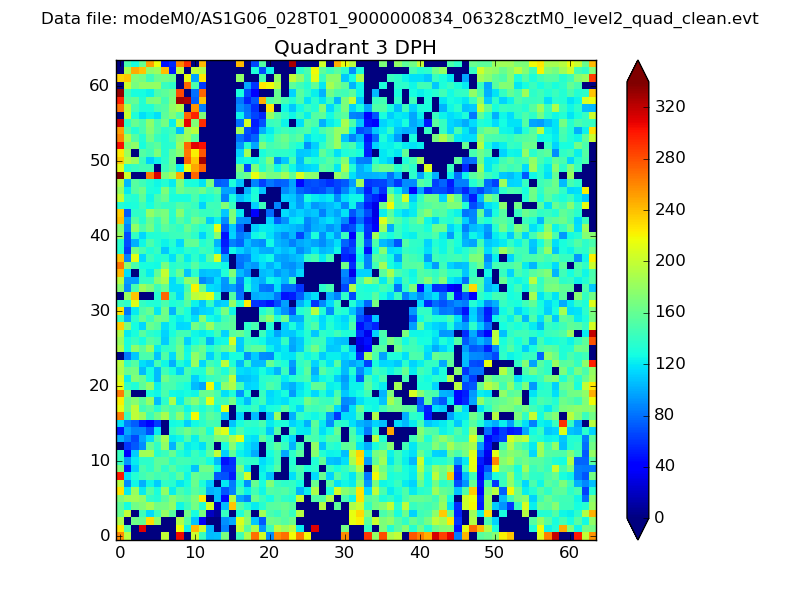 |
 |
Quadrant C |
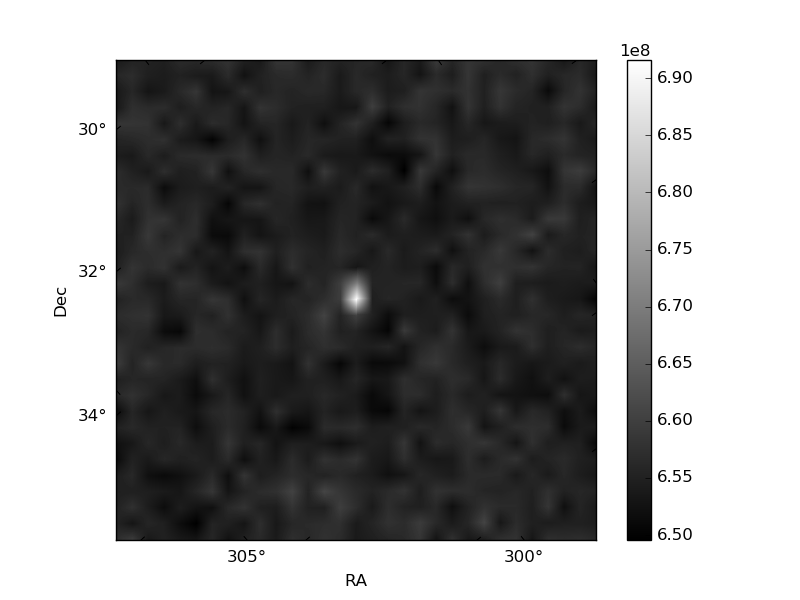
| Plot type | Count rate plots | Images |
|---|---|---|
| Comparison with Poisson distribution Blue bars denote a histogram of data divided into 1 sec bins. Red curve is a Poisson curve with rate = median count rate of data. |
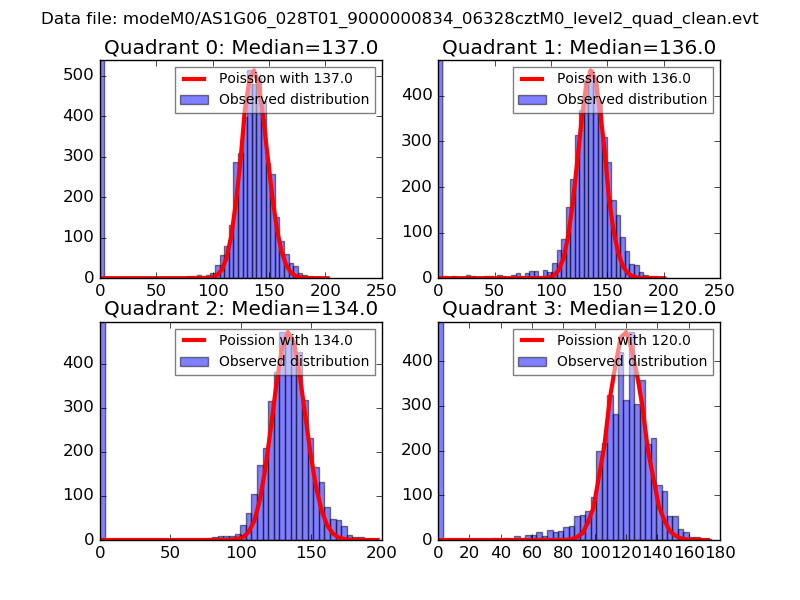 |
 |
| Quadrant-wise count rates Data is divided into 100 sec bins |
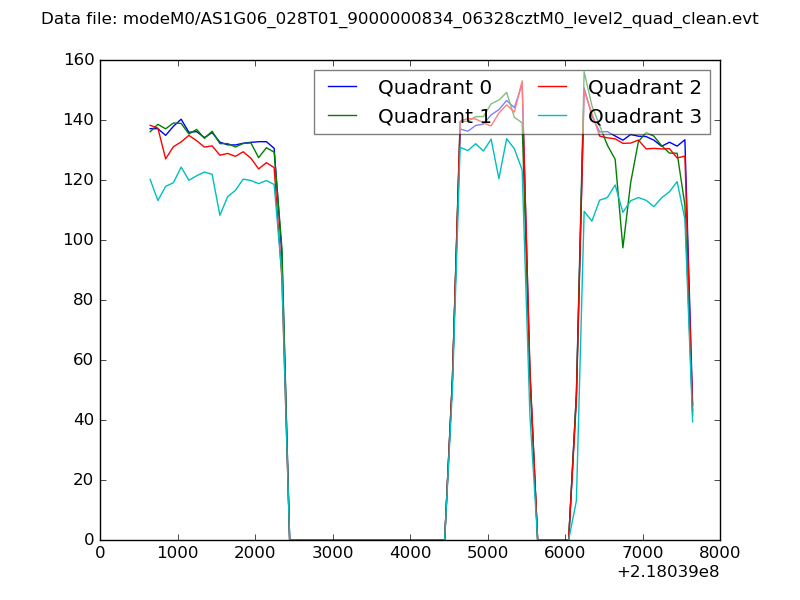 |
|
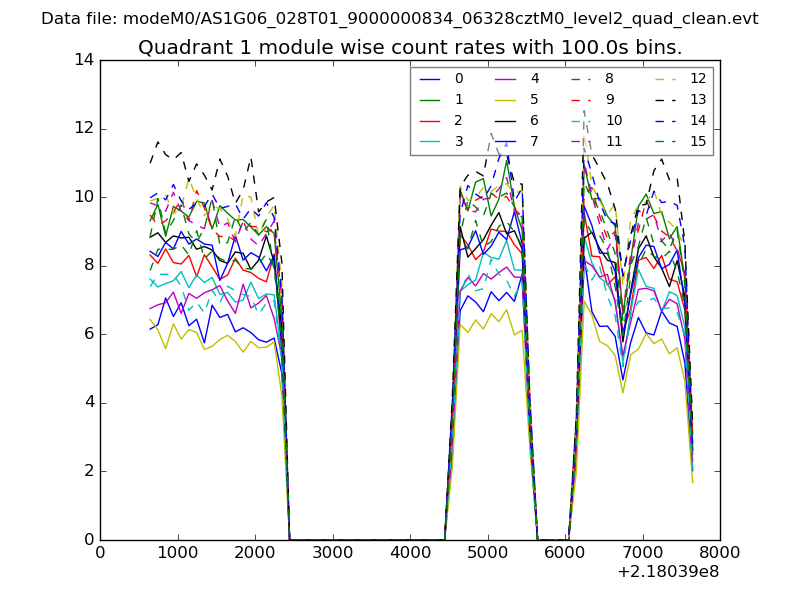
| Module-wise count rates for Quadrant A Data is divided into 100 sec bins |
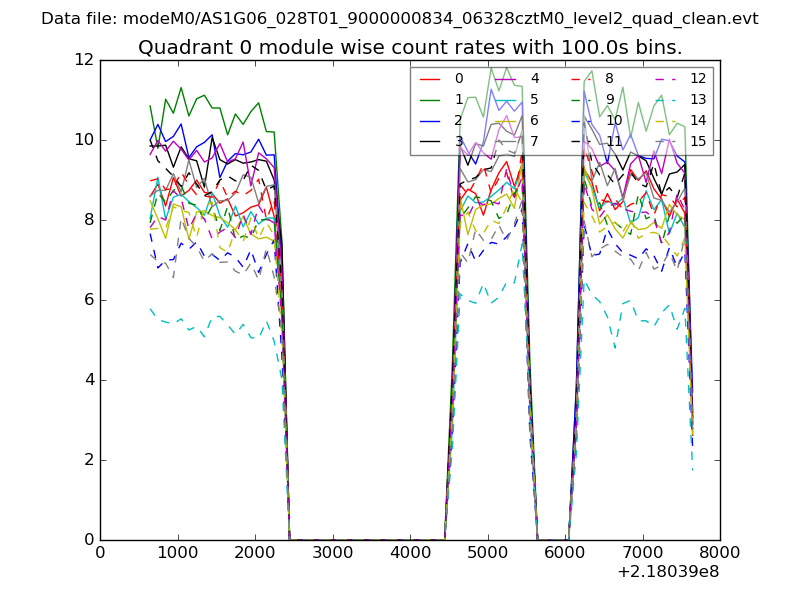 |
 |
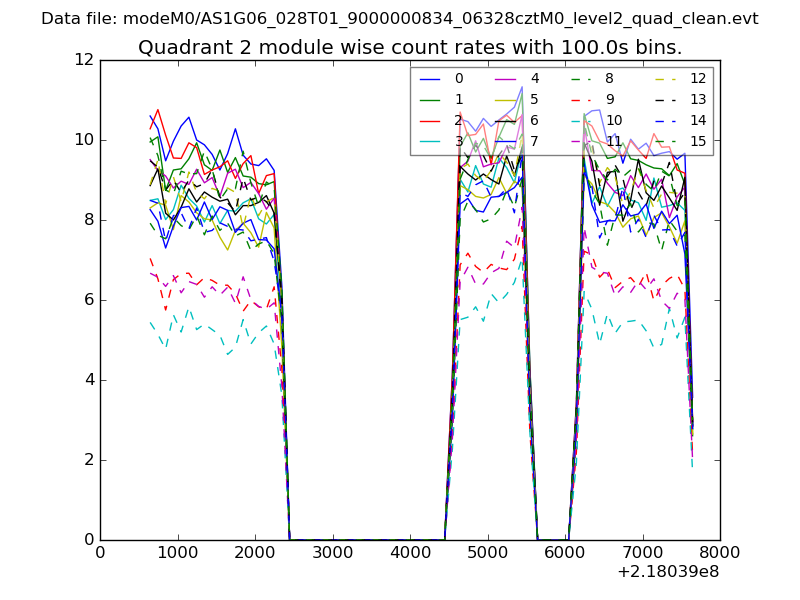
| Module-wise count rates for Quadrant B Data is divided into 100 sec bins |
 |
 |
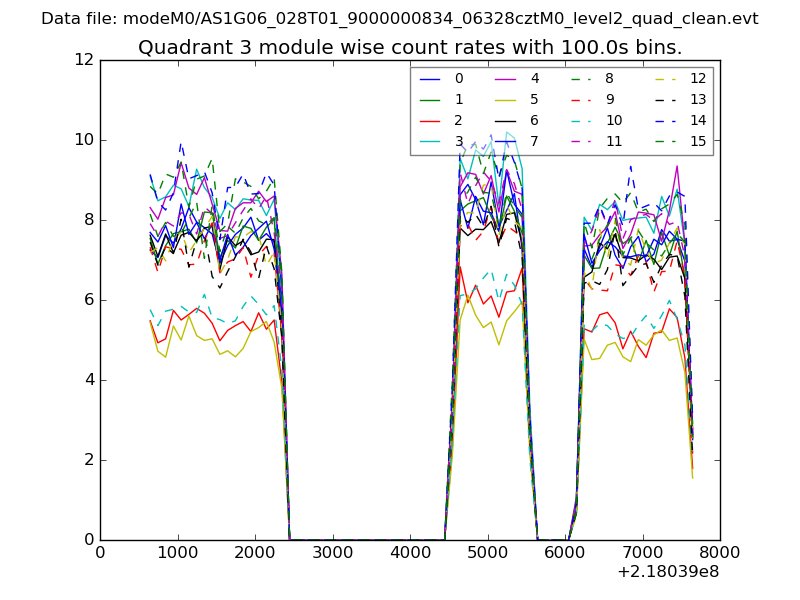
| Module-wise count rates for Quadrant C Data is divided into 100 sec bins |
 |
 |
| Module-wise count rates for Quadrant D Data is divided into 100 sec bins |
 |
 |
| Parameter | Plot |
|---|---|
| CZT HV Monitor | 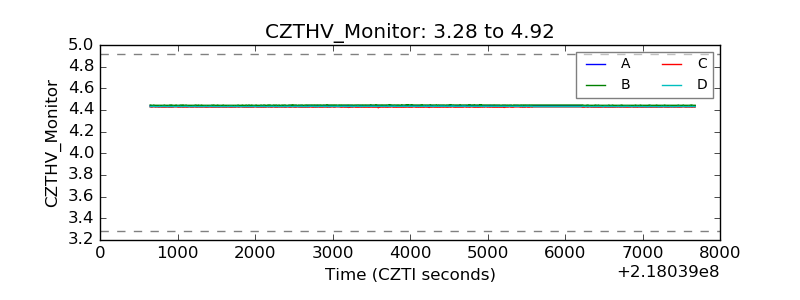 |
| D_VDD | 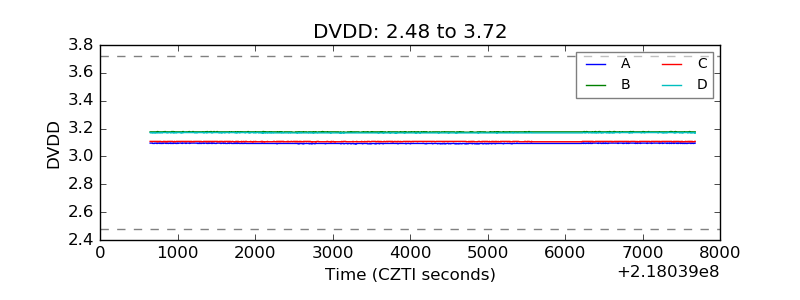 |
| Temperature 1 | 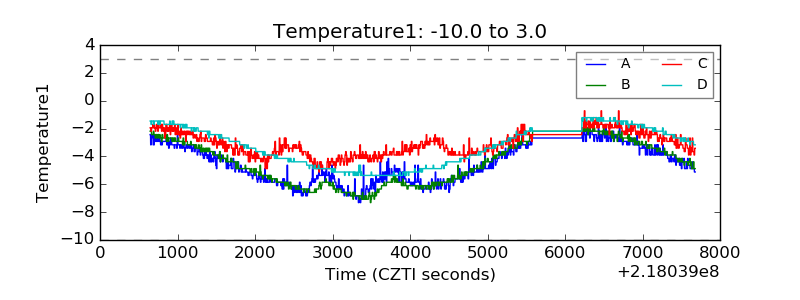 |
| Veto HV Monitor | 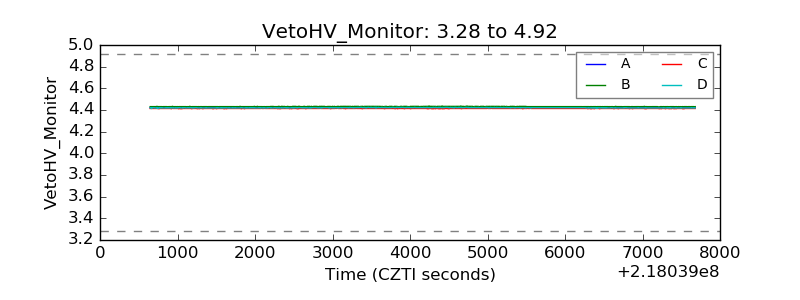 |
| Veto LLD | 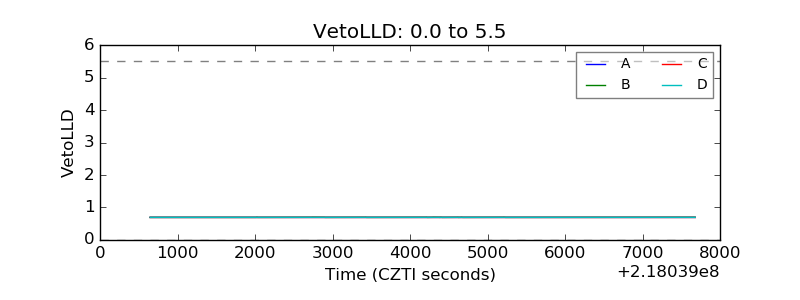 |
| Alpha Counter | 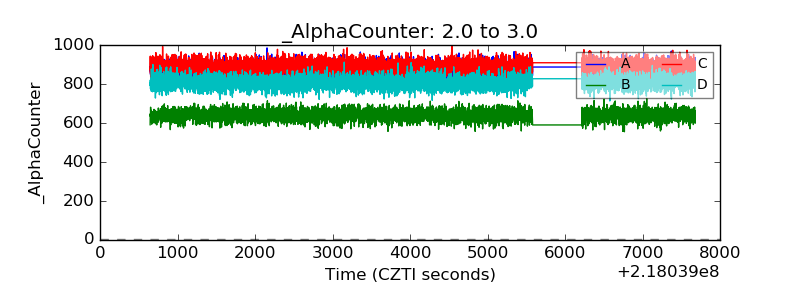 |
| _CPM_Rate | 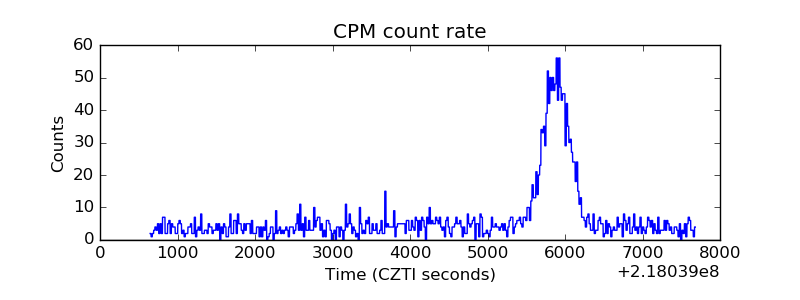 |
| CZT Counter | 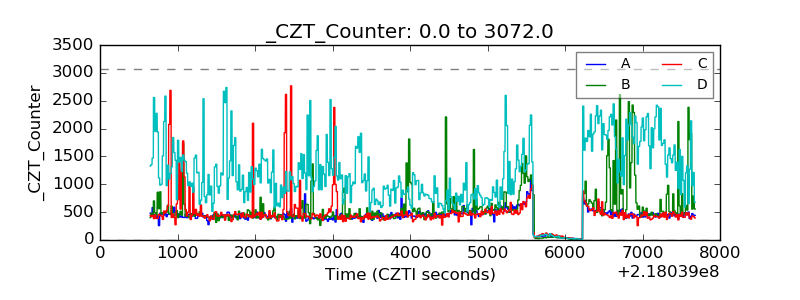 |
| +2.5 Volts monitor |  |
| +5 Volts monitor |  |
| _ROLL_ROT | 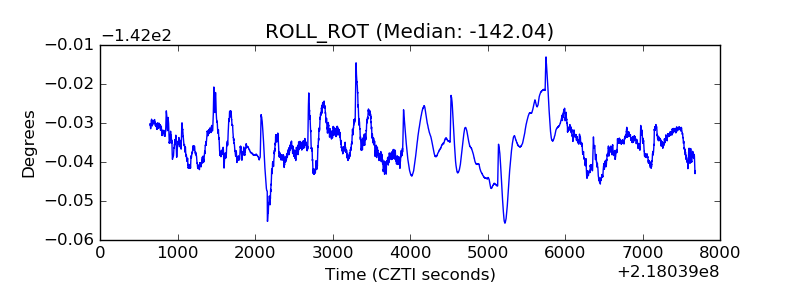 |
| _Roll_DEC | 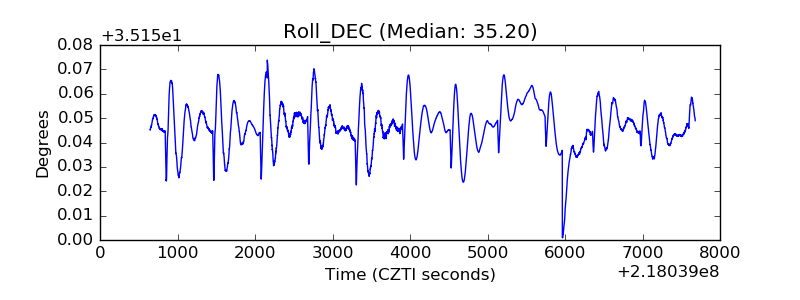 |
| _Roll_RA | 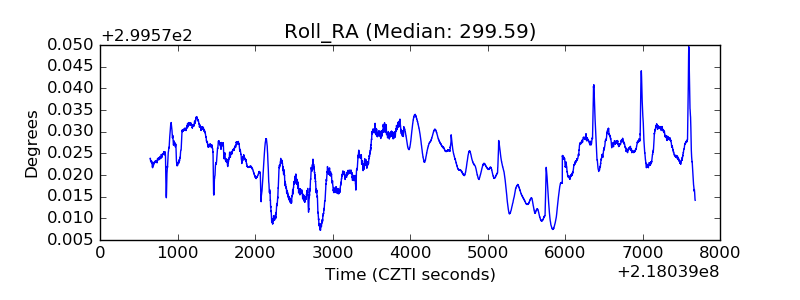 |
| Veto Counter | 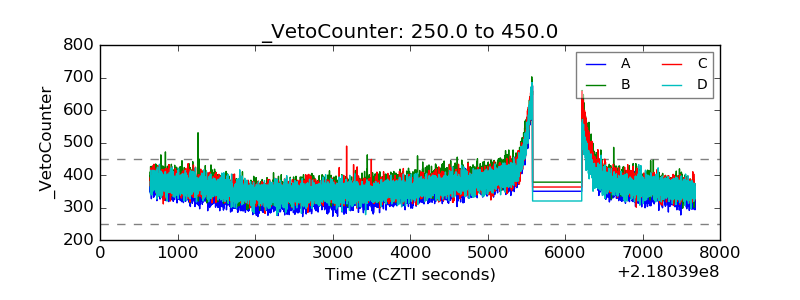 |