| Param | Original file | Final file |
|---|---|---|
| Filename | modeM0/AS1G06_028T01_9000000834_06329cztM0_level2.evt | modeM0/AS1G06_028T01_9000000834_06329cztM0_level2_quad_clean.evt |
| Size (bytes) | 478,520,640 | 73,523,520 |
| Size | 456.4 MB | 70.1 MB |
| Events in quadrant A | 2,670,271 | 474,817 |
| Events in quadrant B | 3,304,296 | 465,592 |
| Events in quadrant C | 2,568,648 | 467,136 |
| Events in quadrant D | 5,565,295 | 423,214 |
| Mode M0 | |||
|---|---|---|---|
| Quadrant | BADHDUFLAG | Total packets | Discarded packets |
| A | 0 | 11794 | 1 |
| B | 0 | 13612 | 1 |
| C | 0 | 11667 | 1 |
| D | 0 | 20551 | 1 |
| Mode SS | |||
|---|---|---|---|
| Quadrant | BADHDUFLAG | Total packets | Discarded packets |
| A | 0 | 114 | 0 |
| B | 0 | 114 | 0 |
| C | 0 | 114 | 0 |
| D | 0 | 114 | 0 |
| Mode M9 | |||
|---|---|---|---|
| Quadrant | BADHDUFLAG | Total packets | Discarded packets |
| A | 0 | 3 | 0 |
| B | 0 | 3 | 0 |
| C | 0 | 3 | 0 |
| D | 0 | 3 | 0 |
| Quadrant | Total seconds | Saturated seconds | Saturation percentage |
|---|---|---|---|
| A | 5656 | 23 | 0.406648% |
| B | 5656 | 240 | 4.243281% |
| C | 5656 | 16 | 0.282885% |
| D | 5656 | 420 | 7.425743% |
Noise dominated data is calculated using 1-second bins in cleaned event files. If a bin has >2000 counts, and if more than 50% of those come from <1% of pixels, then it is considered to be noise-dominated and hence unusable.
| Quadrant | # 1 sec bins | Bins with >0 counts | Bins with >2000 counts | High rate bins dominated by noise | Noise dominated (total time) | Noise dominated (detector-on time) | Marked lightcurve |
|---|---|---|---|---|---|---|---|
| A | 5956 | 5657 | 2 | 2 | 0.03% | 0.04% | 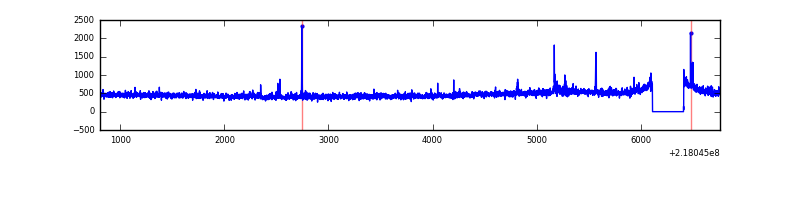 |
| B | 5956 | 5657 | 149 | 149 | 2.50% | 2.63% | 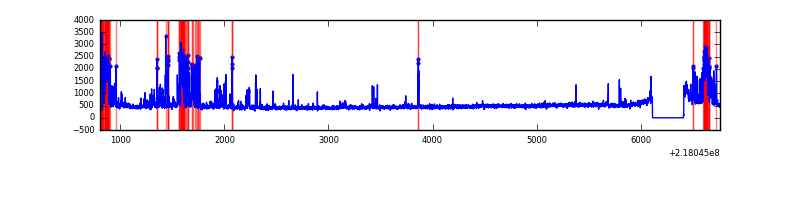 |
| C | 5956 | 5657 | 0 | 0 | 0.00% | 0.00% | 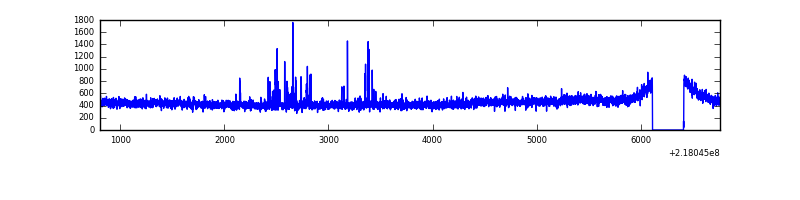 |
| D | 5956 | 5657 | 351 | 351 | 5.89% | 6.20% | 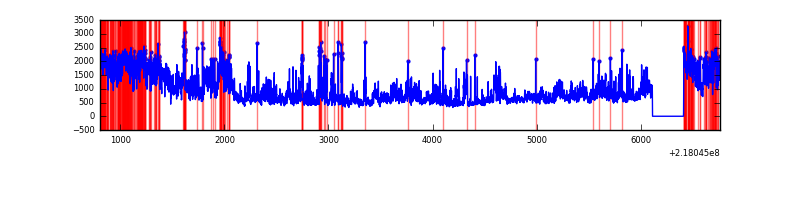 |
Top three noisy pixels from each quadrant. If the there are fewer than three noisy pixels in the level2.evt file, extra rows are filled as -1
| Pixel properties | Quadrant properties | ||||||
|---|---|---|---|---|---|---|---|
| Quadrant | DetID | PixID | Counts | Sigma | Mean | Median | Sigma |
| A | 13 | 251 | 32957 | 235.51 | 666 | 652 | 137.2 |
| A | 13 | 14 | 28354 | 201.95 | 666 | 652 | 137.2 |
| A | 8 | 15 | 21384 | 151.14 | 666 | 652 | 137.2 |
| B | 3 | 64 | 666583 | 5218.46 | 660 | 647 | 127.6 |
| B | 4 | 81 | 41341 | 318.89 | 660 | 647 | 127.6 |
| B | 15 | 204 | 20964 | 159.21 | 660 | 647 | 127.6 |
| C | 4 | 254 | 33483 | 217.24 | 645 | 650 | 151.1 |
| C | 9 | 16 | 16719 | 106.32 | 645 | 650 | 151.1 |
| C | 13 | 61 | 5067 | 29.23 | 645 | 650 | 151.1 |
| D | 12 | 221 | 2196729 | 14141.53 | 630 | 609 | 155.3 |
| D | 13 | 169 | 346535 | 2227.53 | 630 | 609 | 155.3 |
| D | 2 | 63 | 227368 | 1460.18 | 630 | 609 | 155.3 |
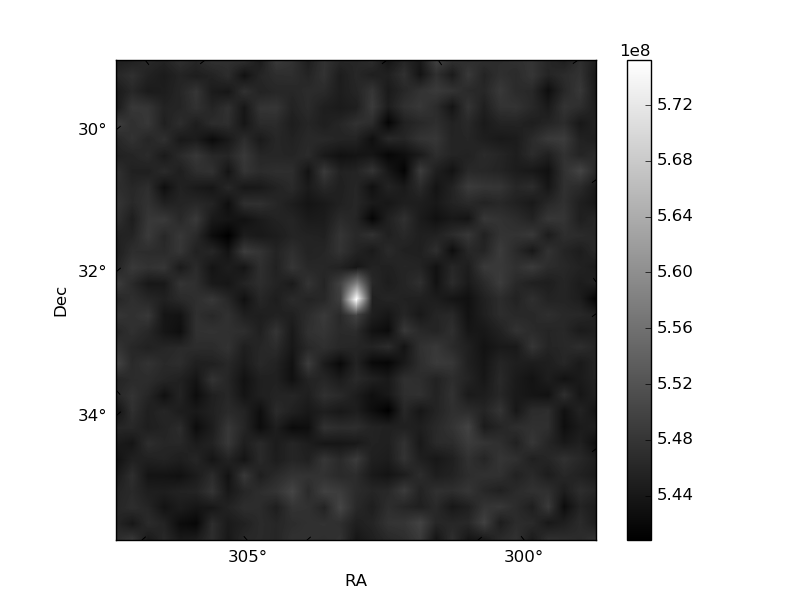
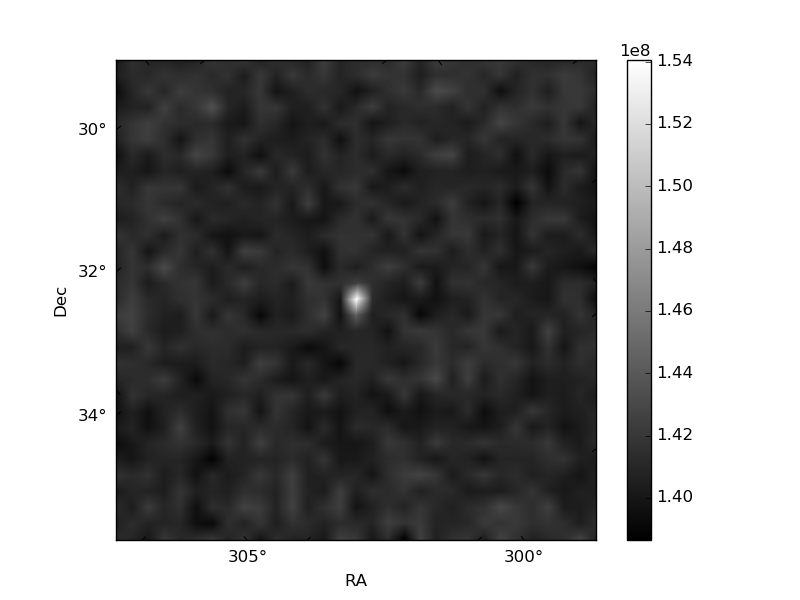
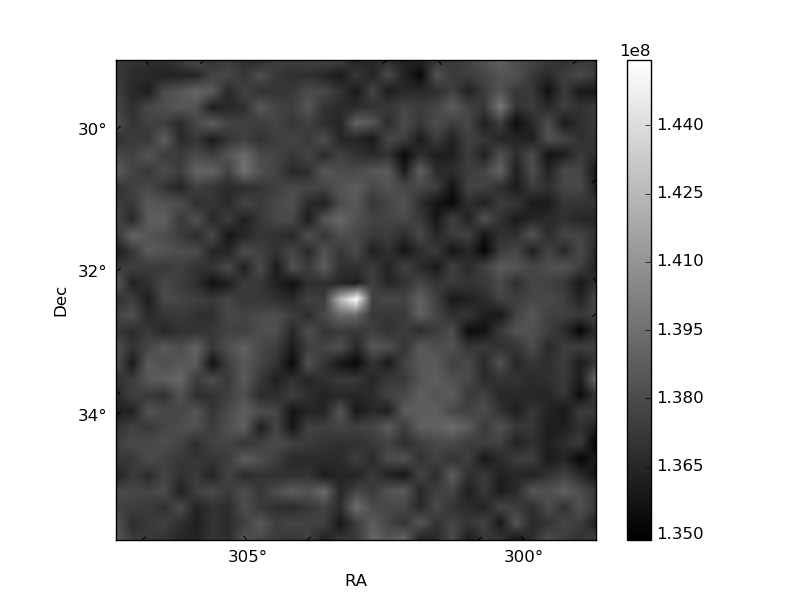
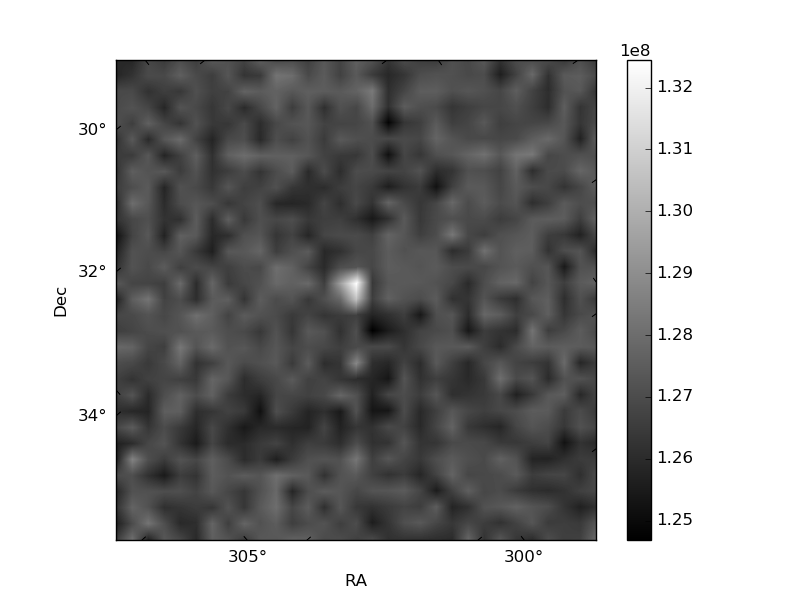
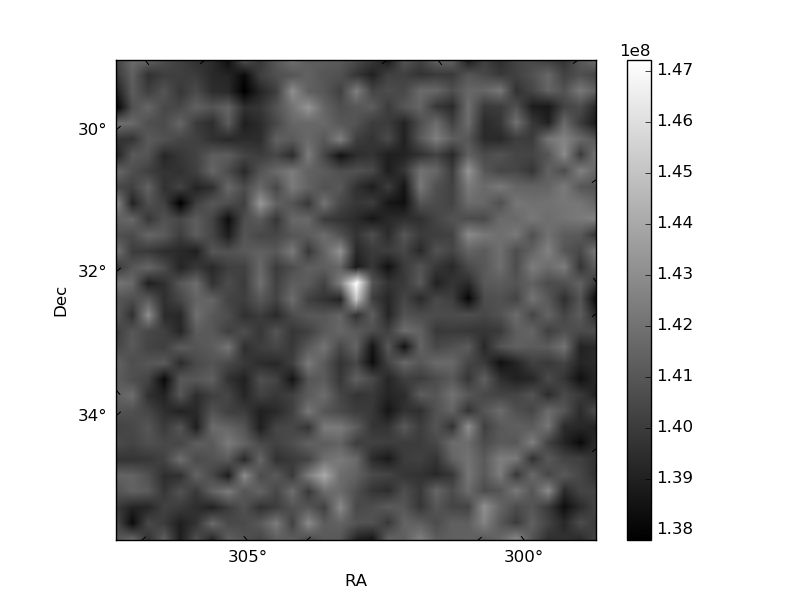
Histogram calculated using DETX and DETY for each event in the final _common_clean file
| Quadrant A | 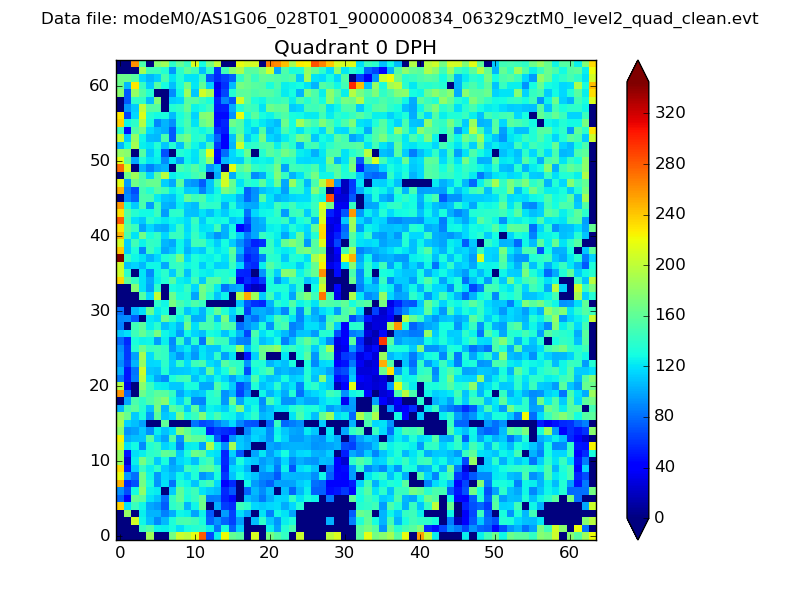 |
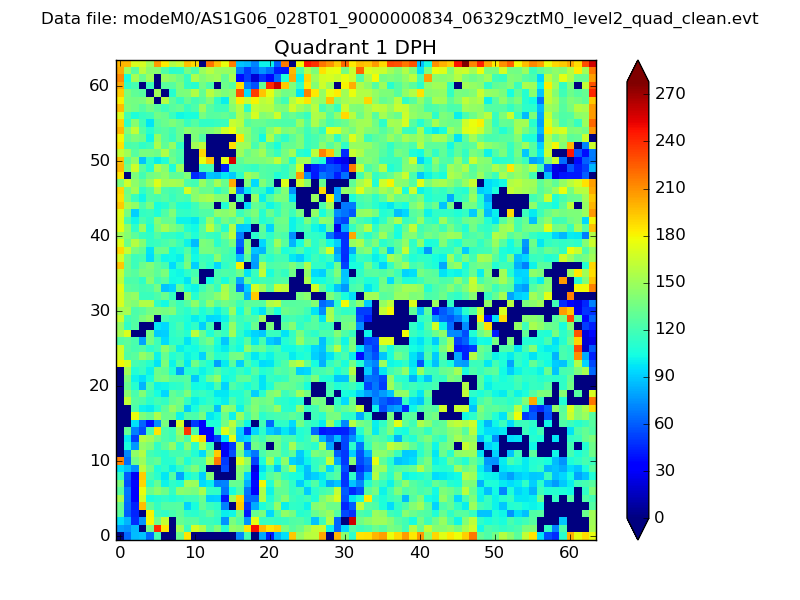 |
Quadrant B |
|---|---|---|---|
| Quadrant D | 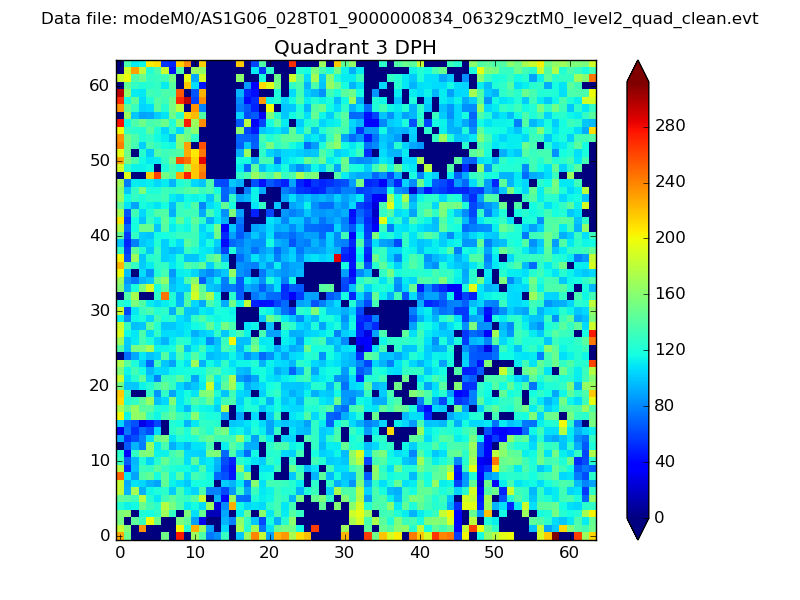 |
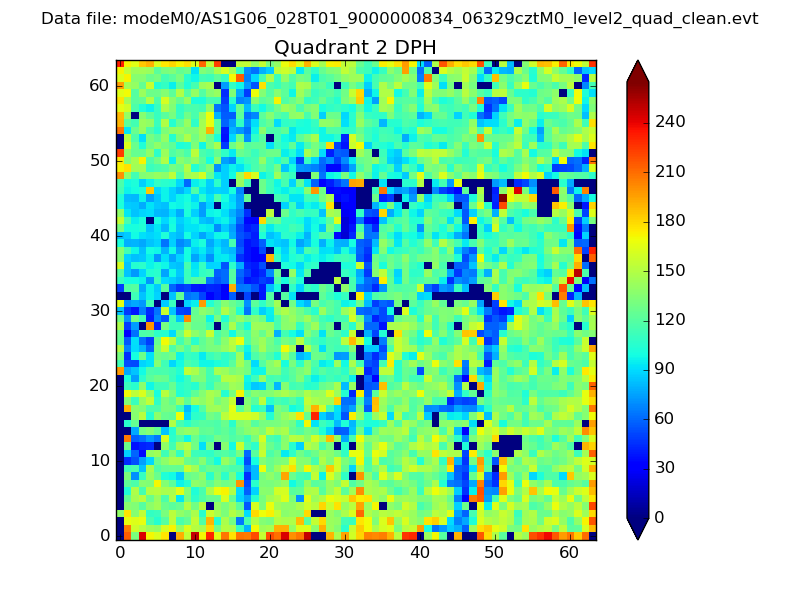 |
Quadrant C |
| Plot type | Count rate plots | Images |
|---|---|---|
| Comparison with Poisson distribution Blue bars denote a histogram of data divided into 1 sec bins. Red curve is a Poisson curve with rate = median count rate of data. |
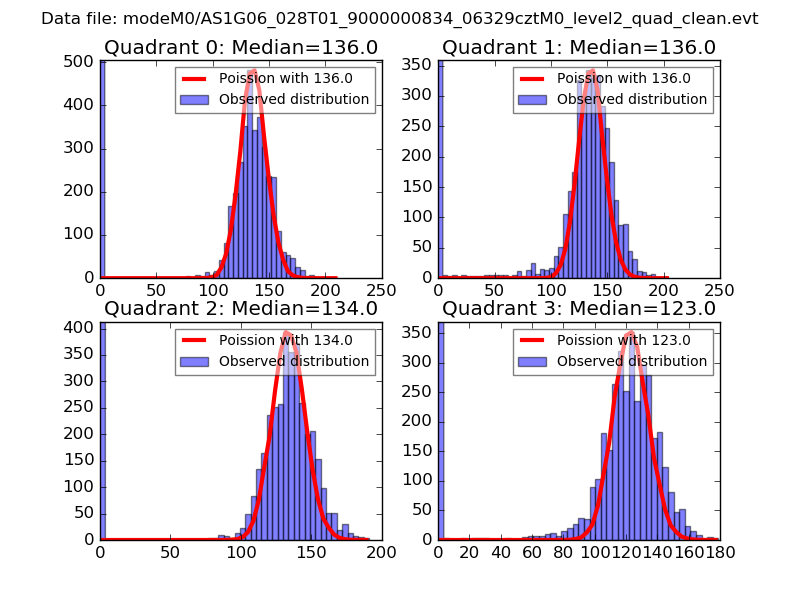 |
 |
| Quadrant-wise count rates Data is divided into 100 sec bins |
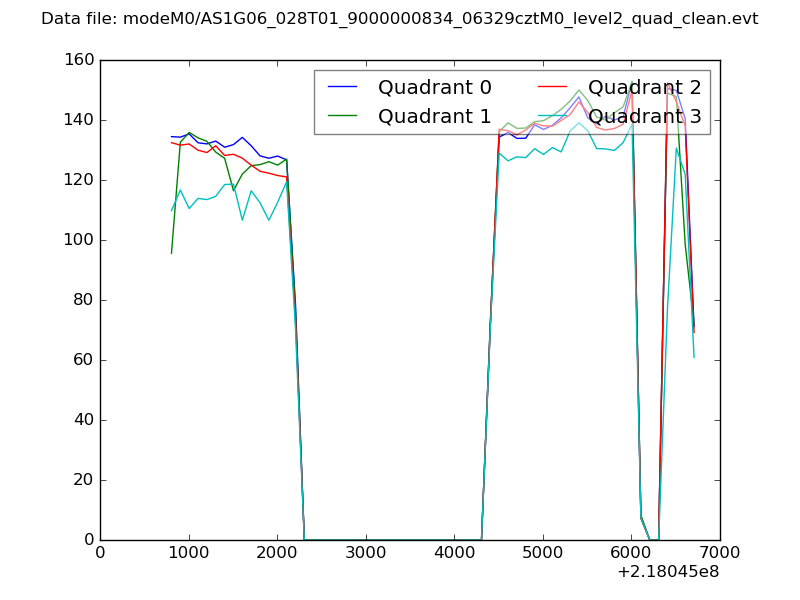 |
|
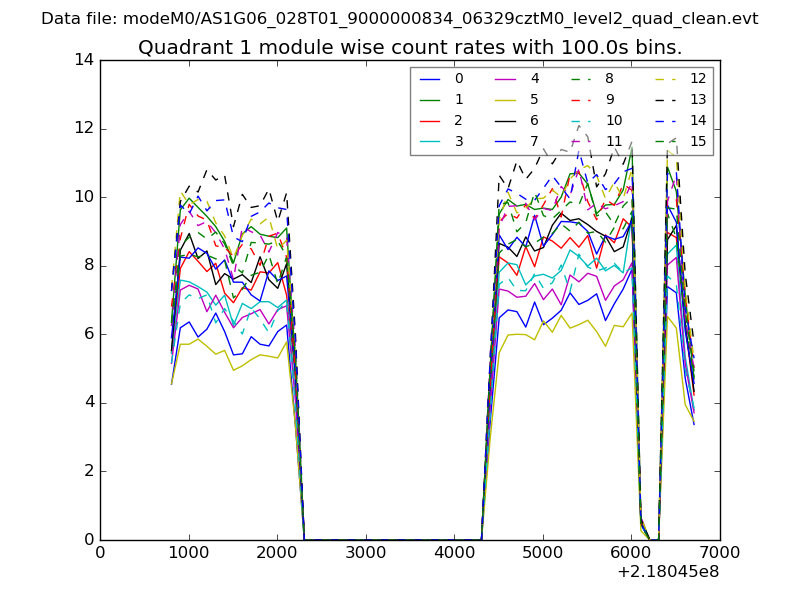
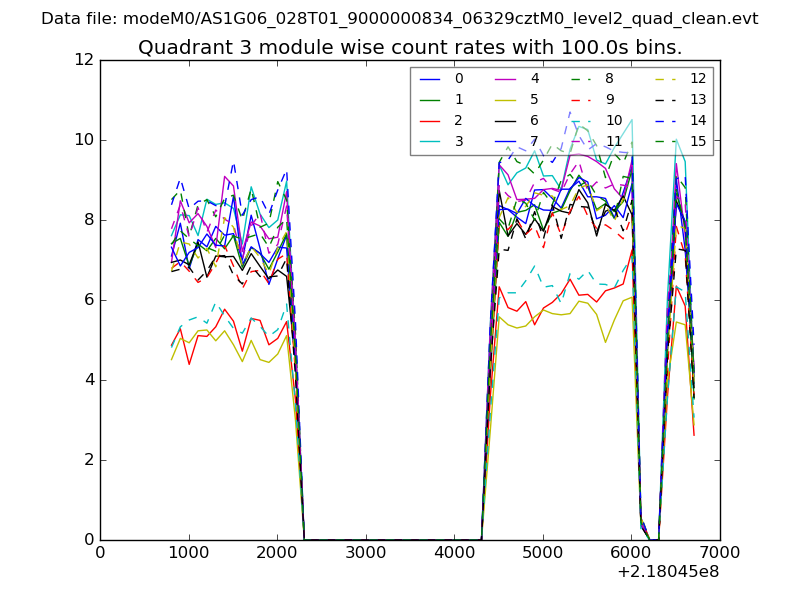
| Module-wise count rates for Quadrant A Data is divided into 100 sec bins |
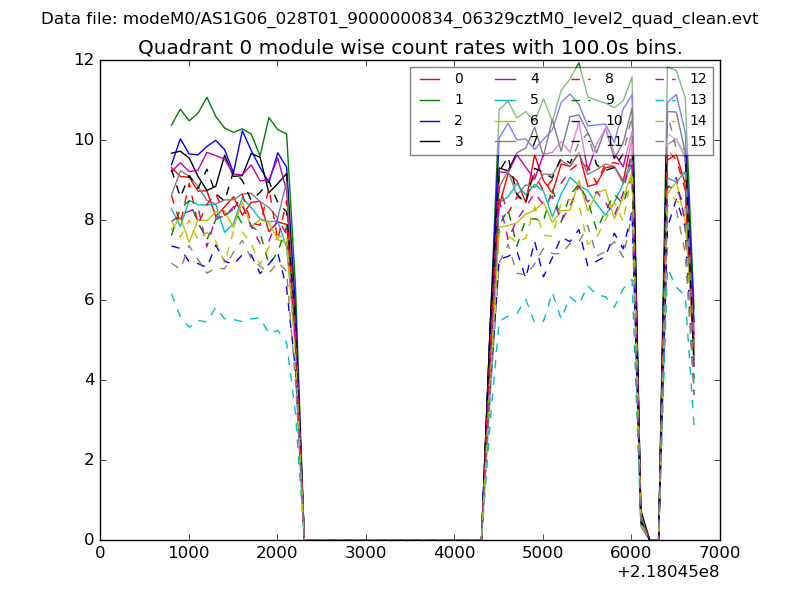 |
 |
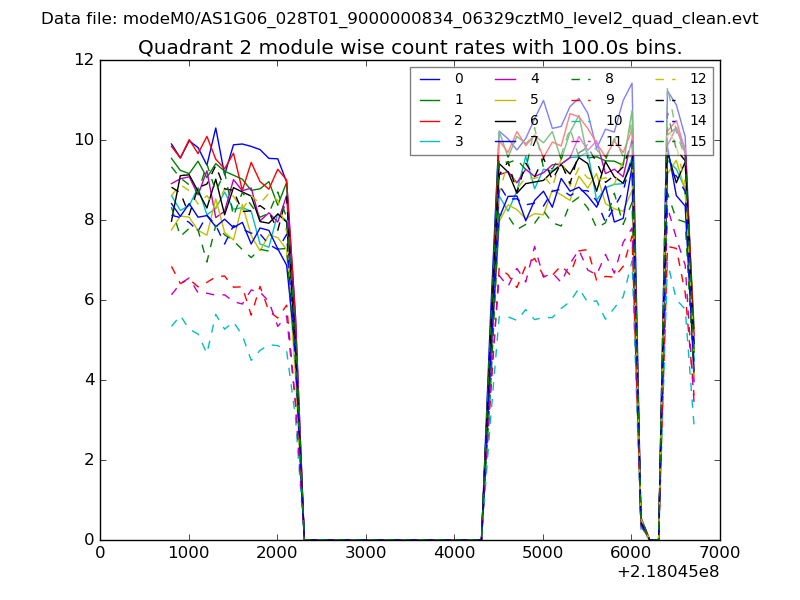
| Module-wise count rates for Quadrant B Data is divided into 100 sec bins |
 |
 |
| Module-wise count rates for Quadrant C Data is divided into 100 sec bins |
 |
 |
| Module-wise count rates for Quadrant D Data is divided into 100 sec bins |
 |
 |
| Parameter | Plot |
|---|---|
| CZT HV Monitor | 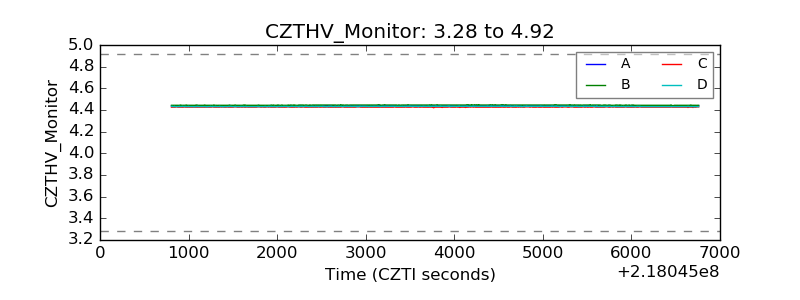 |
| D_VDD | 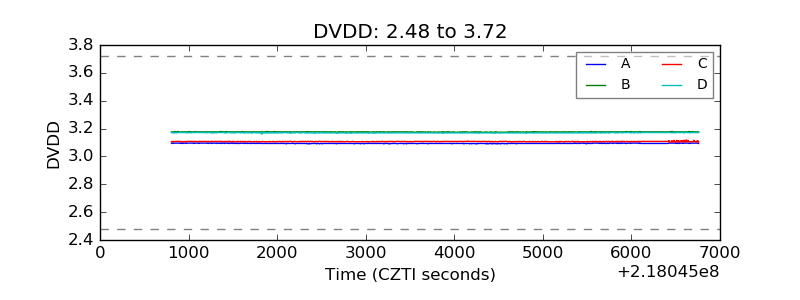 |
| Temperature 1 | 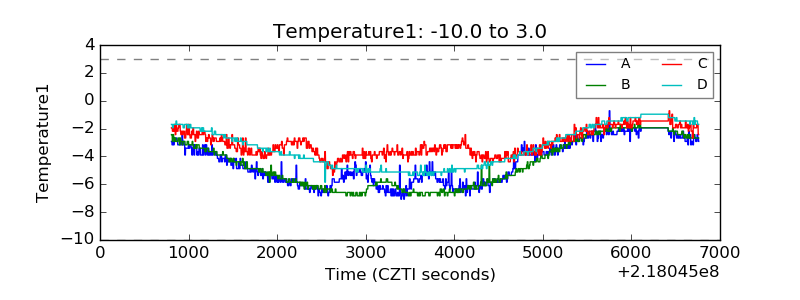 |
| Veto HV Monitor | 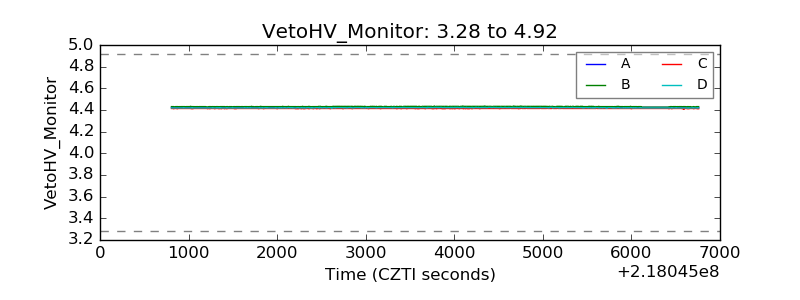 |
| Veto LLD | 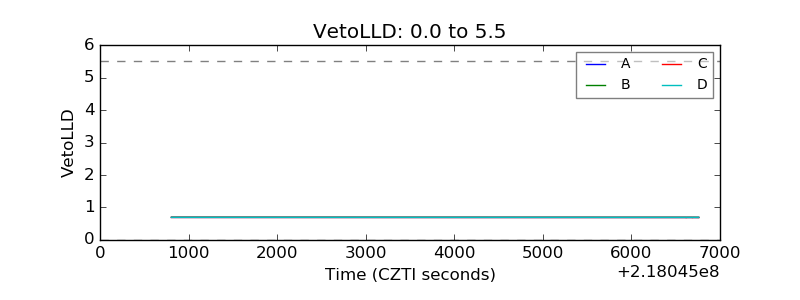 |
| Alpha Counter | 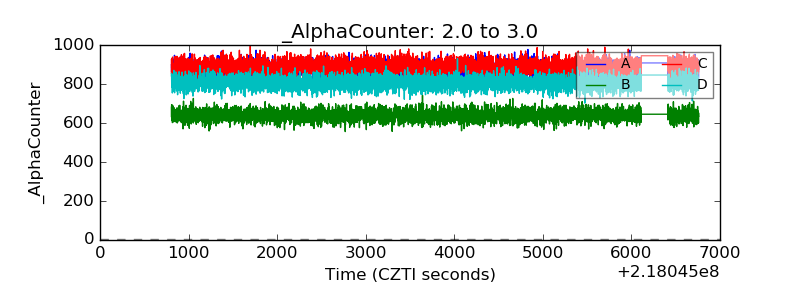 |
| _CPM_Rate | 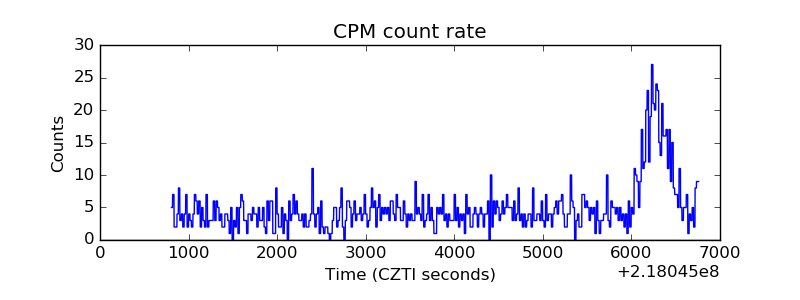 |
| CZT Counter |  |
| +2.5 Volts monitor |  |
| +5 Volts monitor |  |
| _ROLL_ROT | 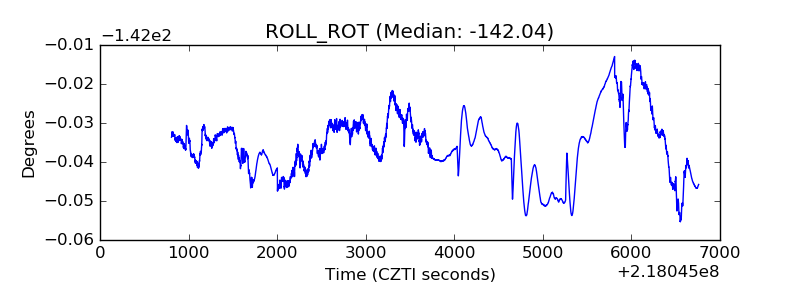 |
| _Roll_DEC | 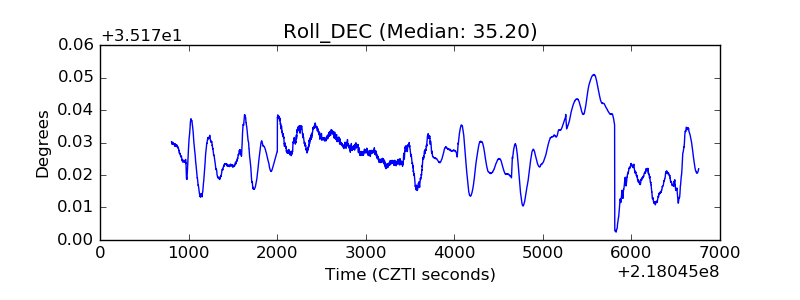 |
| _Roll_RA | 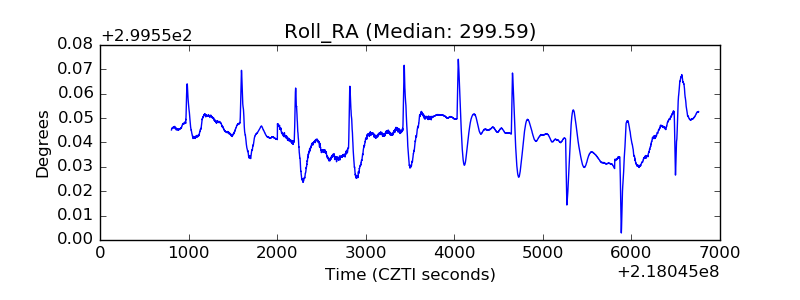 |
| Veto Counter |  |