| Param | Original file | Final file |
|---|---|---|
| Filename | modeM0/AS1G06_151T01_9000000836cztM0_level2.fits | modeM0/AS1G06_151T01_9000000836cztM0_level2_quad_clean.evt |
| Size (bytes) | 559,483,200 | 541,391,040 |
| Size | 533.6 MB | 516.3 MB |
| Events in quadrant A | 3,417,280 | 3,272,668 |
| Events in quadrant B | 3,267,436 | 3,183,756 |
| Events in quadrant C | 3,353,096 | 3,109,815 |
| Events in quadrant D | 2,731,630 | 2,658,026 |
| Mode M0 | |||
|---|---|---|---|
| Quadrant | BADHDUFLAG | Total packets | Discarded packets |
| A | 0 | 129194 | 0 |
| B | 0 | 146148 | 0 |
| C | 0 | 125266 | 0 |
| D | 0 | 206124 | 0 |
| Mode M9 | |||
|---|---|---|---|
| Quadrant | BADHDUFLAG | Total packets | Discarded packets |
| A | 0 | 103 | 0 |
| B | 0 | 103 | 0 |
| C | 0 | 103 | 0 |
| D | 0 | 103 | 0 |
| Mode SS | |||
|---|---|---|---|
| Quadrant | BADHDUFLAG | Total packets | Discarded packets |
| A | 0 | 1236 | 0 |
| B | 0 | 1236 | 0 |
| C | 0 | 1236 | 0 |
| D | 0 | 1236 | 0 |
| Quadrant | Total seconds | Saturated seconds | Saturation percentage |
|---|---|---|---|
| A | 60825 | 696 | 1.144266% |
| B | 60825 | 2435 | 4.003288% |
| C | 60825 | 399 | 0.655980% |
| D | 60825 | 6263 | 10.296753% |
Noise dominated data is calculated using 1-second bins in cleaned event files. If a bin has >2000 counts, and if more than 50% of those come from <1% of pixels, then it is considered to be noise-dominated and hence unusable.
| Quadrant | # 1 sec bins | Bins with >0 counts | Bins with >2000 counts | High rate bins dominated by noise | Noise dominated (total time) | Noise dominated (detector-on time) | Marked lightcurve |
|---|---|---|---|---|---|---|---|
| A | 70870 | 60791 | 0 | 0 | 0.00% | 0.00% | 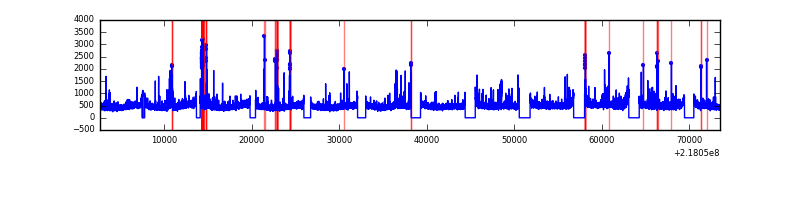 |
| B | 70870 | 60797 | 0 | 0 | 0.00% | 0.00% |  |
| C | 70870 | 60822 | 0 | 0 | 0.00% | 0.00% |  |
| D | 70870 | 60684 | 0 | 0 | 0.00% | 0.00% | 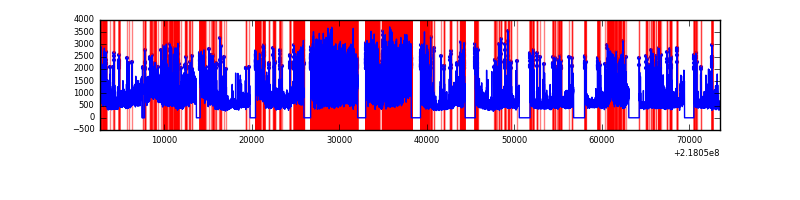 |
Top three noisy pixels from each quadrant. If the there are fewer than three noisy pixels in the level2.evt file, extra rows are filled as -1
| Pixel properties | Quadrant properties | ||||||
|---|---|---|---|---|---|---|---|
| Quadrant | DetID | PixID | Counts | Sigma | Mean | Median | Sigma |
| A | 0 | 29 | 3415 | 11.45 | 888 | 829 | 225.8 |
| A | 7 | 110 | 2981 | 9.53 | 888 | 829 | 225.8 |
| A | 0 | 30 | 2637 | 8.01 | 888 | 829 | 225.8 |
| B | 2 | 9 | 2745 | 10.94 | 861 | 817 | 176.3 |
| B | 12 | 226 | 2260 | 8.19 | 861 | 817 | 176.3 |
| B | 5 | 128 | 2207 | 7.88 | 861 | 817 | 176.3 |
| C | 12 | 241 | 2518 | 7.14 | 885 | 818 | 238.0 |
| C | 1 | 80 | 2427 | 6.76 | 885 | 818 | 238.0 |
| C | 1 | 81 | 2383 | 6.58 | 885 | 818 | 238.0 |
| D | 7 | 5 | 2070 | 6.42 | 779 | 704 | 212.8 |
| D | 6 | 231 | 2051 | 6.33 | 779 | 704 | 212.8 |
| D | 3 | 14 | 2045 | 6.3 | 779 | 704 | 212.8 |
Histogram calculated using DETX and DETY for each event in the final _common_clean file
| Quadrant A | 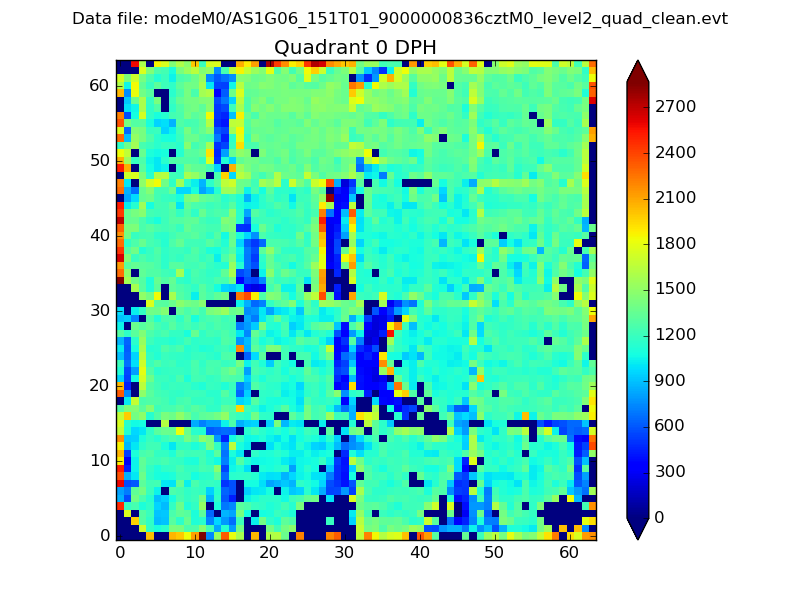 |
 |
Quadrant B |
|---|---|---|---|
| Quadrant D | 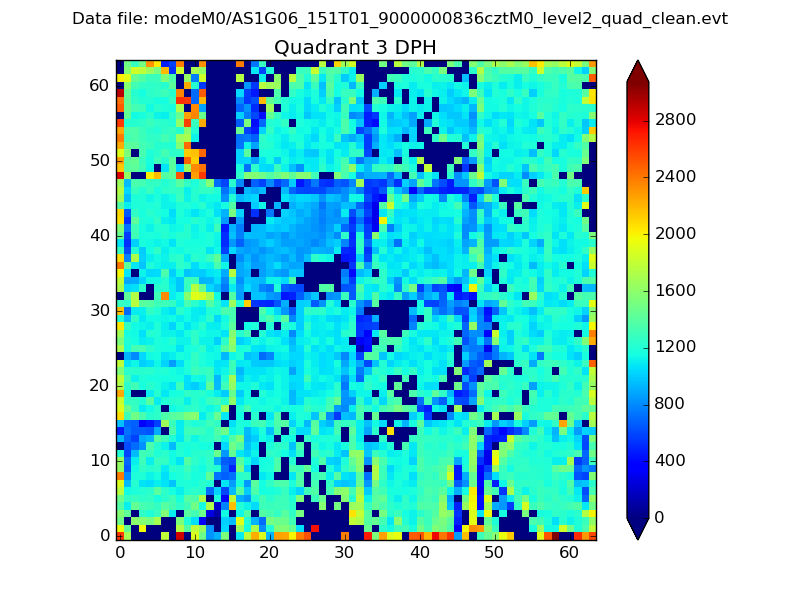 |
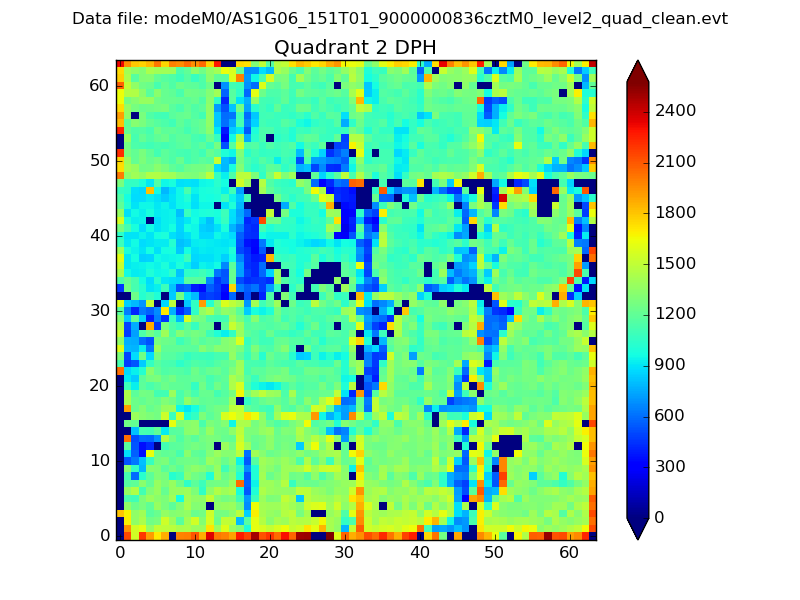 |
Quadrant C |
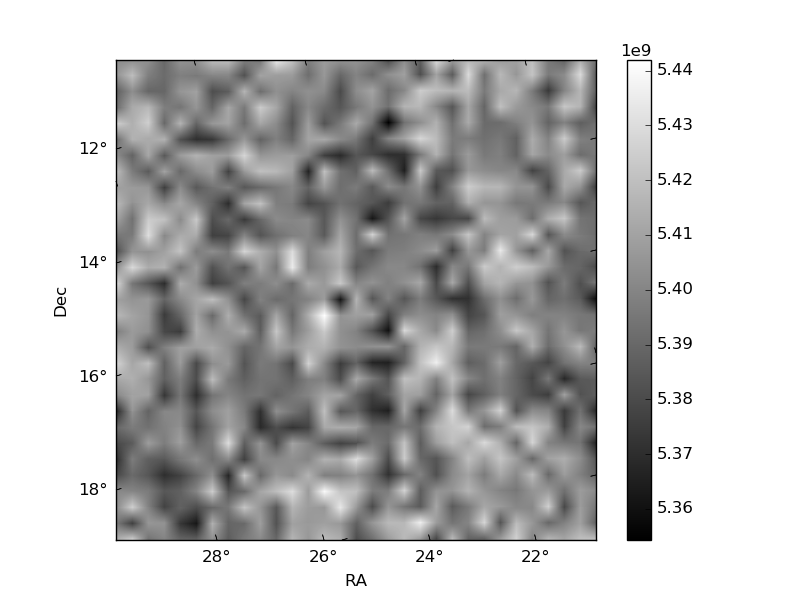
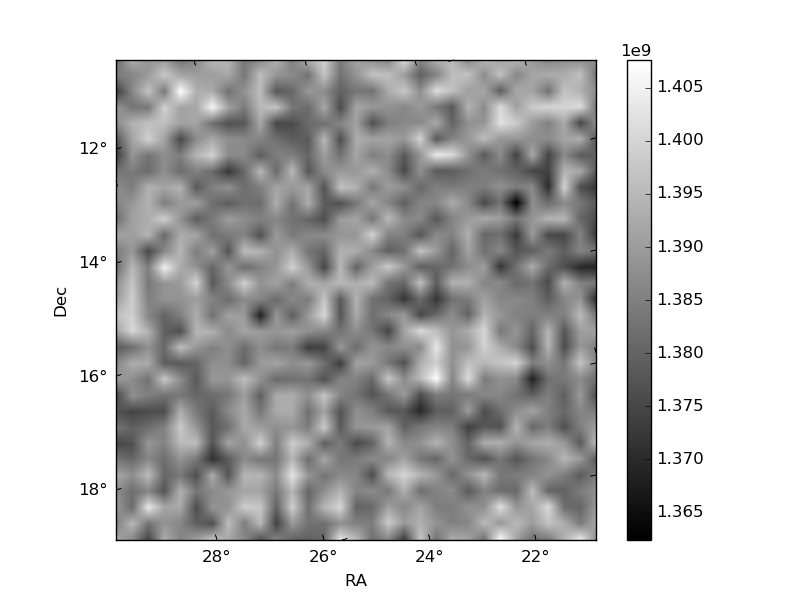
| Plot type | Count rate plots | Images |
|---|---|---|
| Comparison with Poisson distribution Blue bars denote a histogram of data divided into 1 sec bins. Red curve is a Poisson curve with rate = median count rate of data. |
 |
 |
| Quadrant-wise count rates Data is divided into 100 sec bins |
 |
|
| Module-wise count rates for Quadrant A Data is divided into 100 sec bins |
 |
 |
| Module-wise count rates for Quadrant B Data is divided into 100 sec bins |
 |
 |
| Module-wise count rates for Quadrant C Data is divided into 100 sec bins |
 |
 |
| Module-wise count rates for Quadrant D Data is divided into 100 sec bins |
 |
 |
| Parameter | Plot |
|---|---|
| CZT HV Monitor |  |
| D_VDD | 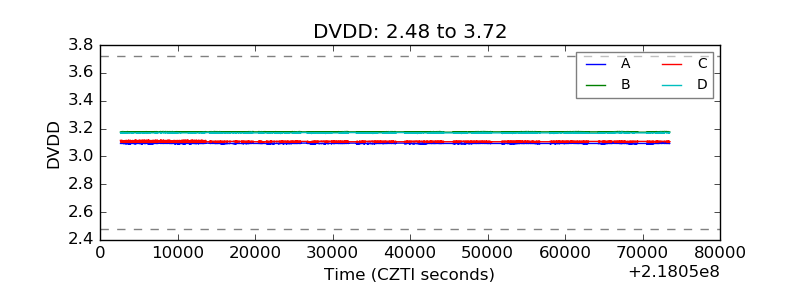 |
| Temperature 1 | 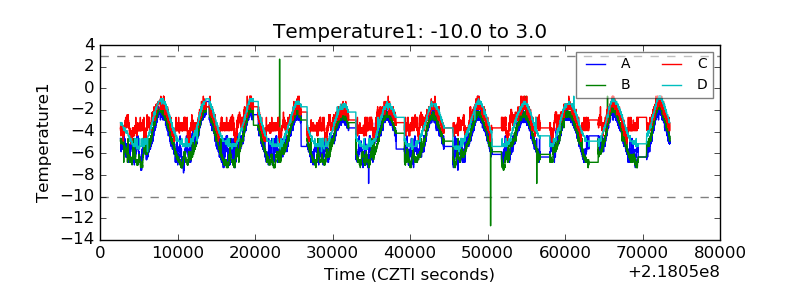 |
| Veto HV Monitor | 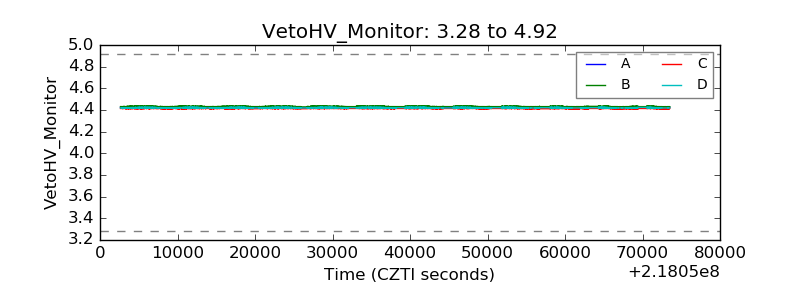 |
| Veto LLD |  |
| Alpha Counter |  |
| _CPM_Rate | 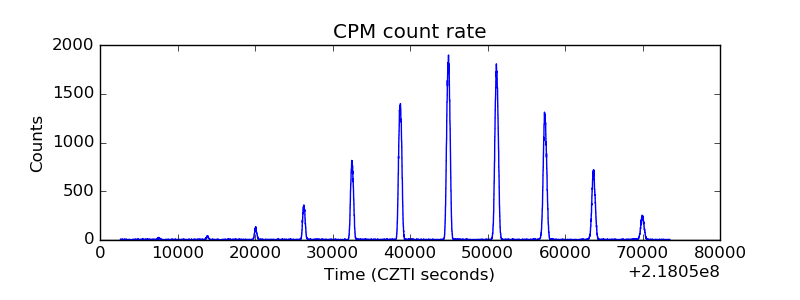 |
| CZT Counter |  |
| +2.5 Volts monitor |  |
| +5 Volts monitor |  |
| _ROLL_ROT |  |
| _Roll_DEC | 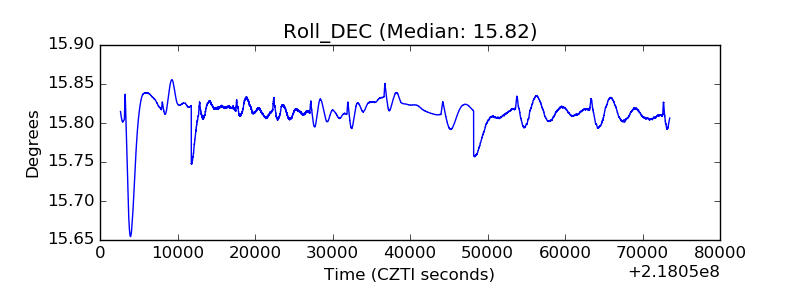 |
| _Roll_RA |  |
| Veto Counter | 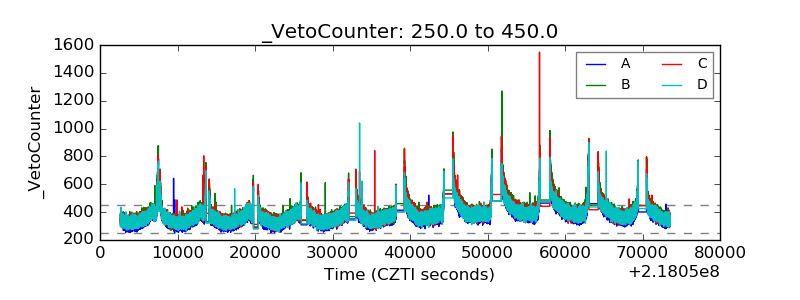 |