| Param | Original file | Final file |
|---|---|---|
| Filename | modeM0/AS1G06_151T01_9000000836_06329cztM0_level2.evt | modeM0/AS1G06_151T01_9000000836_06329cztM0_level2_quad_clean.evt |
| Size (bytes) | 30,329,280 | 6,649,920 |
| Size | 28.9 MB | 6.3 MB |
| Events in quadrant A | 159,476 | 42,423 |
| Events in quadrant B | 169,626 | 42,164 |
| Events in quadrant C | 152,375 | 41,958 |
| Events in quadrant D | 408,202 | 40,107 |
| Mode M0 | |||
|---|---|---|---|
| Quadrant | BADHDUFLAG | Total packets | Discarded packets |
| A | 0 | 739 | 1 |
| B | 0 | 771 | 0 |
| C | 0 | 738 | 0 |
| D | 0 | 1480 | 0 |
| Mode SS | |||
|---|---|---|---|
| Quadrant | BADHDUFLAG | Total packets | Discarded packets |
| A | 0 | 8 | 0 |
| B | 0 | 8 | 0 |
| C | 0 | 8 | 0 |
| D | 0 | 8 | 0 |
| Quadrant | Total seconds | Saturated seconds | Saturation percentage |
|---|---|---|---|
| A | 369 | 0 | 0.000000% |
| B | 369 | 0 | 0.000000% |
| C | 369 | 0 | 0.000000% |
| D | 369 | 17 | 4.607046% |
Noise dominated data is calculated using 1-second bins in cleaned event files. If a bin has >2000 counts, and if more than 50% of those come from <1% of pixels, then it is considered to be noise-dominated and hence unusable.
| Quadrant | # 1 sec bins | Bins with >0 counts | Bins with >2000 counts | High rate bins dominated by noise | Noise dominated (total time) | Noise dominated (detector-on time) | Marked lightcurve |
|---|---|---|---|---|---|---|---|
| A | 369 | 369 | 0 | 0 | 0.00% | 0.00% | 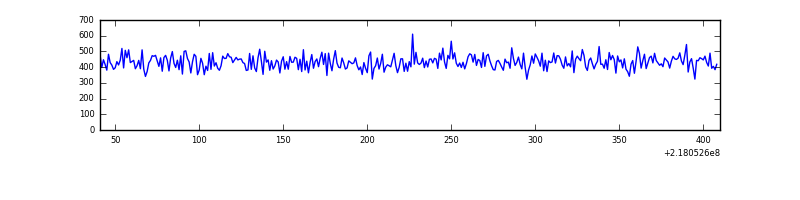 |
| B | 369 | 369 | 0 | 0 | 0.00% | 0.00% |  |
| C | 369 | 369 | 0 | 0 | 0.00% | 0.00% |  |
| D | 369 | 369 | 17 | 17 | 4.61% | 4.61% | 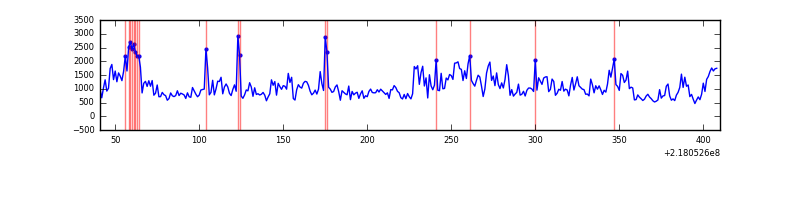 |
Top three noisy pixels from each quadrant. If the there are fewer than three noisy pixels in the level2.evt file, extra rows are filled as -1
| Pixel properties | Quadrant properties | ||||||
|---|---|---|---|---|---|---|---|
| Quadrant | DetID | PixID | Counts | Sigma | Mean | Median | Sigma |
| A | 3 | 1 | 3541 | 333.95 | 40 | 39 | 10.5 |
| A | 12 | 194 | 454 | 39.57 | 40 | 39 | 10.5 |
| A | 13 | 251 | 368 | 31.37 | 40 | 39 | 10.5 |
| B | 3 | 64 | 11969 | 1212.02 | 39 | 38 | 9.8 |
| B | 4 | 81 | 3015 | 302.42 | 39 | 38 | 9.8 |
| B | 0 | 214 | 1418 | 140.19 | 39 | 38 | 9.8 |
| C | 8 | 128 | 862 | 76.25 | 38 | 38 | 10.8 |
| C | 8 | 112 | 438 | 37.01 | 38 | 38 | 10.8 |
| C | 8 | 144 | 369 | 30.63 | 38 | 38 | 10.8 |
| D | 12 | 220 | 153049 | 13111.53 | 38 | 37 | 11.7 |
| D | 12 | 221 | 70960 | 6077.36 | 38 | 37 | 11.7 |
| D | 2 | 63 | 23778 | 2034.36 | 38 | 37 | 11.7 |
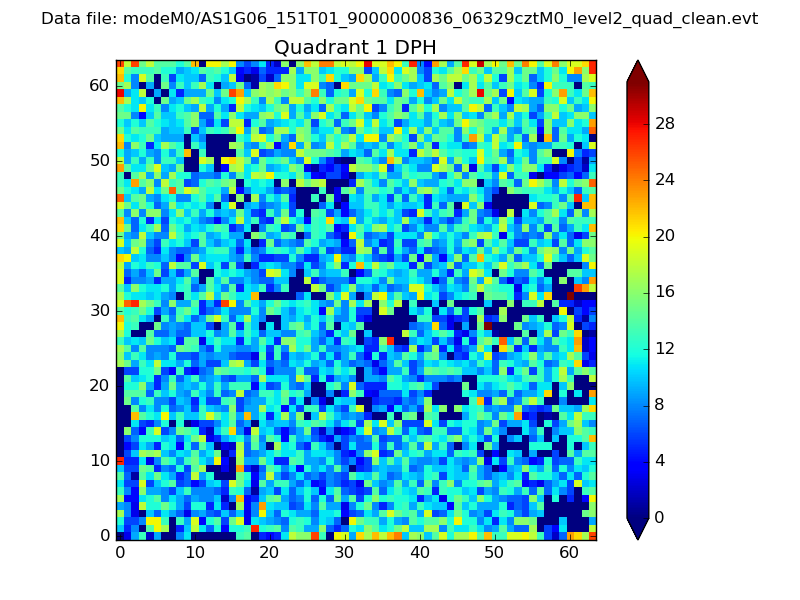
Histogram calculated using DETX and DETY for each event in the final _common_clean file
| Quadrant A |  |
 |
Quadrant B |
|---|---|---|---|
| Quadrant D | 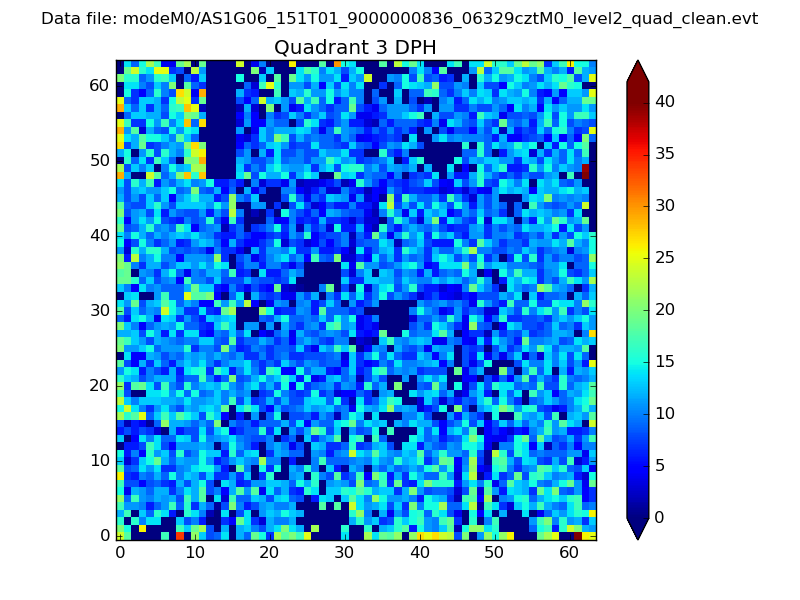 |
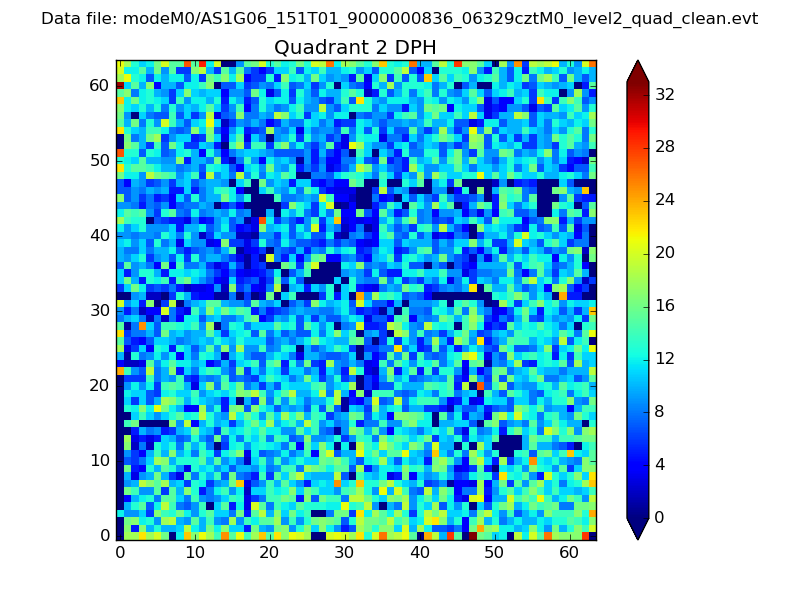 |
Quadrant C |
| Plot type | Count rate plots | Images |
|---|---|---|
| Comparison with Poisson distribution Blue bars denote a histogram of data divided into 1 sec bins. Red curve is a Poisson curve with rate = median count rate of data. |
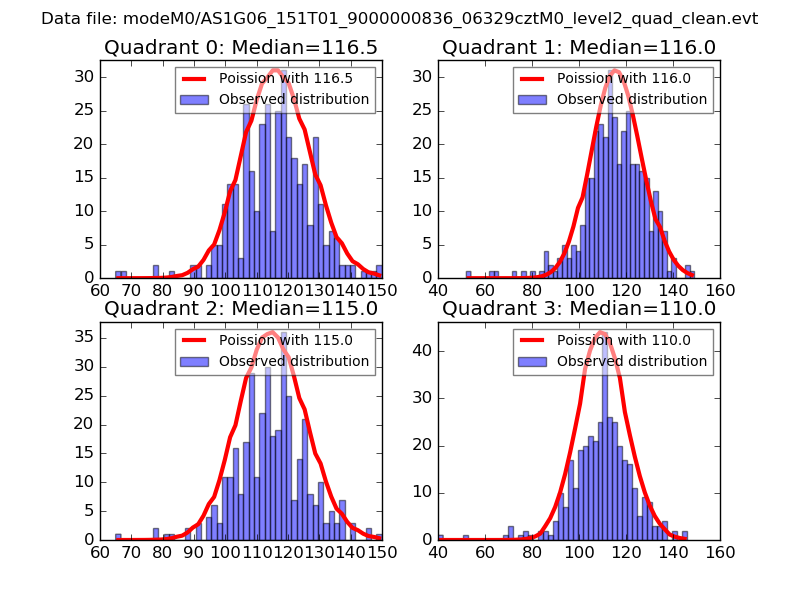 |
 |
| Quadrant-wise count rates Data is divided into 100 sec bins |
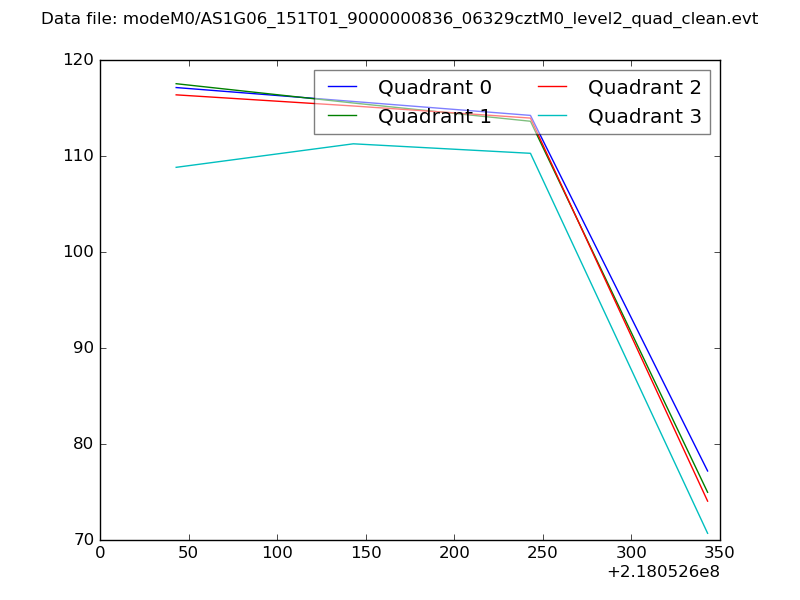 |
|
| Module-wise count rates for Quadrant A Data is divided into 100 sec bins |
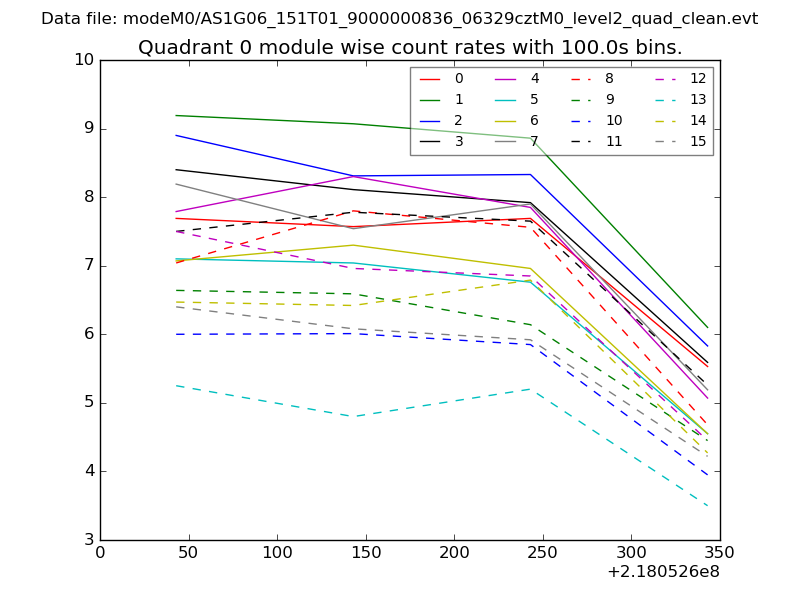 |
 |
| Module-wise count rates for Quadrant B Data is divided into 100 sec bins |
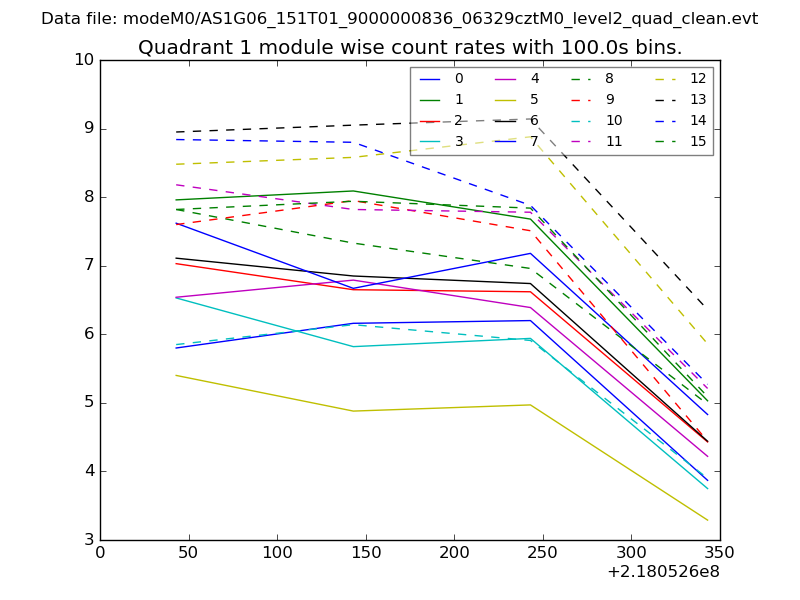 |
 |
| Module-wise count rates for Quadrant C Data is divided into 100 sec bins |
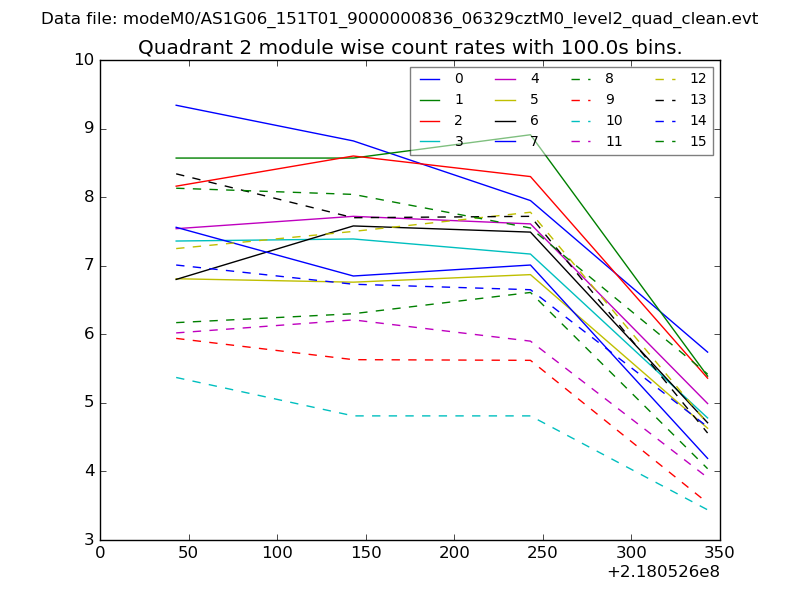 |
 |
| Module-wise count rates for Quadrant D Data is divided into 100 sec bins |
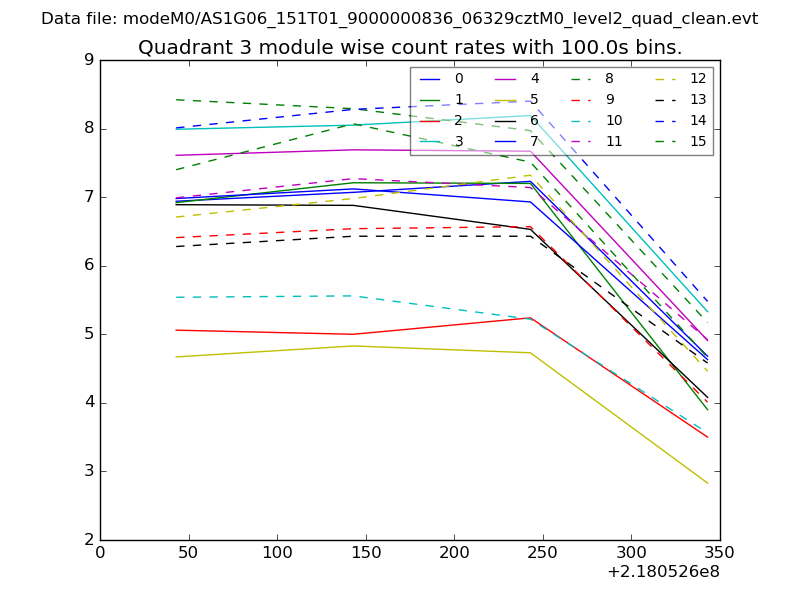 |
 |
| Parameter | Plot |
|---|---|
| CZT HV Monitor | 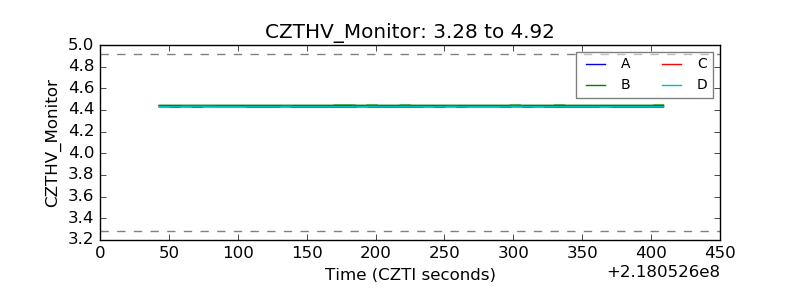 |
| D_VDD | 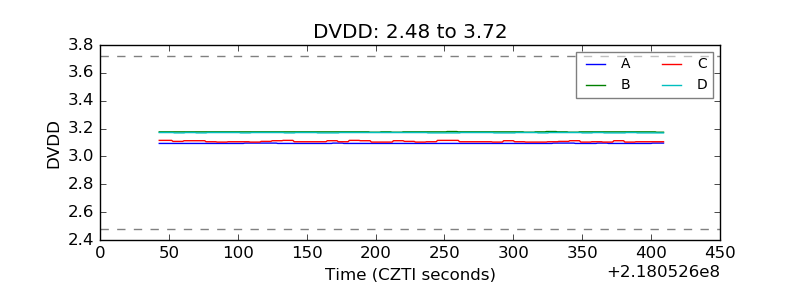 |
| Temperature 1 | 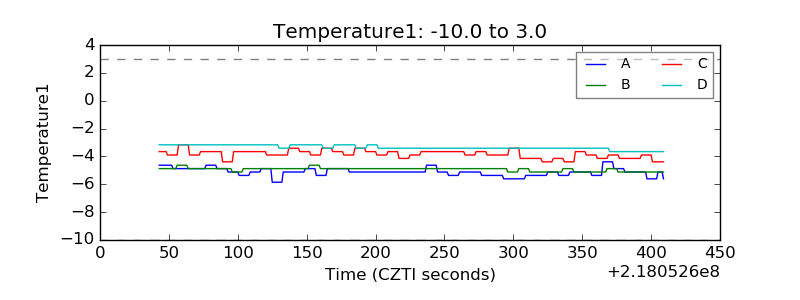 |
| Veto HV Monitor | 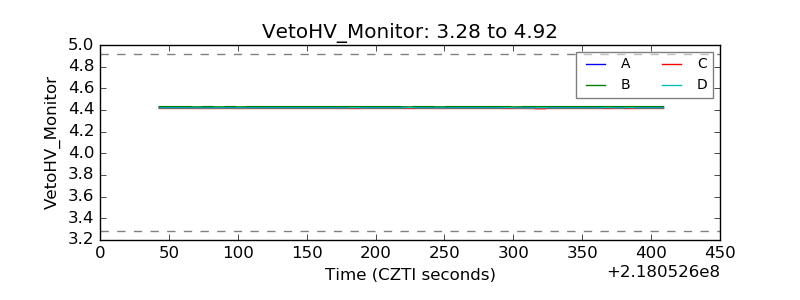 |
| Veto LLD | 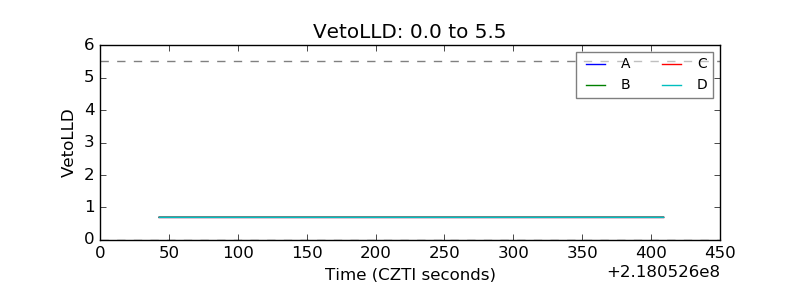 |
| Alpha Counter | 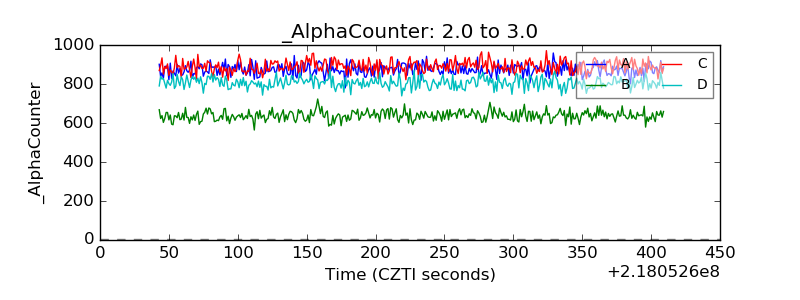 |
| _CPM_Rate | 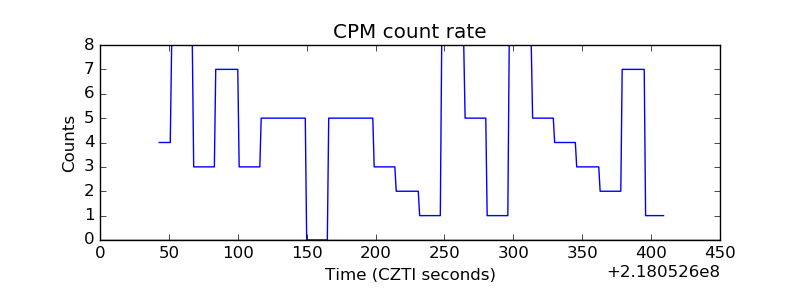 |
| CZT Counter | 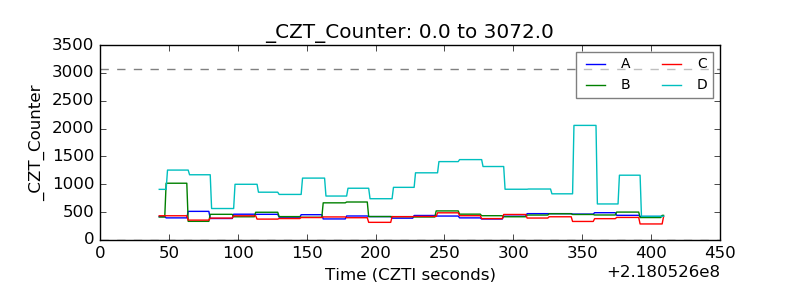 |
| +2.5 Volts monitor |  |
| +5 Volts monitor |  |
| _ROLL_ROT | 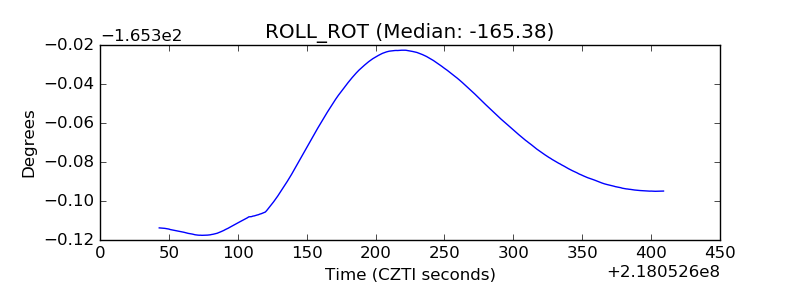 |
| _Roll_DEC | 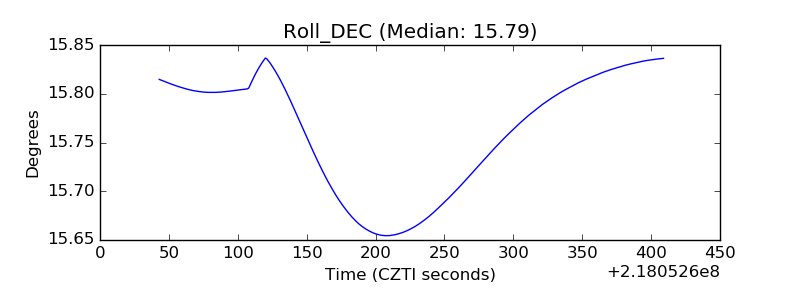 |
| _Roll_RA | 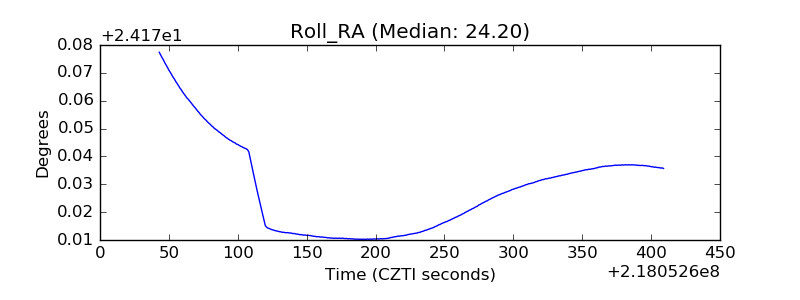 |
| Veto Counter | 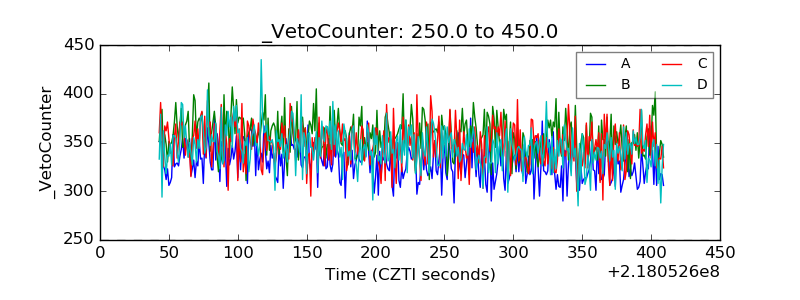 |