| Param | Original file | Final file |
|---|---|---|
| Filename | modeM0/AS1G06_151T01_9000000836_06334cztM0_level2.evt | modeM0/AS1G06_151T01_9000000836_06334cztM0_level2_quad_clean.evt |
| Size (bytes) | 2,136,582,720 | 274,694,400 |
| Size | 2.0 GB | 262.0 MB |
| Events in quadrant A | 11,652,111 | 1,726,908 |
| Events in quadrant B | 13,867,662 | 1,696,749 |
| Events in quadrant C | 10,806,096 | 1,712,940 |
| Events in quadrant D | 26,752,045 | 1,518,206 |
| Mode M0 | |||
|---|---|---|---|
| Quadrant | BADHDUFLAG | Total packets | Discarded packets |
| A | 0 | 51007 | 6 |
| B | 0 | 57661 | 5 |
| C | 0 | 49463 | 5 |
| D | 0 | 96216 | 5 |
| Mode M9 | |||
|---|---|---|---|
| Quadrant | BADHDUFLAG | Total packets | Discarded packets |
| A | 0 | 32 | 0 |
| B | 0 | 32 | 0 |
| C | 0 | 32 | 0 |
| D | 0 | 32 | 0 |
| Mode SS | |||
|---|---|---|---|
| Quadrant | BADHDUFLAG | Total packets | Discarded packets |
| A | 0 | 494 | 0 |
| B | 0 | 494 | 0 |
| C | 0 | 494 | 0 |
| D | 0 | 494 | 0 |
| Quadrant | Total seconds | Saturated seconds | Saturation percentage |
|---|---|---|---|
| A | 24184 | 256 | 1.058551% |
| B | 24184 | 883 | 3.651174% |
| C | 24184 | 81 | 0.334932% |
| D | 24184 | 3710 | 15.340721% |
Noise dominated data is calculated using 1-second bins in cleaned event files. If a bin has >2000 counts, and if more than 50% of those come from <1% of pixels, then it is considered to be noise-dominated and hence unusable.
| Quadrant | # 1 sec bins | Bins with >0 counts | Bins with >2000 counts | High rate bins dominated by noise | Noise dominated (total time) | Noise dominated (detector-on time) | Marked lightcurve |
|---|---|---|---|---|---|---|---|
| A | 27219 | 24190 | 94 | 94 | 0.35% | 0.39% | 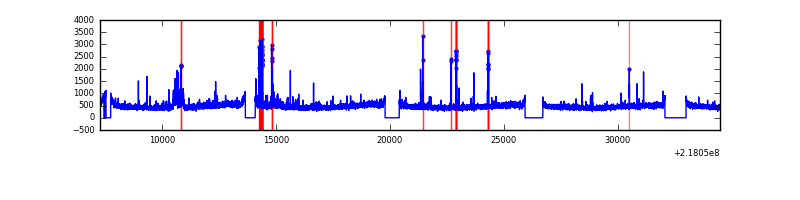 |
| B | 27219 | 24190 | 486 | 486 | 1.79% | 2.01% | 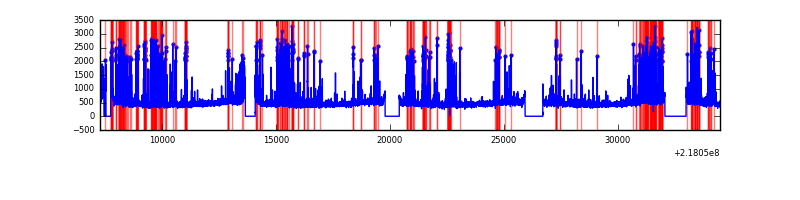 |
| C | 27219 | 24190 | 6 | 6 | 0.02% | 0.02% | 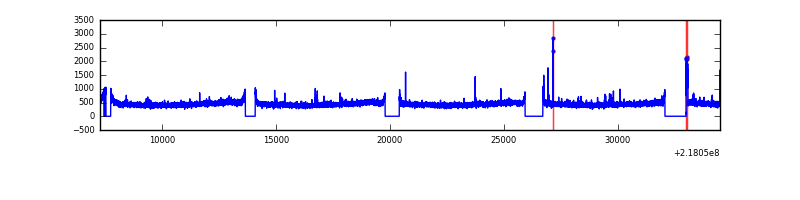 |
| D | 27219 | 24190 | 3108 | 3108 | 11.42% | 12.85% | 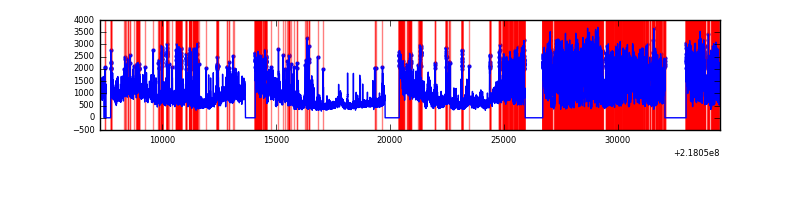 |
Top three noisy pixels from each quadrant. If the there are fewer than three noisy pixels in the level2.evt file, extra rows are filled as -1
| Pixel properties | Quadrant properties | ||||||
|---|---|---|---|---|---|---|---|
| Quadrant | DetID | PixID | Counts | Sigma | Mean | Median | Sigma |
| A | 14 | 111 | 400755 | 700.1 | 2793 | 2730 | 568.5 |
| A | 13 | 251 | 288964 | 503.47 | 2793 | 2730 | 568.5 |
| A | 8 | 15 | 180068 | 311.93 | 2793 | 2730 | 568.5 |
| B | 3 | 64 | 2851689 | 5362.79 | 2783 | 2716 | 531.2 |
| B | 4 | 81 | 82888 | 150.91 | 2783 | 2716 | 531.2 |
| B | 15 | 204 | 78334 | 142.34 | 2783 | 2716 | 531.2 |
| C | 10 | 22 | 66676 | 101.52 | 2714 | 2725 | 629.9 |
| C | 9 | 16 | 59542 | 90.2 | 2714 | 2725 | 629.9 |
| C | 9 | 54 | 39269 | 58.01 | 2714 | 2725 | 629.9 |
| D | 12 | 221 | 6080040 | 9771.98 | 2534 | 2458 | 621.9 |
| D | 4 | 95 | 5684562 | 9136.1 | 2534 | 2458 | 621.9 |
| D | 12 | 220 | 3567296 | 5731.8 | 2534 | 2458 | 621.9 |
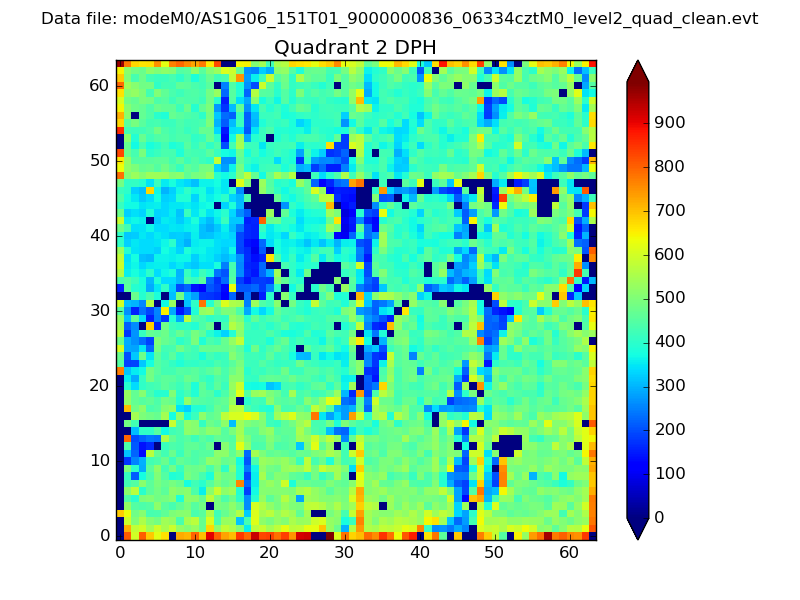
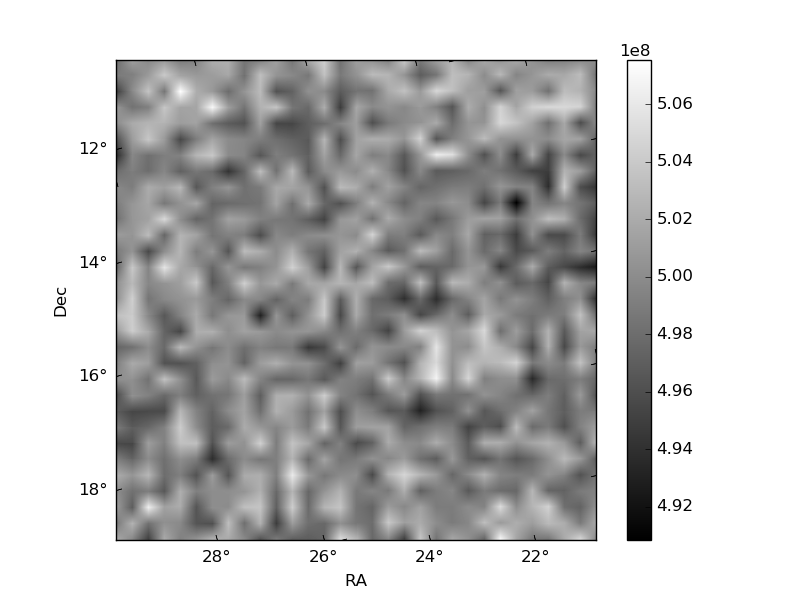
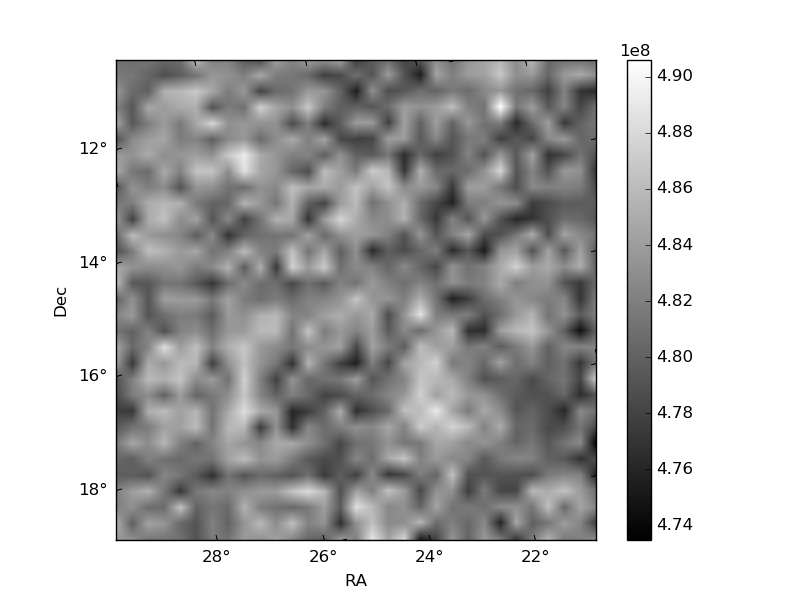
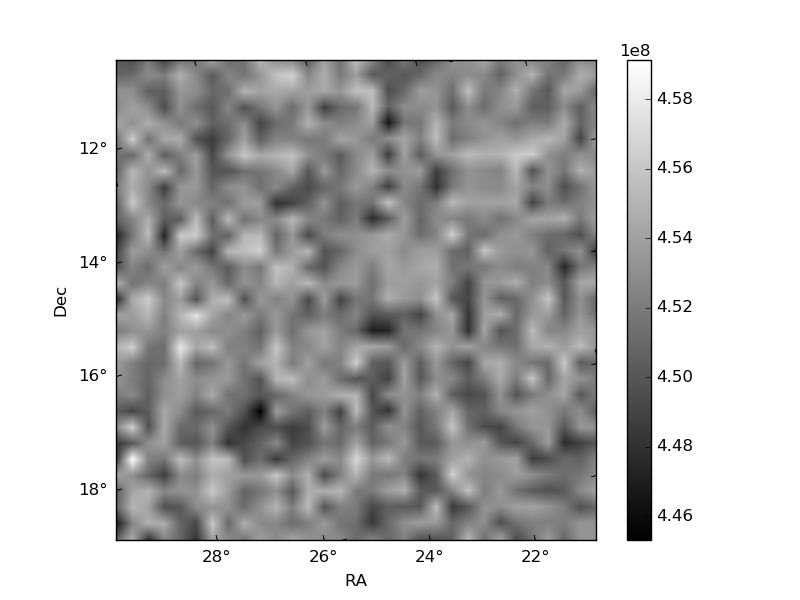
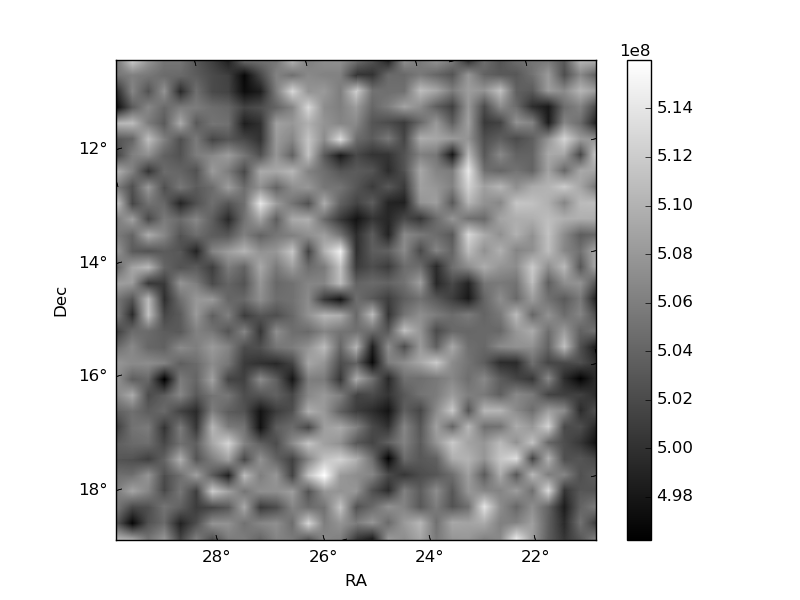
Histogram calculated using DETX and DETY for each event in the final _common_clean file
| Quadrant A | 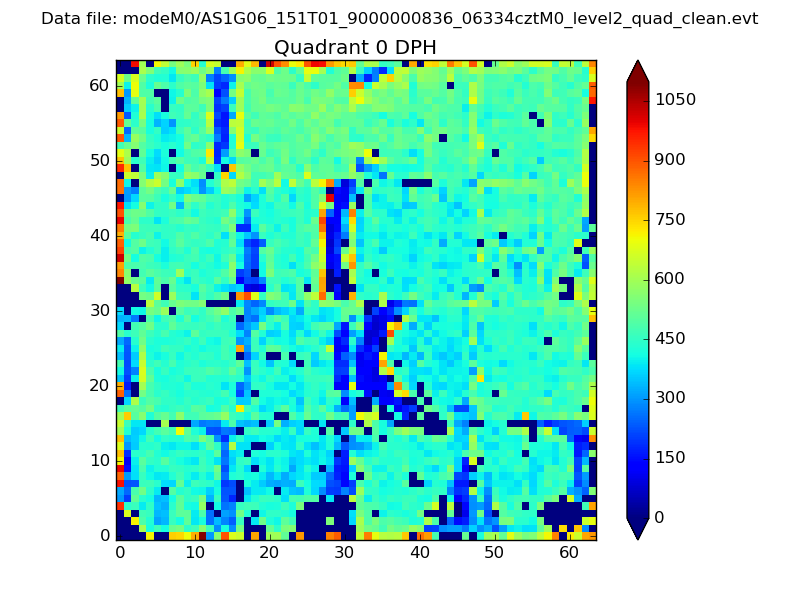 |
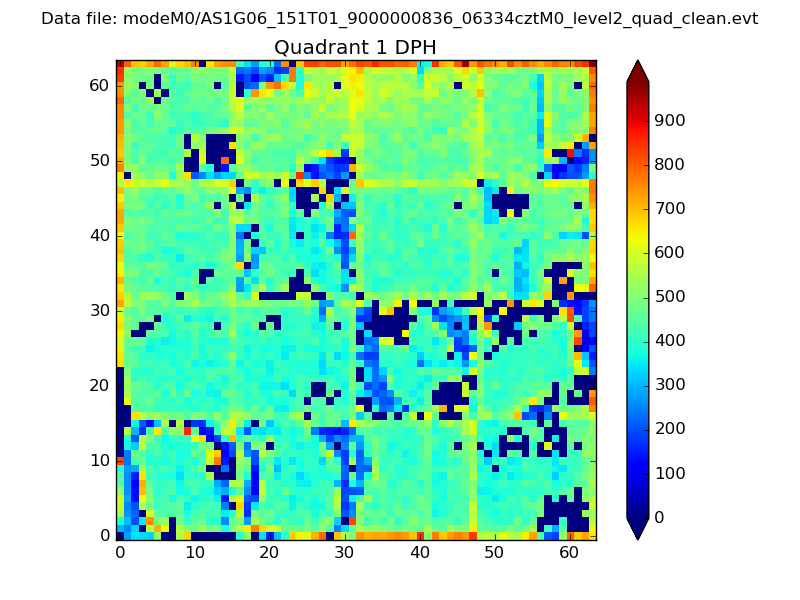 |
Quadrant B |
|---|---|---|---|
| Quadrant D | 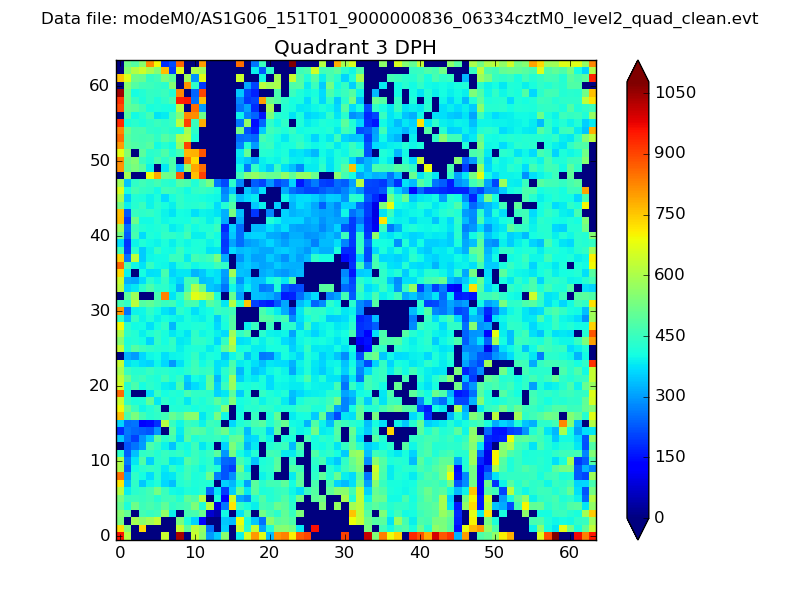 |
 |
Quadrant C |
| Plot type | Count rate plots | Images |
|---|---|---|
| Comparison with Poisson distribution Blue bars denote a histogram of data divided into 1 sec bins. Red curve is a Poisson curve with rate = median count rate of data. |
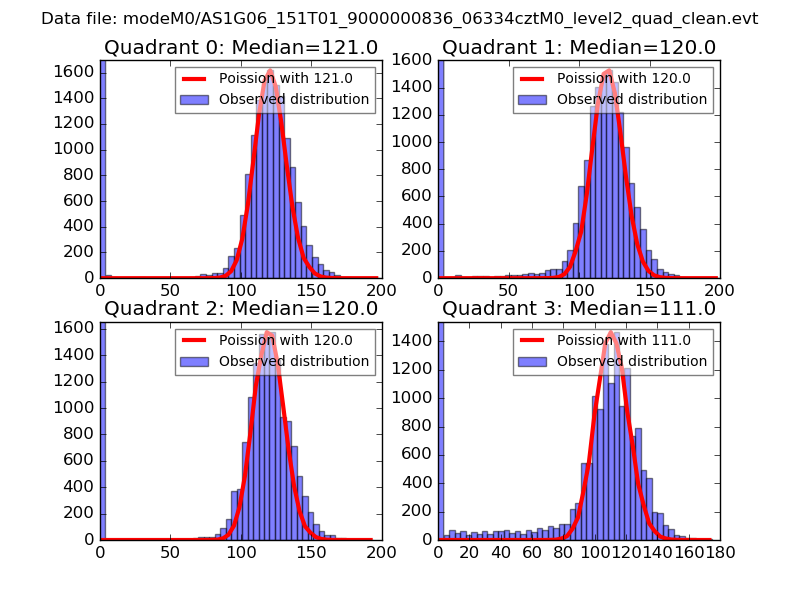 |
 |
| Quadrant-wise count rates Data is divided into 100 sec bins |
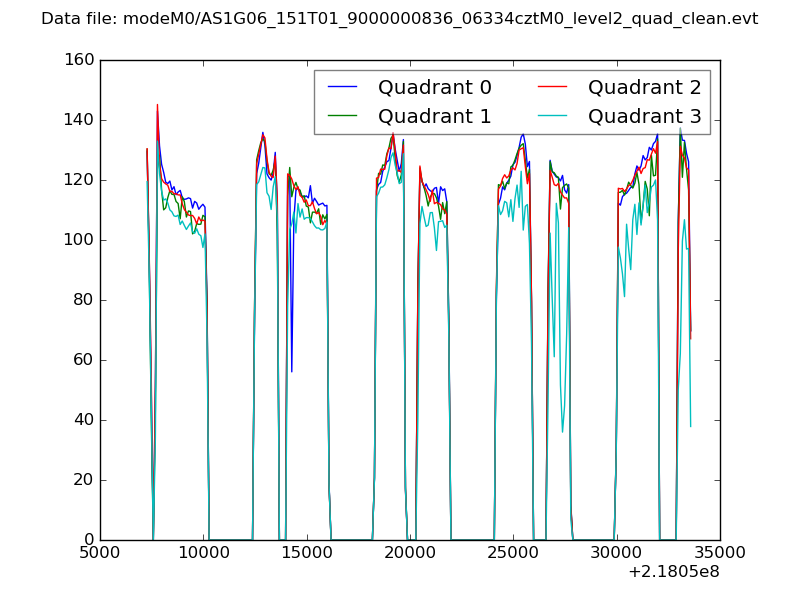 |
|
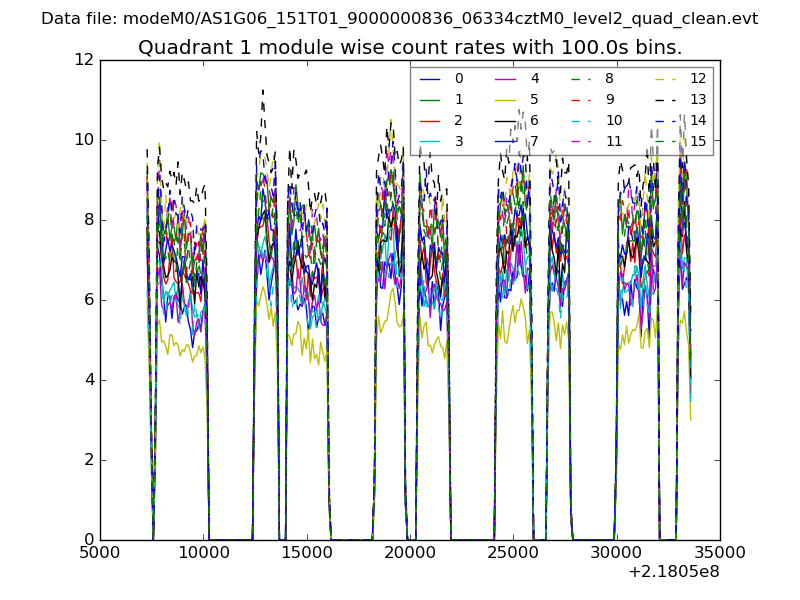
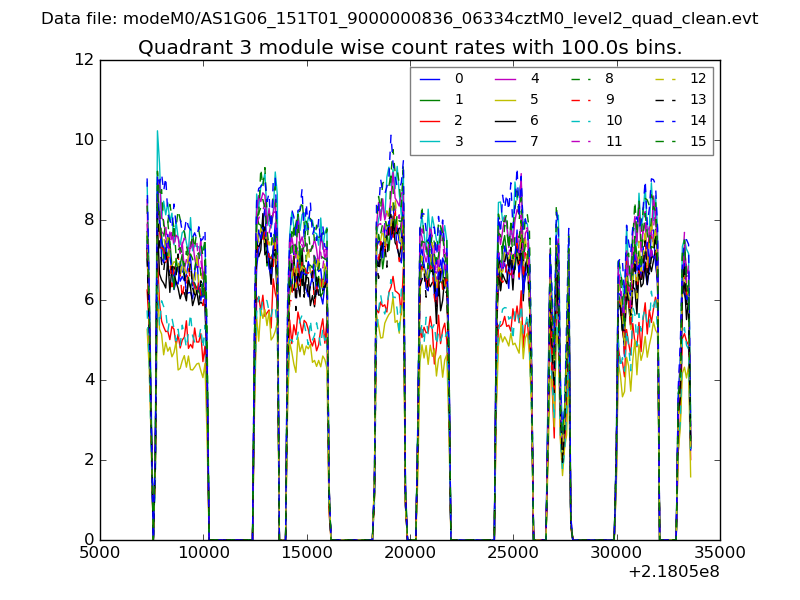
| Module-wise count rates for Quadrant A Data is divided into 100 sec bins |
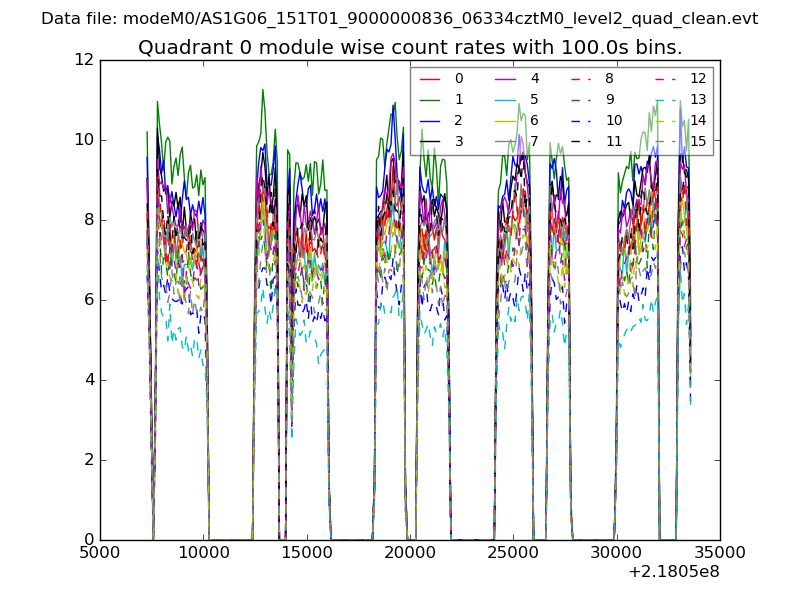 |
 |
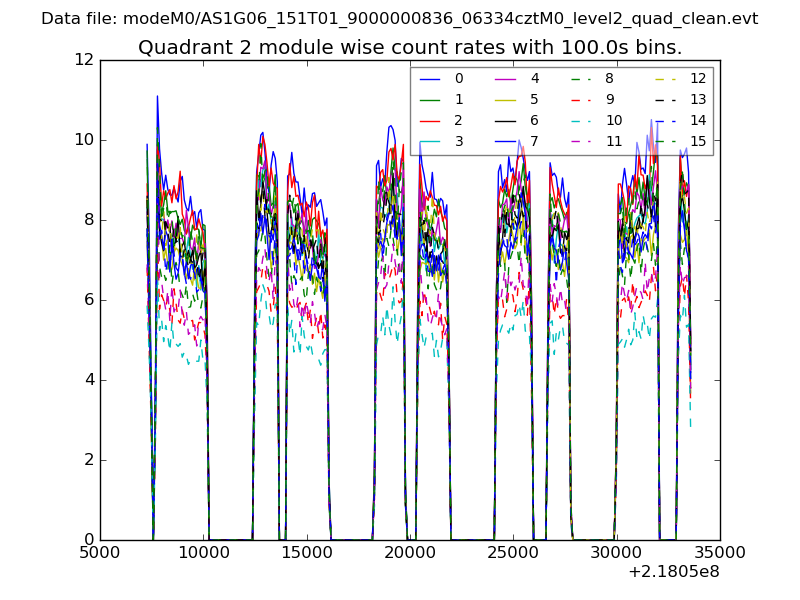
| Module-wise count rates for Quadrant B Data is divided into 100 sec bins |
 |
 |
| Module-wise count rates for Quadrant C Data is divided into 100 sec bins |
 |
 |
| Module-wise count rates for Quadrant D Data is divided into 100 sec bins |
 |
 |
| Parameter | Plot |
|---|---|
| CZT HV Monitor | 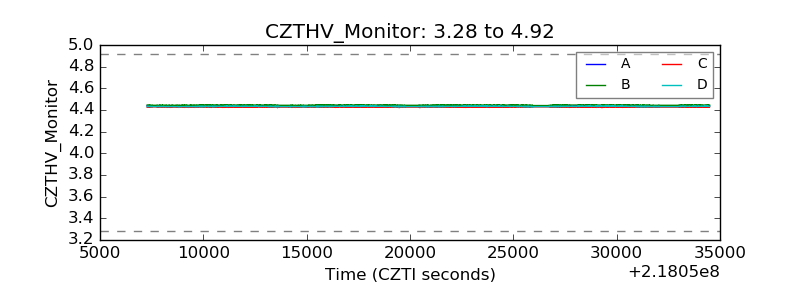 |
| D_VDD |  |
| Temperature 1 | 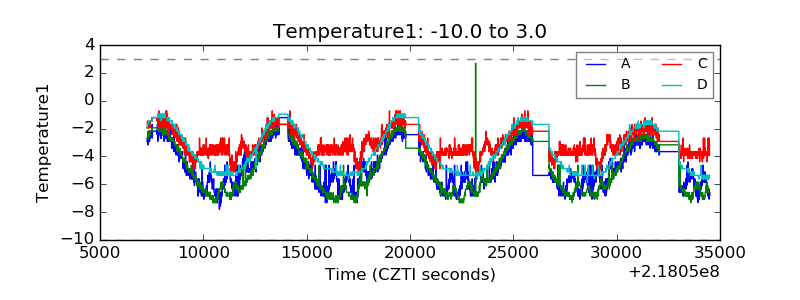 |
| Veto HV Monitor |  |
| Veto LLD | 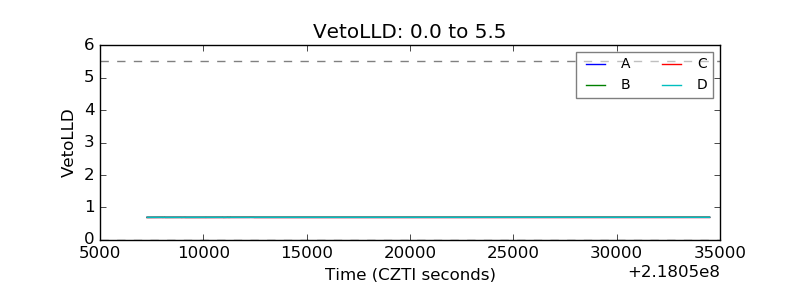 |
| Alpha Counter | 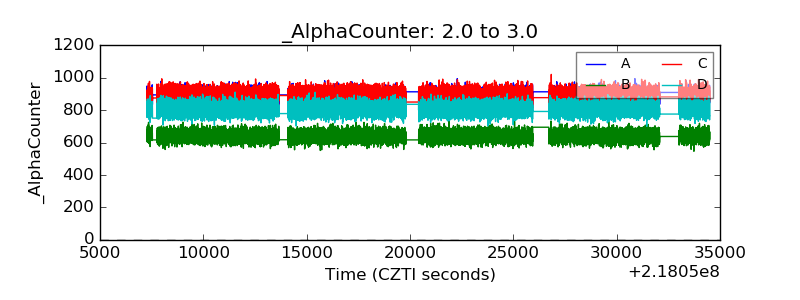 |
| _CPM_Rate | 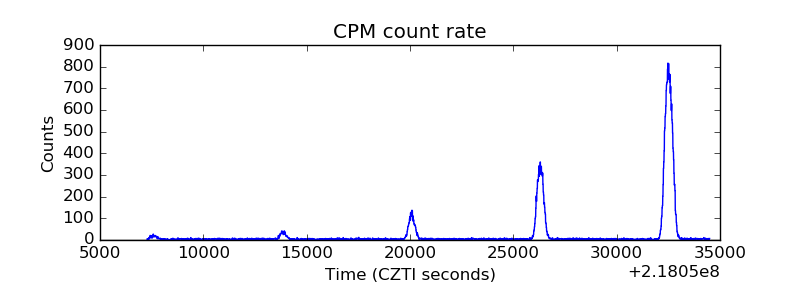 |
| CZT Counter | 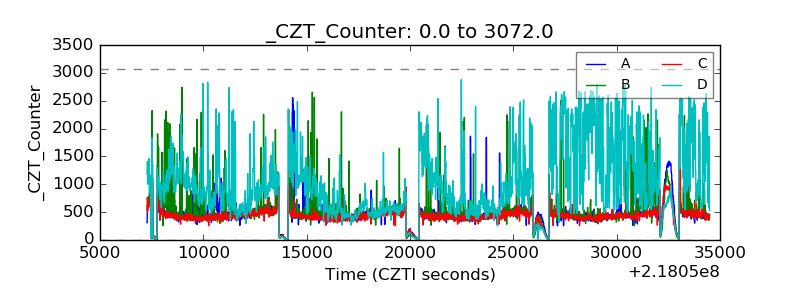 |
| +2.5 Volts monitor |  |
| +5 Volts monitor |  |
| _ROLL_ROT | 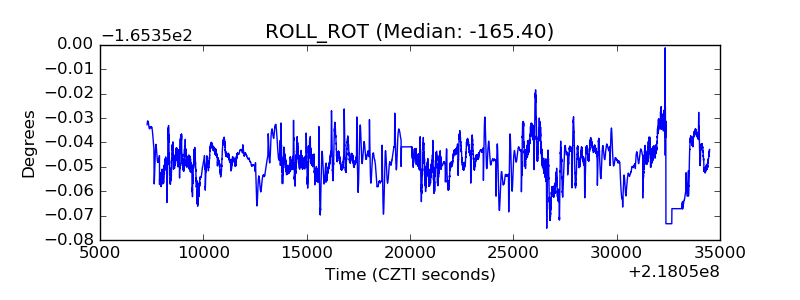 |
| _Roll_DEC | 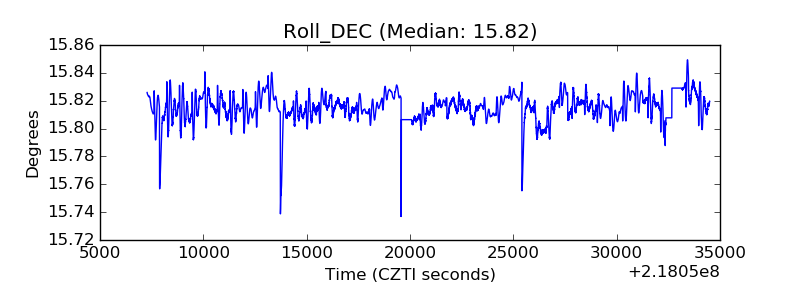 |
| _Roll_RA |  |
| Veto Counter | 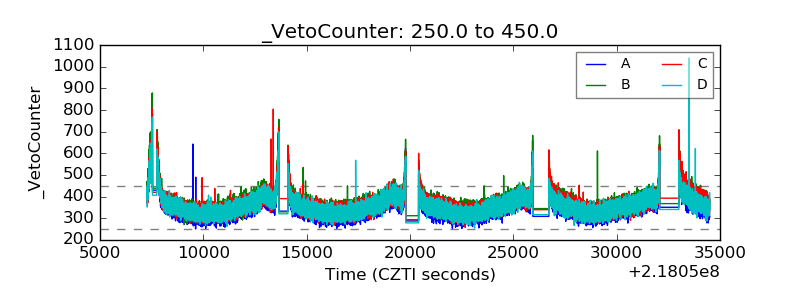 |