| Param | Original file | Final file |
|---|---|---|
| Filename | modeM0/AS1G06_151T01_9000000836_06335cztM0_level2.evt | modeM0/AS1G06_151T01_9000000836_06335cztM0_level2_quad_clean.evt |
| Size (bytes) | 673,441,920 | 60,770,880 |
| Size | 642.2 MB | 58.0 MB |
| Events in quadrant A | 3,230,606 | 374,127 |
| Events in quadrant B | 4,610,716 | 366,715 |
| Events in quadrant C | 2,917,233 | 372,120 |
| Events in quadrant D | 9,200,010 | 276,131 |
| Mode M0 | |||
|---|---|---|---|
| Quadrant | BADHDUFLAG | Total packets | Discarded packets |
| A | 0 | 13828 | 2 |
| B | 0 | 17970 | 1 |
| C | 0 | 13083 | 1 |
| D | 0 | 31780 | 1 |
| Mode M9 | |||
|---|---|---|---|
| Quadrant | BADHDUFLAG | Total packets | Discarded packets |
| A | 0 | 10 | 0 |
| B | 0 | 10 | 0 |
| C | 0 | 10 | 0 |
| D | 0 | 10 | 0 |
| Mode SS | |||
|---|---|---|---|
| Quadrant | BADHDUFLAG | Total packets | Discarded packets |
| A | 0 | 132 | 0 |
| B | 0 | 132 | 0 |
| C | 0 | 132 | 0 |
| D | 0 | 132 | 0 |
| Quadrant | Total seconds | Saturated seconds | Saturation percentage |
|---|---|---|---|
| A | 6448 | 31 | 0.480769% |
| B | 6448 | 533 | 8.266129% |
| C | 6448 | 8 | 0.124069% |
| D | 6448 | 2114 | 32.785360% |
Noise dominated data is calculated using 1-second bins in cleaned event files. If a bin has >2000 counts, and if more than 50% of those come from <1% of pixels, then it is considered to be noise-dominated and hence unusable.
| Quadrant | # 1 sec bins | Bins with >0 counts | Bins with >2000 counts | High rate bins dominated by noise | Noise dominated (total time) | Noise dominated (detector-on time) | Marked lightcurve |
|---|---|---|---|---|---|---|---|
| A | 7518 | 6449 | 2 | 2 | 0.03% | 0.03% | 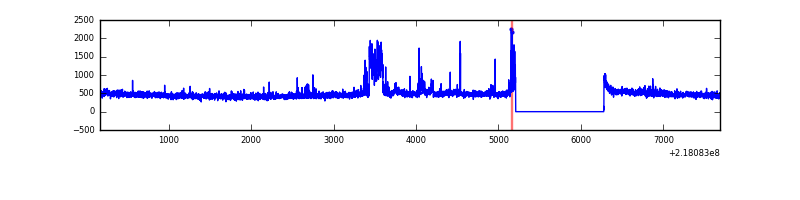 |
| B | 7518 | 6449 | 395 | 395 | 5.25% | 6.12% | 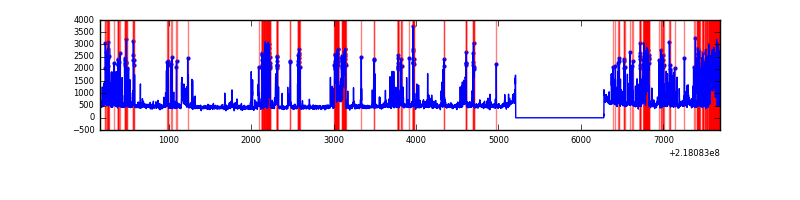 |
| C | 7518 | 6449 | 0 | 0 | 0.00% | 0.00% | 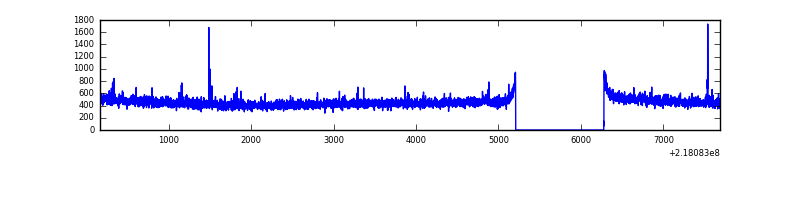 |
| D | 7518 | 6449 | 1890 | 1890 | 25.14% | 29.31% | 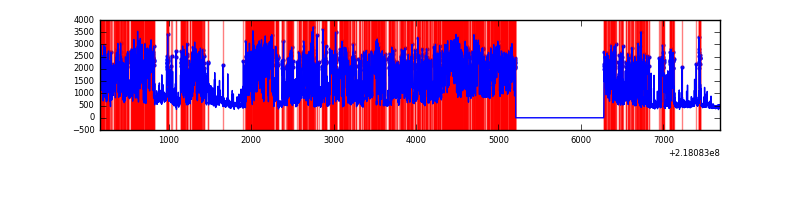 |
Top three noisy pixels from each quadrant. If the there are fewer than three noisy pixels in the level2.evt file, extra rows are filled as -1
| Pixel properties | Quadrant properties | ||||||
|---|---|---|---|---|---|---|---|
| Quadrant | DetID | PixID | Counts | Sigma | Mean | Median | Sigma |
| A | 14 | 111 | 215406 | 1387.6 | 756 | 742 | 154.7 |
| A | 8 | 15 | 70531 | 451.12 | 756 | 742 | 154.7 |
| A | 13 | 251 | 17074 | 105.57 | 756 | 742 | 154.7 |
| B | 3 | 64 | 1642534 | 11554.66 | 740 | 723 | 142.1 |
| B | 11 | 51 | 52045 | 361.19 | 740 | 723 | 142.1 |
| B | 4 | 81 | 28451 | 195.14 | 740 | 723 | 142.1 |
| C | 9 | 16 | 20997 | 118.28 | 735 | 739 | 171.3 |
| C | 9 | 54 | 18144 | 101.62 | 735 | 739 | 171.3 |
| C | 4 | 254 | 8733 | 46.67 | 735 | 739 | 171.3 |
| D | 4 | 95 | 3193601 | 20462.09 | 625 | 607 | 156.0 |
| D | 12 | 220 | 2233791 | 14311.21 | 625 | 607 | 156.0 |
| D | 12 | 221 | 845355 | 5413.51 | 625 | 607 | 156.0 |
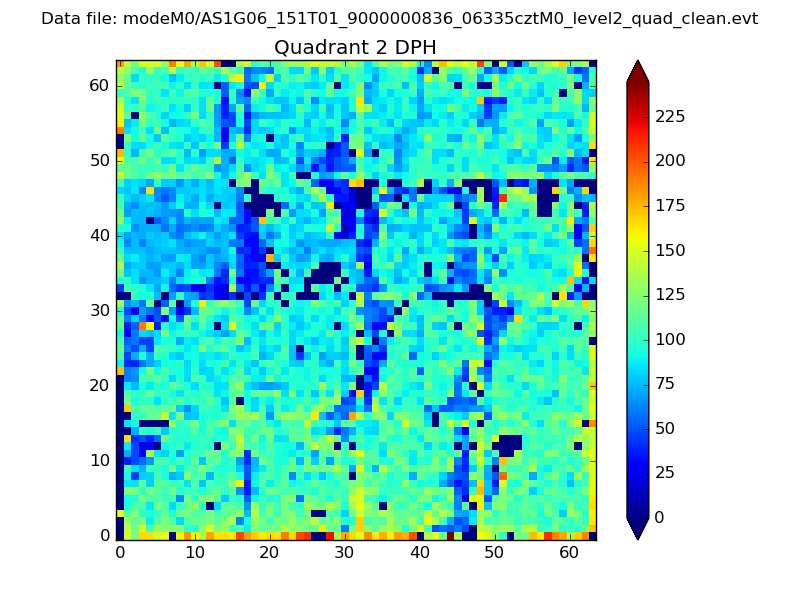
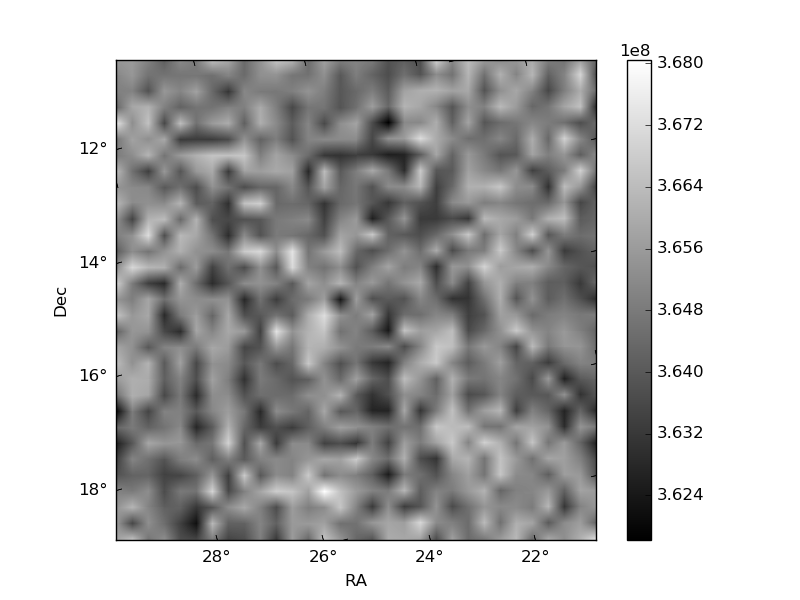
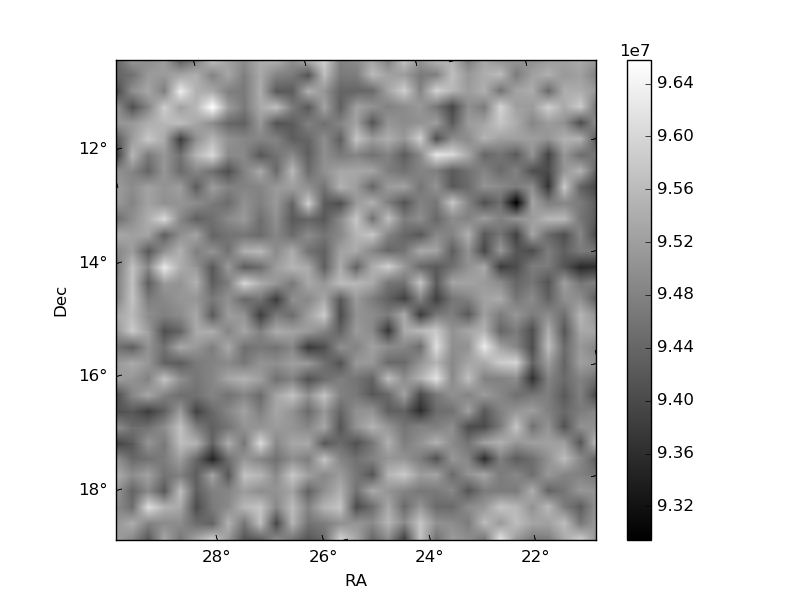
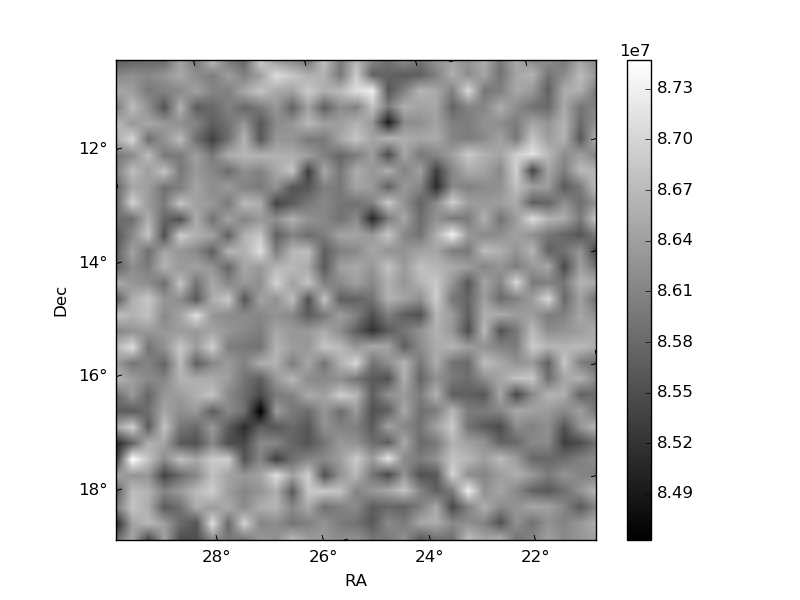
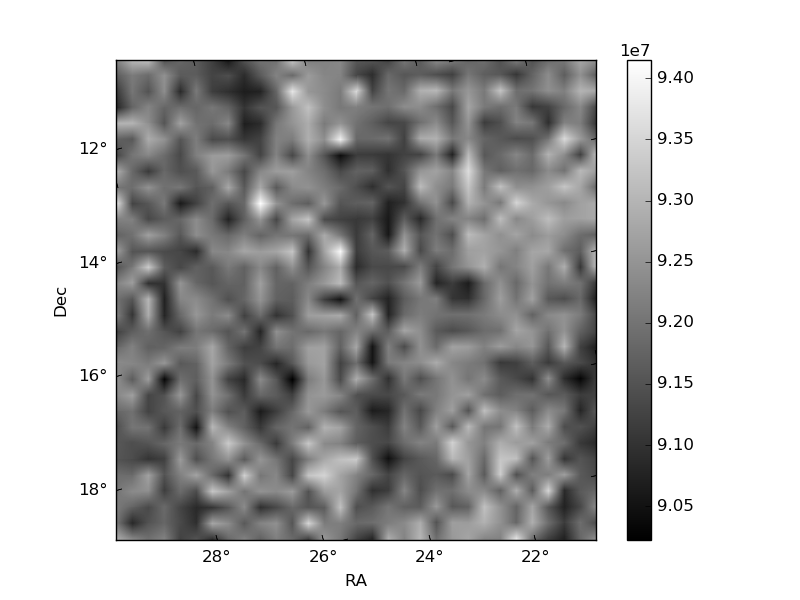
Histogram calculated using DETX and DETY for each event in the final _common_clean file
| Quadrant A | 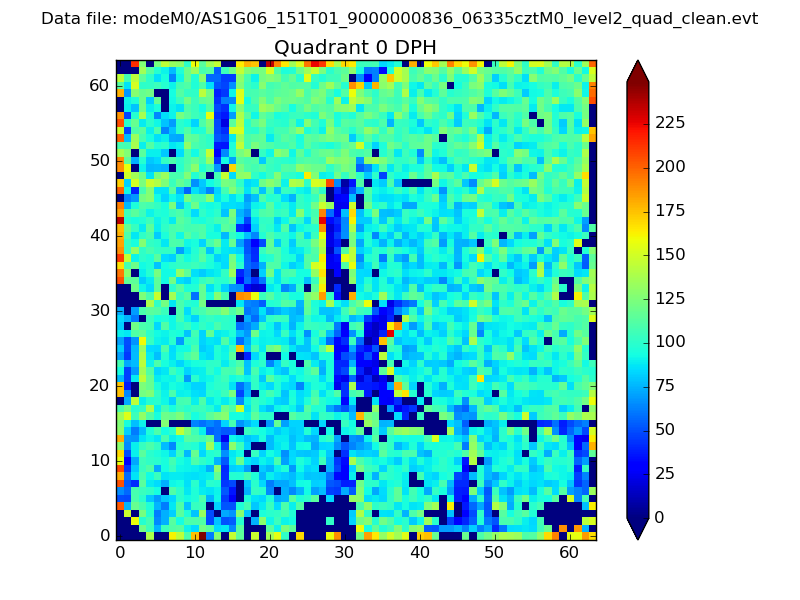 |
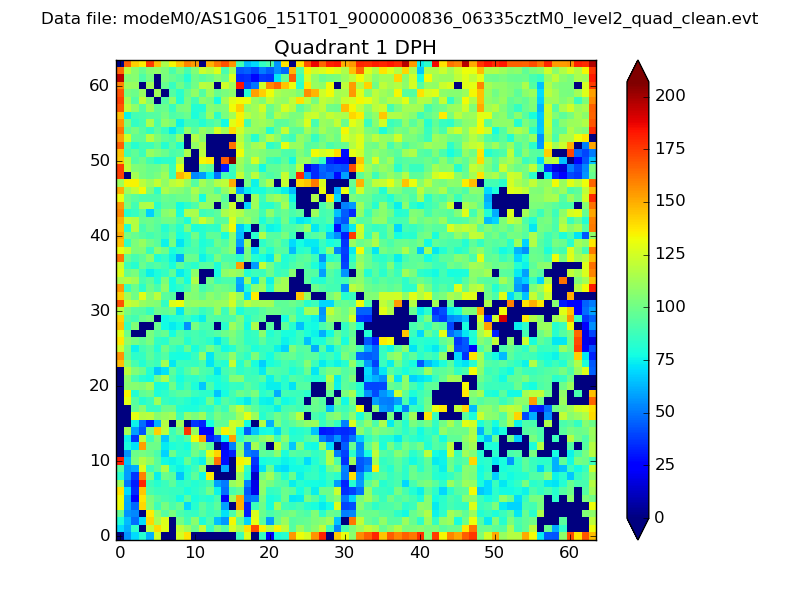 |
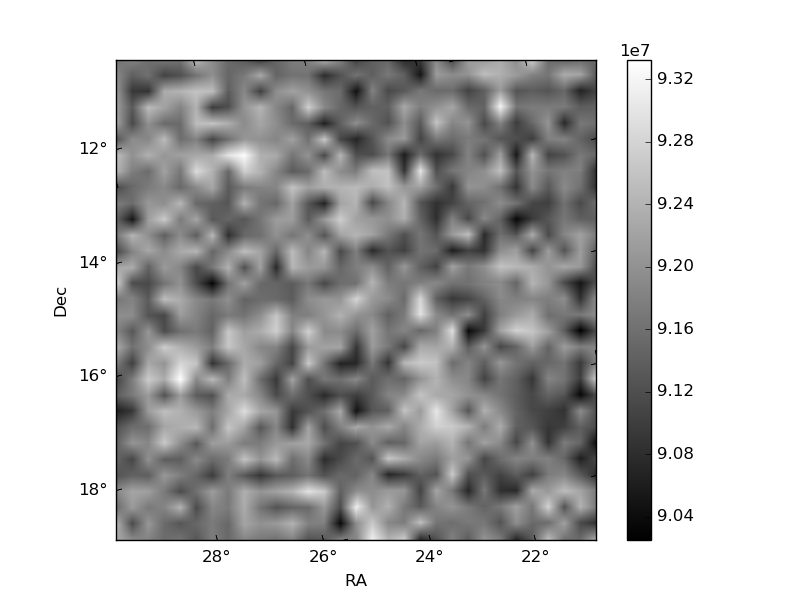
Quadrant B |
|---|---|---|---|
| Quadrant D | 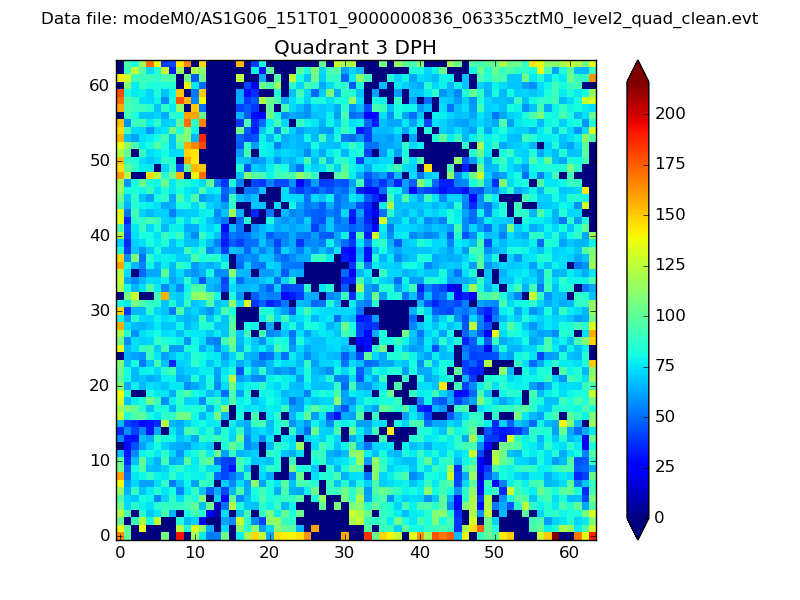 |
 |
Quadrant C |
| Plot type | Count rate plots | Images |
|---|---|---|
| Comparison with Poisson distribution Blue bars denote a histogram of data divided into 1 sec bins. Red curve is a Poisson curve with rate = median count rate of data. |
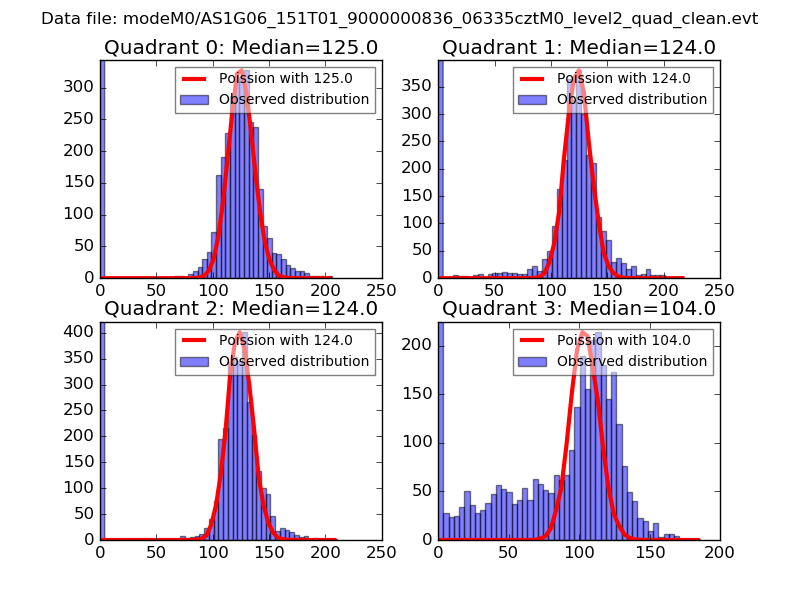 |
 |
| Quadrant-wise count rates Data is divided into 100 sec bins |
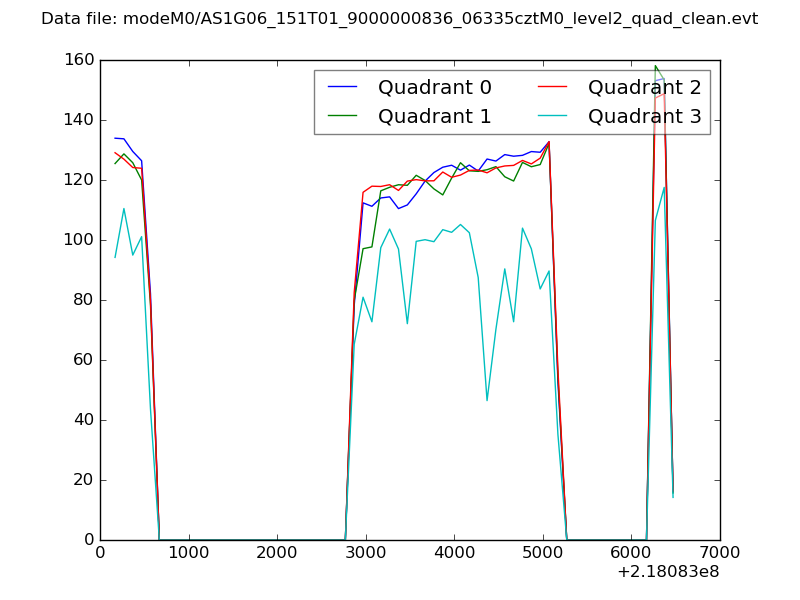 |
|
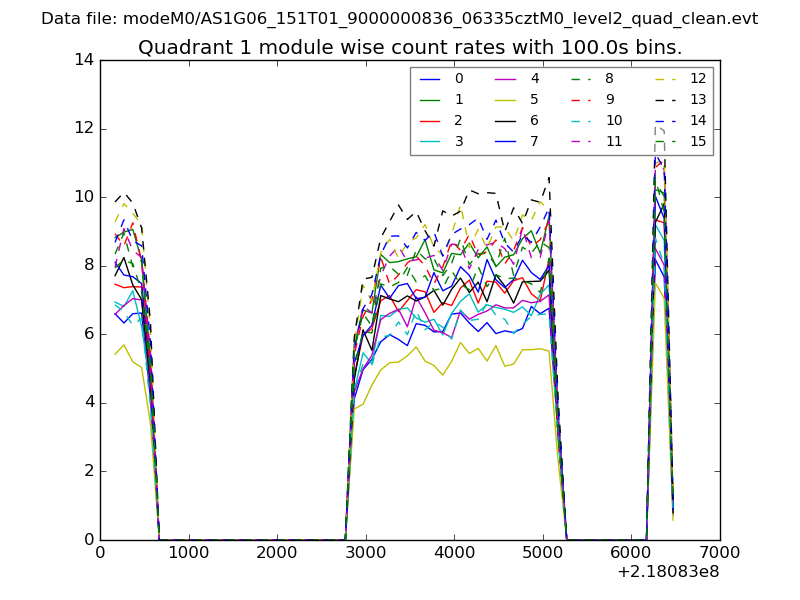
| Module-wise count rates for Quadrant A Data is divided into 100 sec bins |
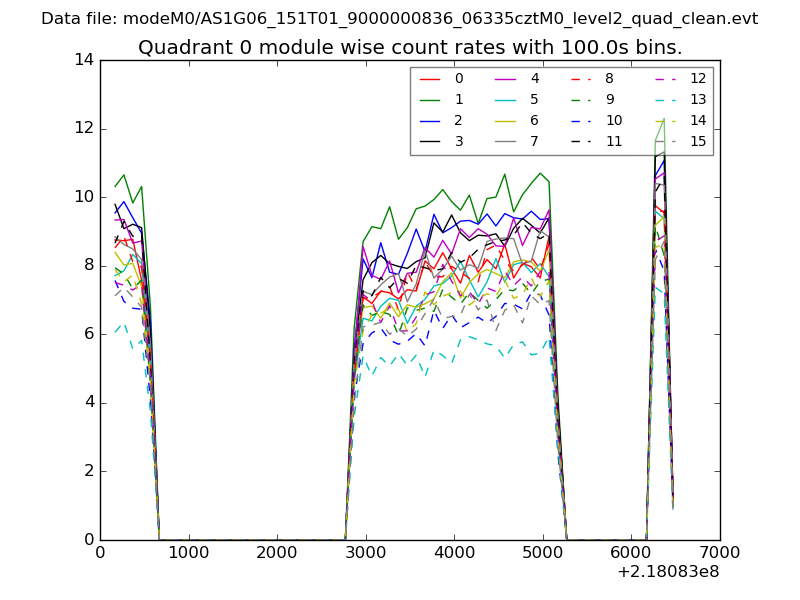 |
 |
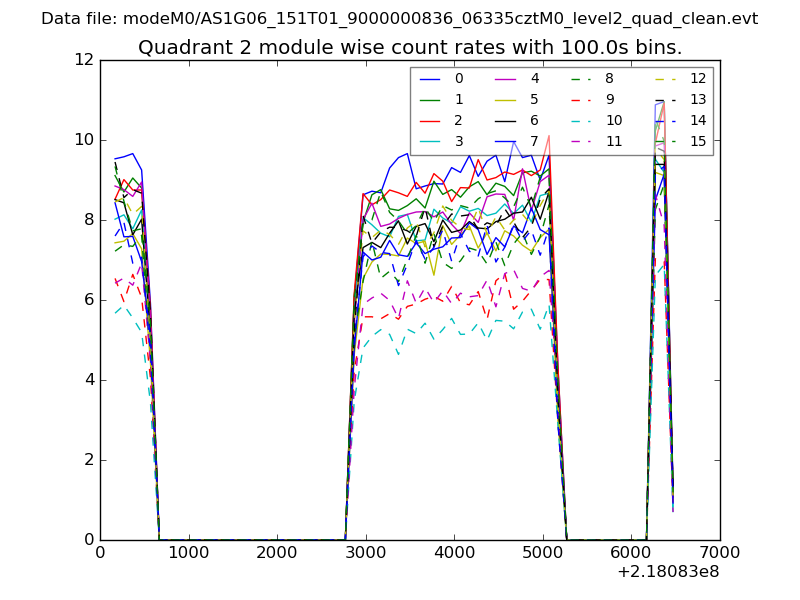
| Module-wise count rates for Quadrant B Data is divided into 100 sec bins |
 |
 |
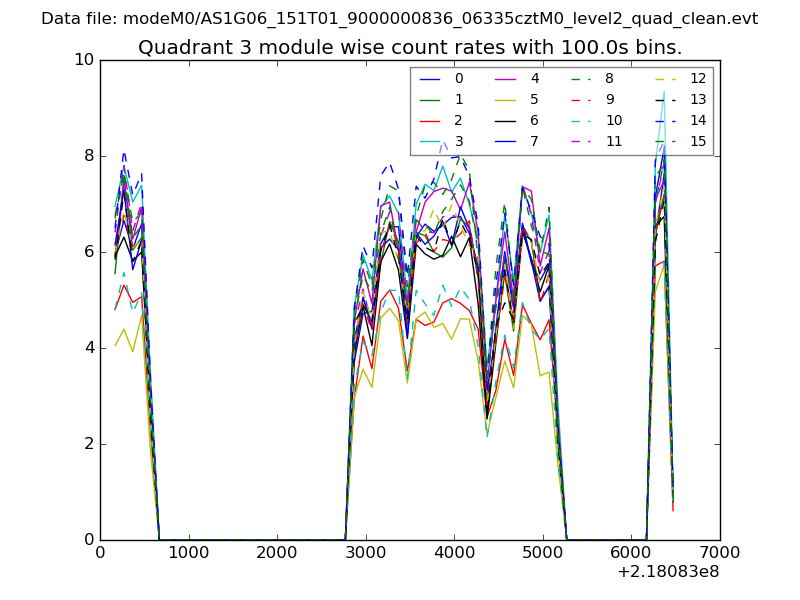
| Module-wise count rates for Quadrant C Data is divided into 100 sec bins |
 |
 |
| Module-wise count rates for Quadrant D Data is divided into 100 sec bins |
 |
 |
| Parameter | Plot |
|---|---|
| CZT HV Monitor | 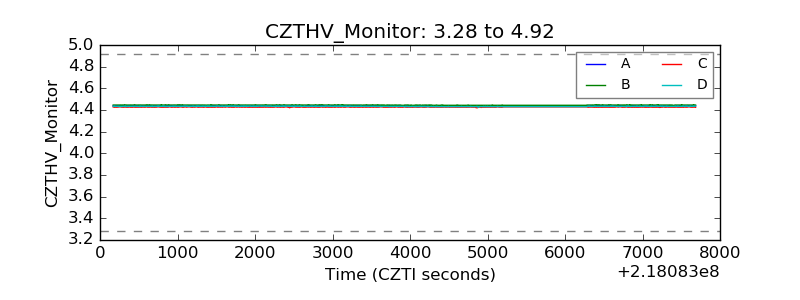 |
| D_VDD | 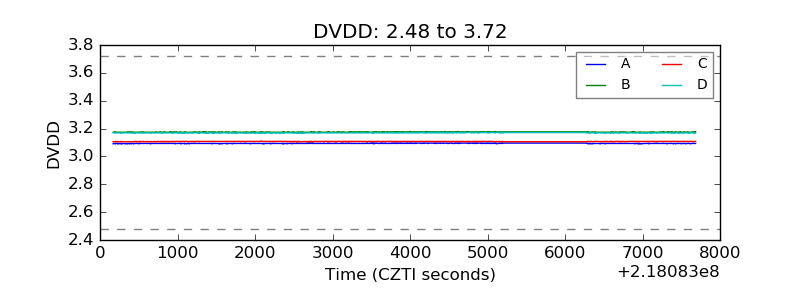 |
| Temperature 1 | 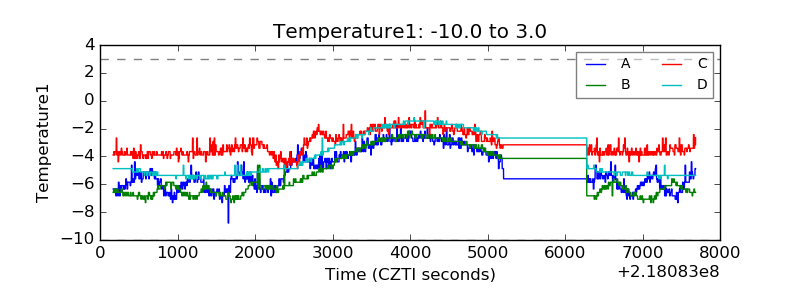 |
| Veto HV Monitor | 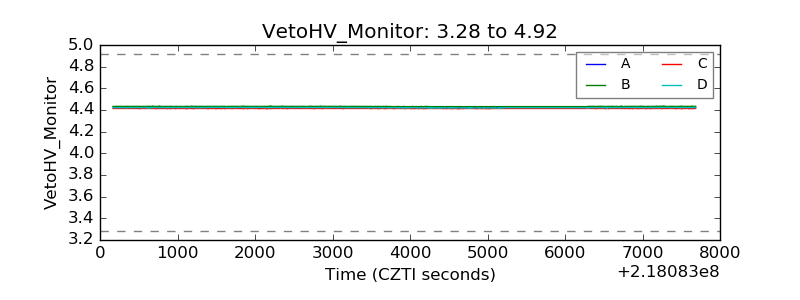 |
| Veto LLD | 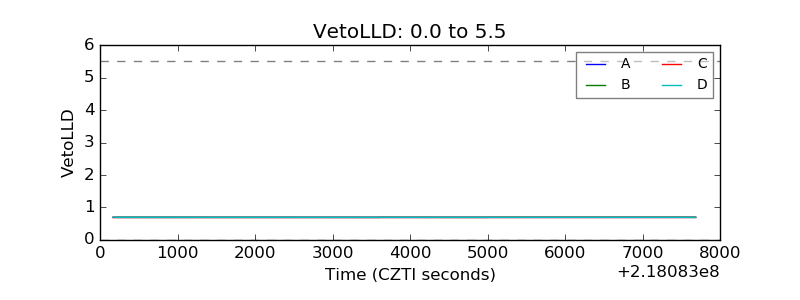 |
| Alpha Counter | 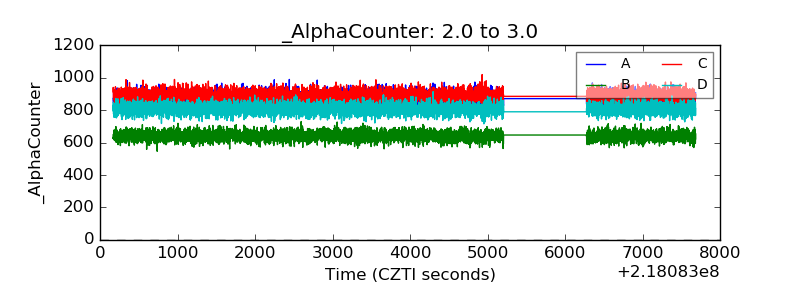 |
| _CPM_Rate | 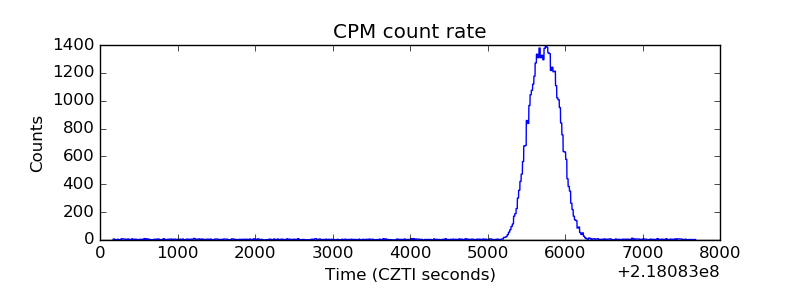 |
| CZT Counter | 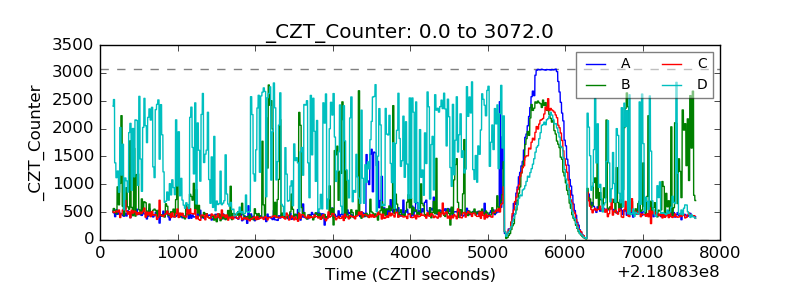 |
| +2.5 Volts monitor | 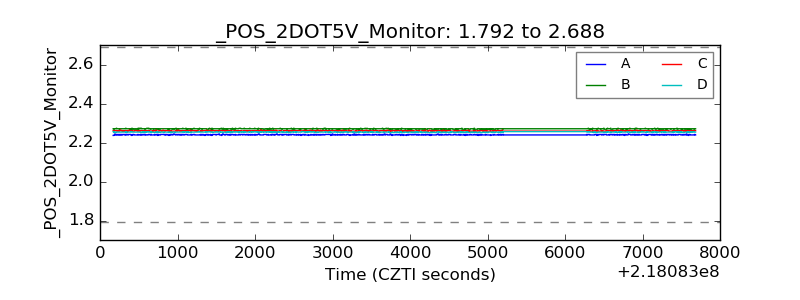 |
| +5 Volts monitor | 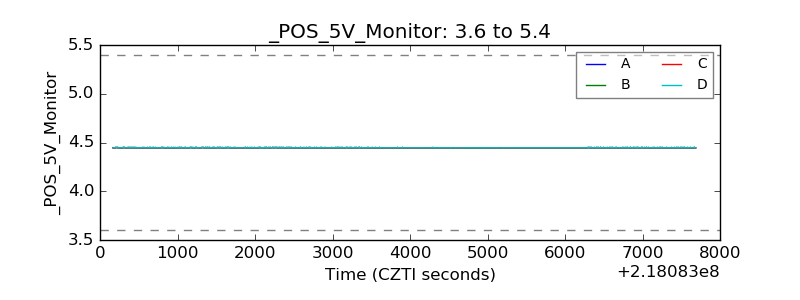 |
| _ROLL_ROT | 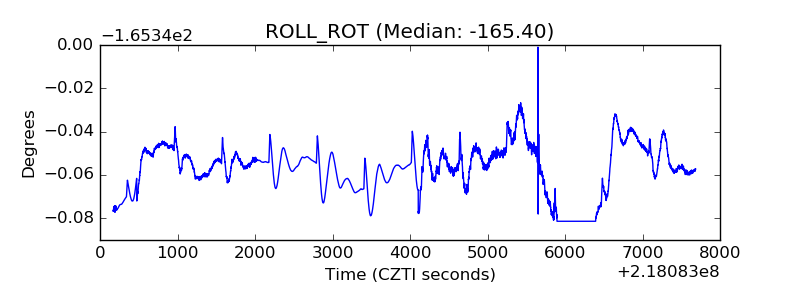 |
| _Roll_DEC | 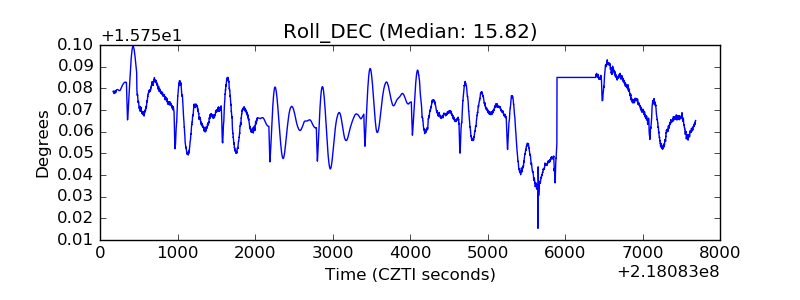 |
| _Roll_RA | 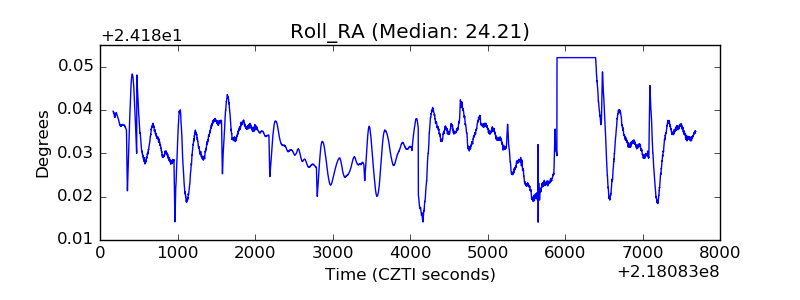 |
| Veto Counter | 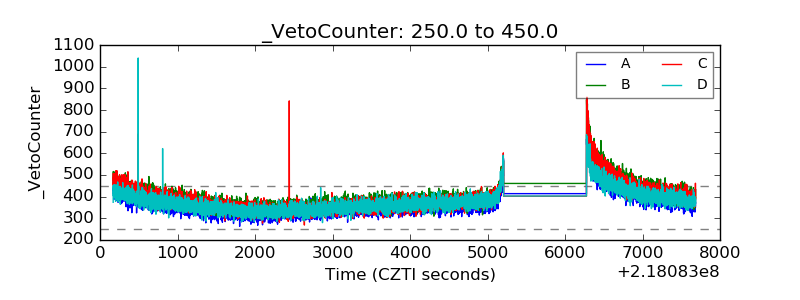 |