| Param | Original file | Final file |
|---|---|---|
| Filename | modeM0/AS1G06_151T01_9000000836_06338cztM0_level2.evt | modeM0/AS1G06_151T01_9000000836_06338cztM0_level2_quad_clean.evt |
| Size (bytes) | 480,257,280 | 63,843,840 |
| Size | 458.0 MB | 60.9 MB |
| Events in quadrant A | 3,301,287 | 377,697 |
| Events in quadrant B | 3,761,843 | 374,328 |
| Events in quadrant C | 3,100,861 | 375,589 |
| Events in quadrant D | 3,950,124 | 362,800 |
| Mode M0 | |||
|---|---|---|---|
| Quadrant | BADHDUFLAG | Total packets | Discarded packets |
| A | 0 | 13630 | 3 |
| B | 0 | 15148 | 2 |
| C | 0 | 13324 | 2 |
| D | 0 | 15767 | 2 |
| Mode M9 | |||
|---|---|---|---|
| Quadrant | BADHDUFLAG | Total packets | Discarded packets |
| A | 0 | 22 | 0 |
| B | 0 | 22 | 0 |
| C | 0 | 22 | 0 |
| D | 0 | 23 | 0 |
| Mode SS | |||
|---|---|---|---|
| Quadrant | BADHDUFLAG | Total packets | Discarded packets |
| A | 0 | 128 | 0 |
| B | 0 | 128 | 0 |
| C | 0 | 128 | 0 |
| D | 0 | 128 | 0 |
| Quadrant | Total seconds | Saturated seconds | Saturation percentage |
|---|---|---|---|
| A | 6343 | 55 | 0.867098% |
| B | 6343 | 200 | 3.153082% |
| C | 6343 | 48 | 0.756740% |
| D | 6343 | 183 | 2.885070% |
Noise dominated data is calculated using 1-second bins in cleaned event files. If a bin has >2000 counts, and if more than 50% of those come from <1% of pixels, then it is considered to be noise-dominated and hence unusable.
| Quadrant | # 1 sec bins | Bins with >0 counts | Bins with >2000 counts | High rate bins dominated by noise | Noise dominated (total time) | Noise dominated (detector-on time) | Marked lightcurve |
|---|---|---|---|---|---|---|---|
| A | 7588 | 6344 | 0 | 0 | 0.00% | 0.00% | 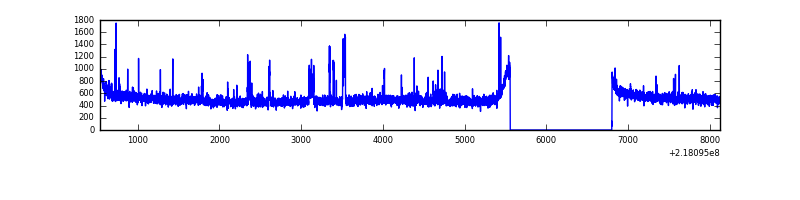 |
| B | 7588 | 6344 | 90 | 90 | 1.19% | 1.42% | 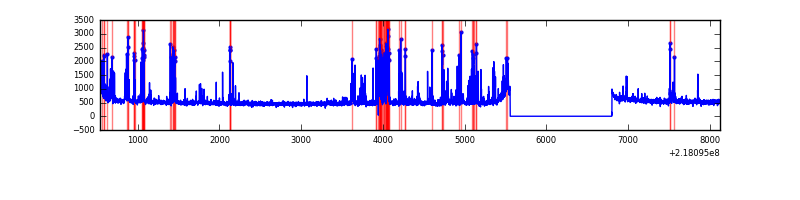 |
| C | 7588 | 6344 | 4 | 4 | 0.05% | 0.06% | 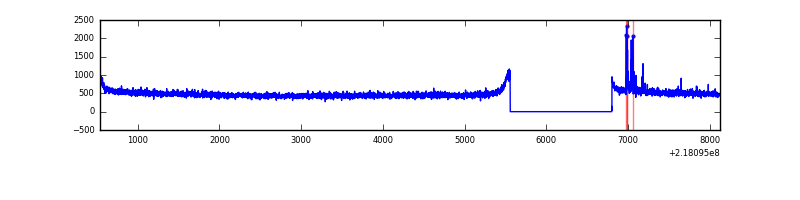 |
| D | 7588 | 6344 | 104 | 104 | 1.37% | 1.64% | 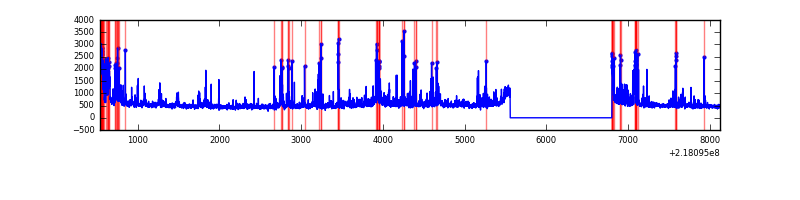 |
Top three noisy pixels from each quadrant. If the there are fewer than three noisy pixels in the level2.evt file, extra rows are filled as -1
| Pixel properties | Quadrant properties | ||||||
|---|---|---|---|---|---|---|---|
| Quadrant | DetID | PixID | Counts | Sigma | Mean | Median | Sigma |
| A | 14 | 111 | 96862 | 589.12 | 807 | 792 | 163.1 |
| A | 15 | 236 | 43405 | 261.31 | 807 | 792 | 163.1 |
| A | 13 | 251 | 24489 | 145.31 | 807 | 792 | 163.1 |
| B | 3 | 64 | 590675 | 3832.82 | 807 | 791 | 153.9 |
| B | 12 | 111 | 15296 | 94.25 | 807 | 791 | 153.9 |
| B | 15 | 204 | 15076 | 92.82 | 807 | 791 | 153.9 |
| C | 4 | 254 | 50958 | 280.62 | 778 | 782 | 178.8 |
| C | 13 | 61 | 6143 | 29.98 | 778 | 782 | 178.8 |
| C | 5 | 237 | 5906 | 28.66 | 778 | 782 | 178.8 |
| D | 12 | 220 | 370859 | 1956.61 | 770 | 747 | 189.2 |
| D | 12 | 221 | 182926 | 963.1 | 770 | 747 | 189.2 |
| D | 13 | 46 | 135219 | 710.89 | 770 | 747 | 189.2 |
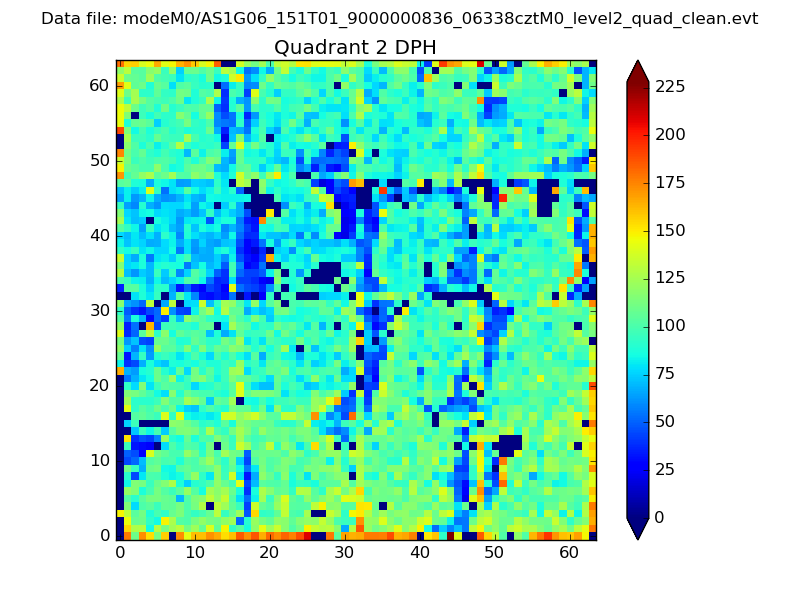
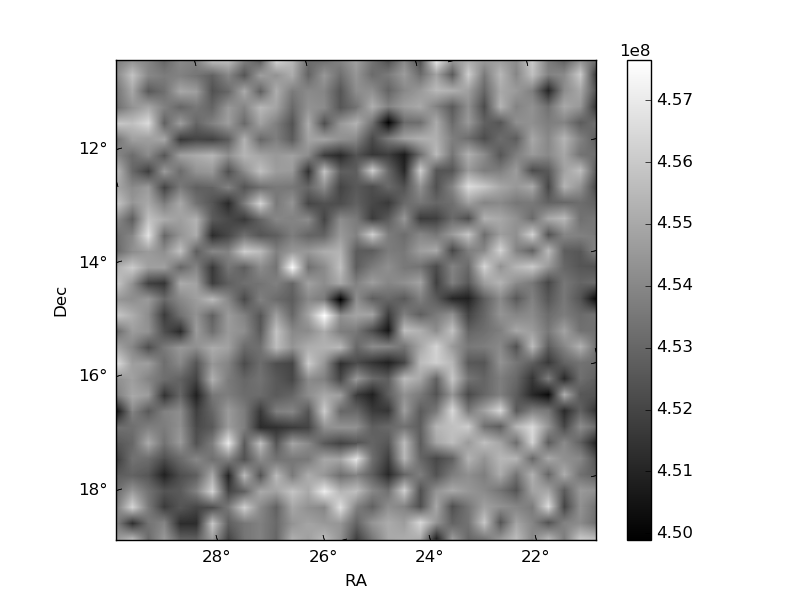
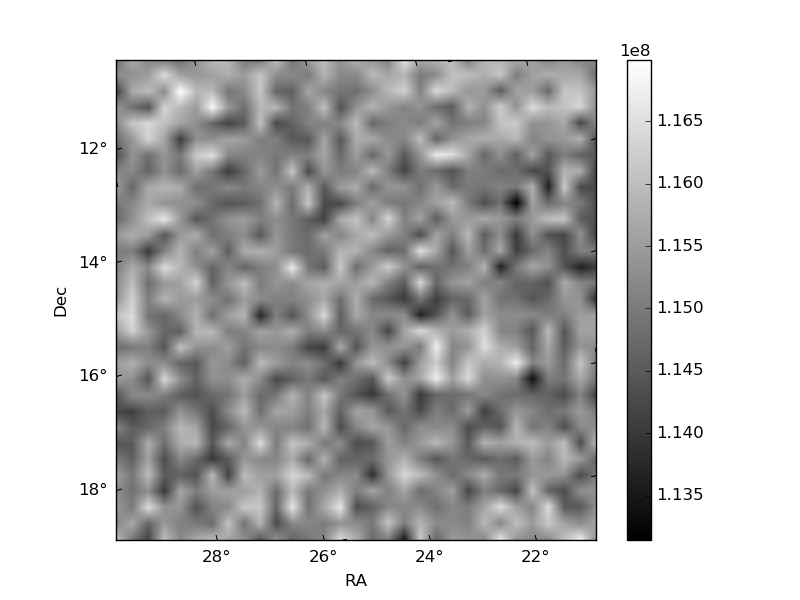
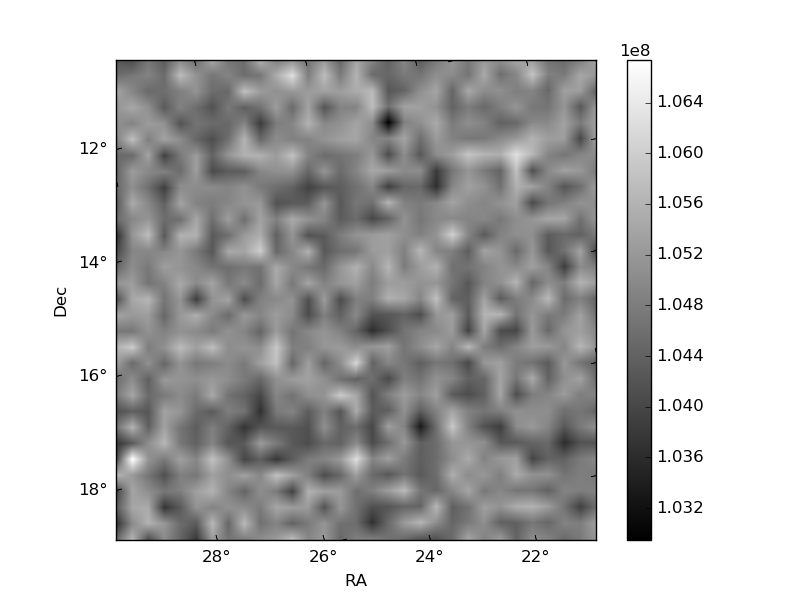
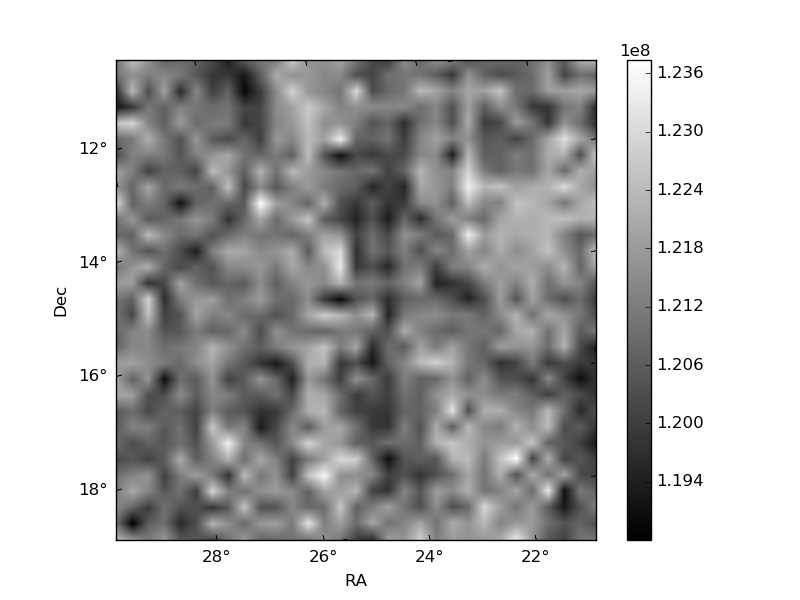
Histogram calculated using DETX and DETY for each event in the final _common_clean file
| Quadrant A | 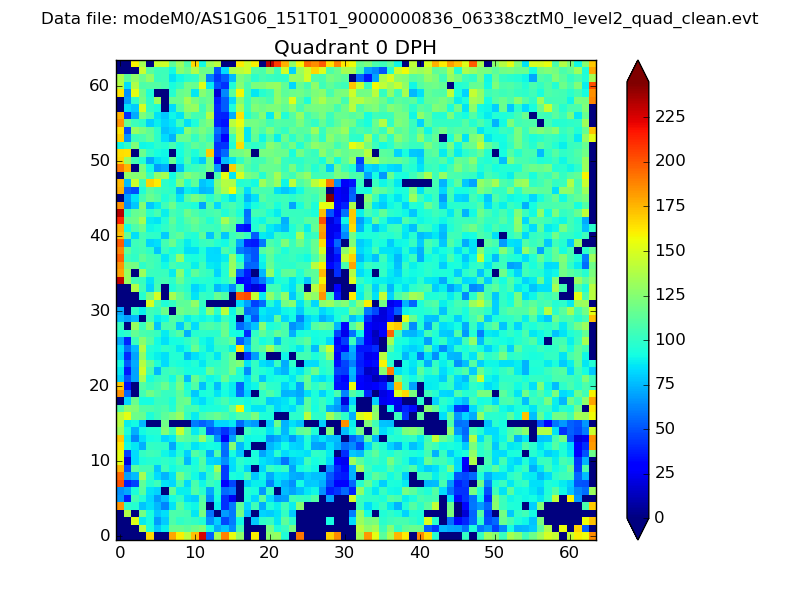 |
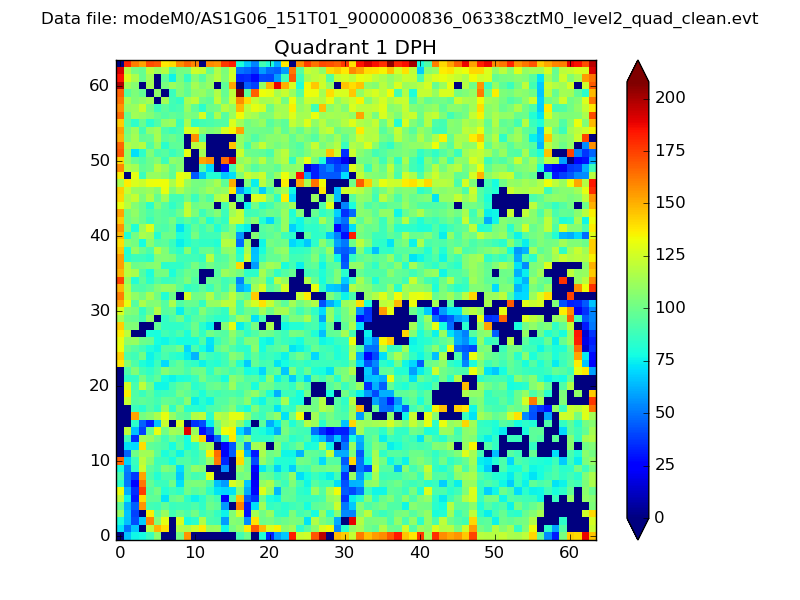 |
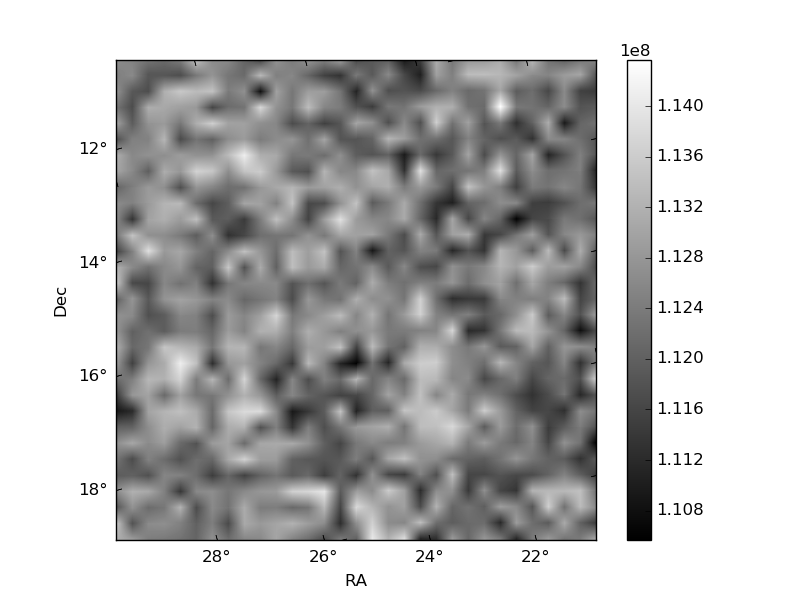
Quadrant B |
|---|---|---|---|
| Quadrant D | 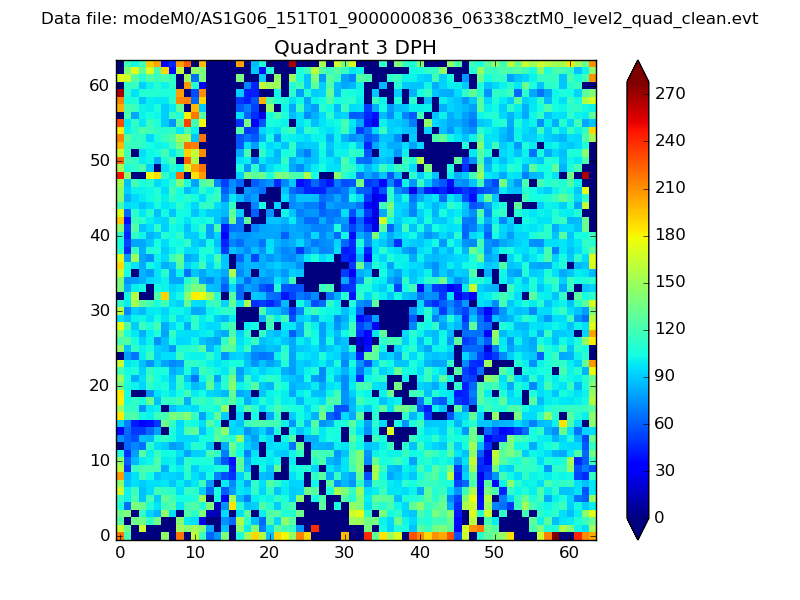 |
 |
Quadrant C |
| Plot type | Count rate plots | Images |
|---|---|---|
| Comparison with Poisson distribution Blue bars denote a histogram of data divided into 1 sec bins. Red curve is a Poisson curve with rate = median count rate of data. |
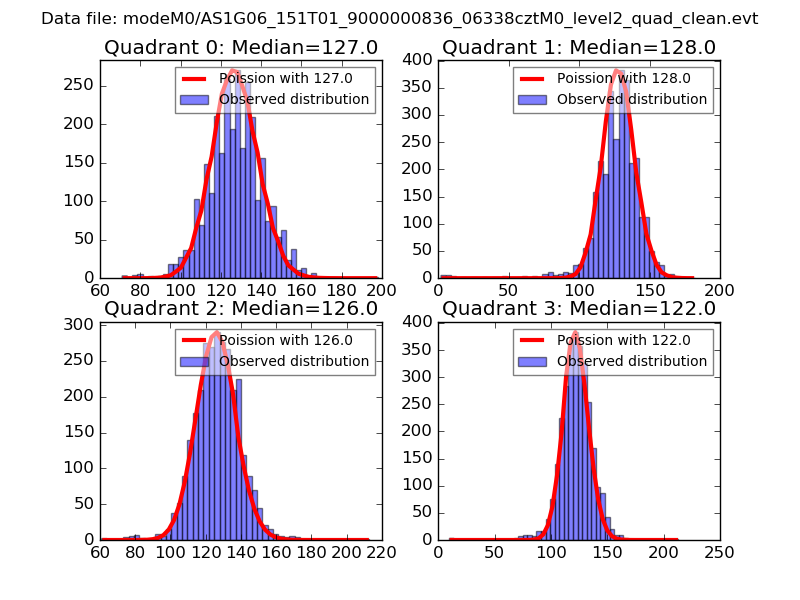 |
 |
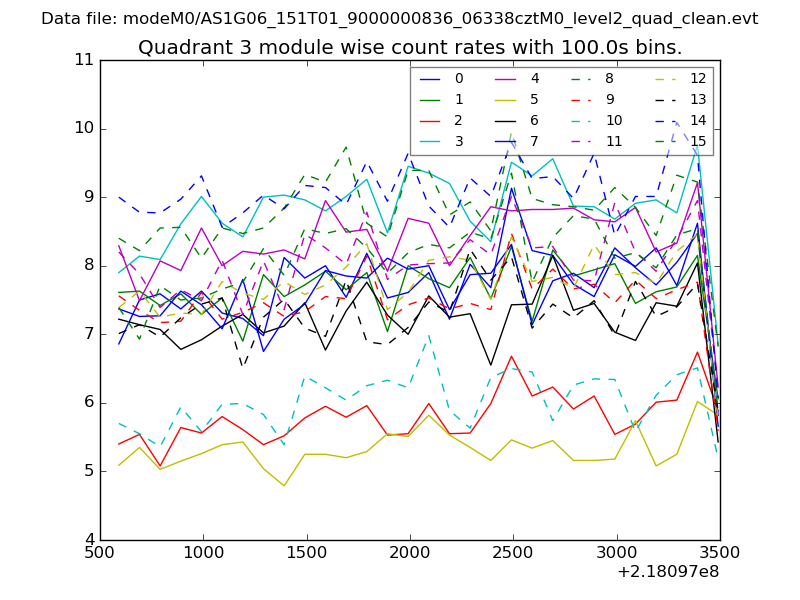
| Quadrant-wise count rates Data is divided into 100 sec bins |
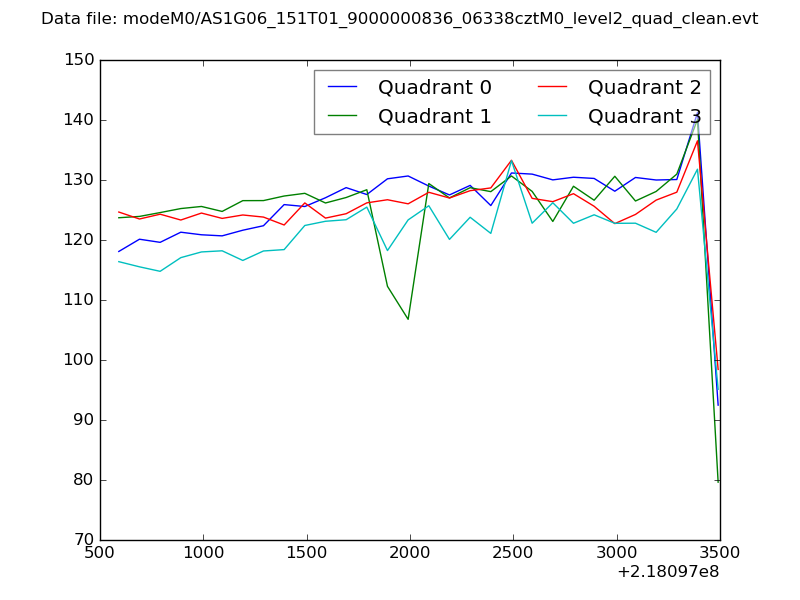 |
|
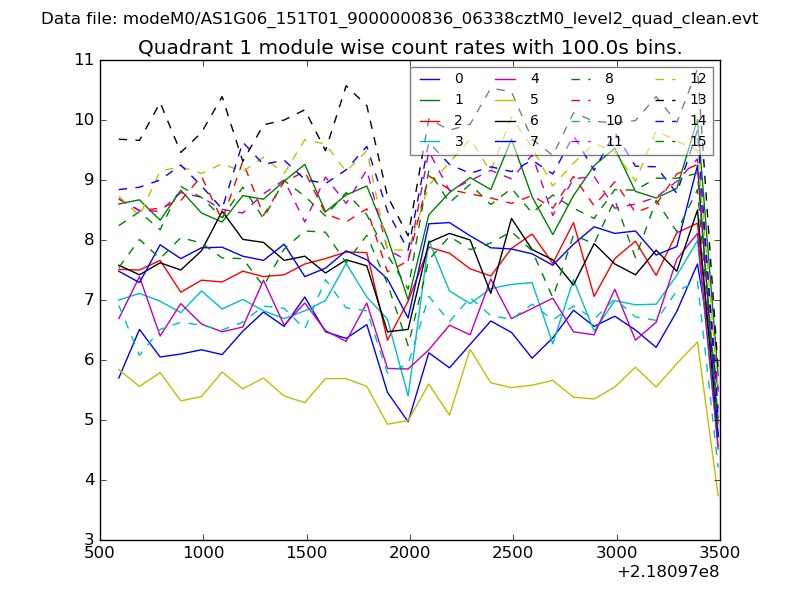
| Module-wise count rates for Quadrant A Data is divided into 100 sec bins |
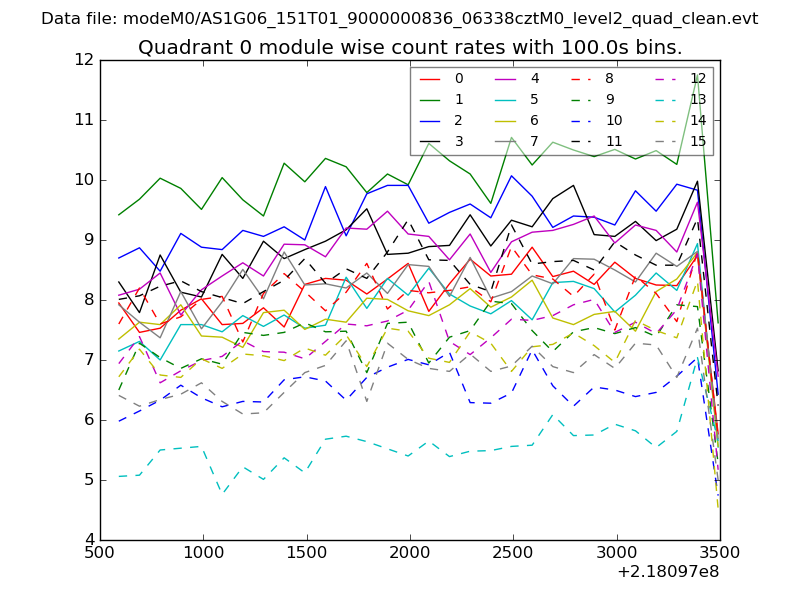 |
 |
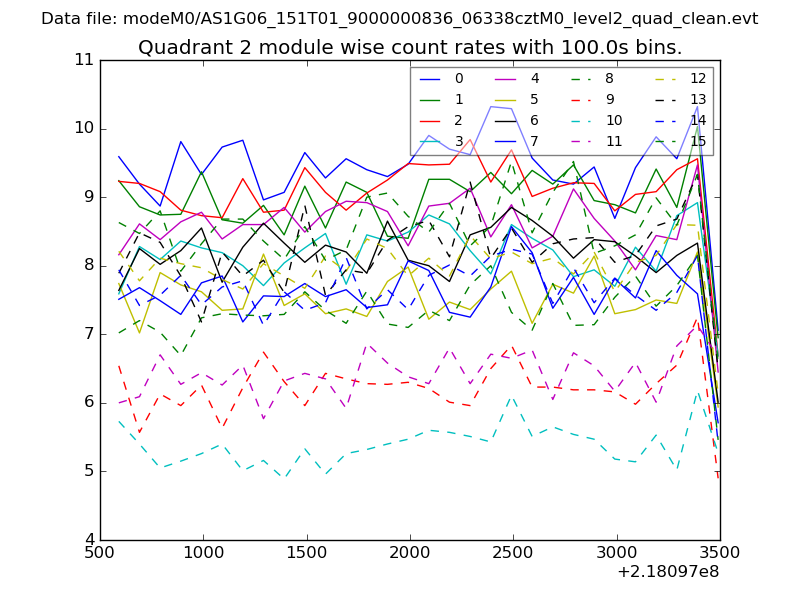
| Module-wise count rates for Quadrant B Data is divided into 100 sec bins |
 |
 |
| Module-wise count rates for Quadrant C Data is divided into 100 sec bins |
 |
 |
| Module-wise count rates for Quadrant D Data is divided into 100 sec bins |
 |
 |
| Parameter | Plot |
|---|---|
| CZT HV Monitor | 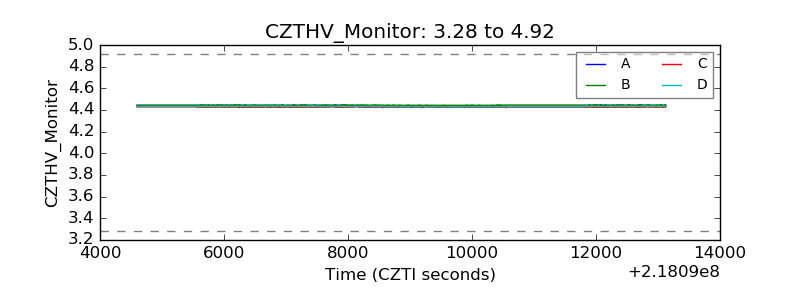 |
| D_VDD | 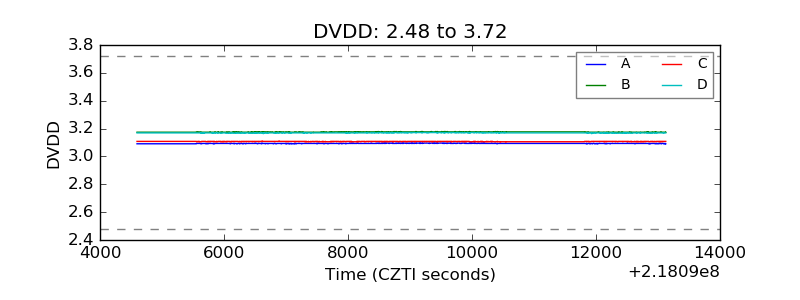 |
| Temperature 1 | 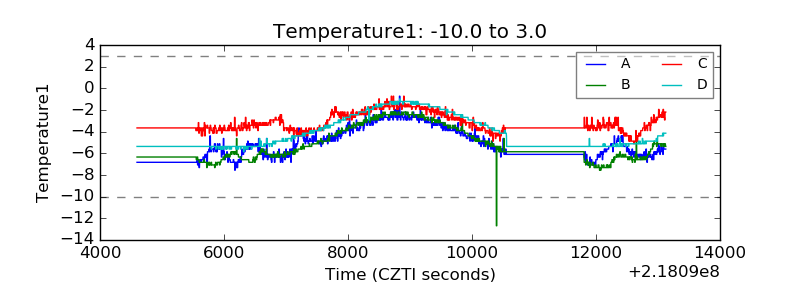 |
| Veto HV Monitor | 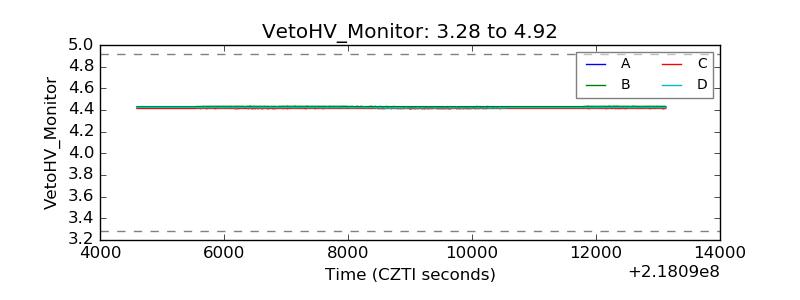 |
| Veto LLD | 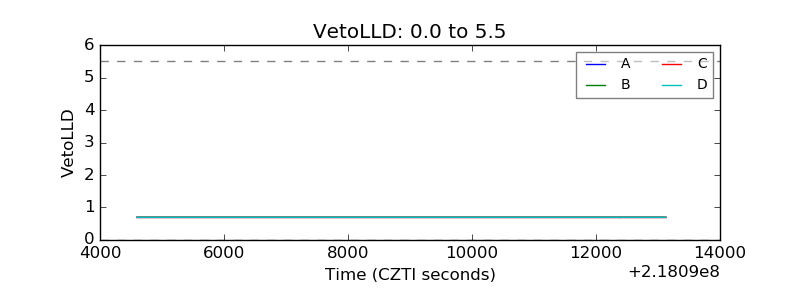 |
| Alpha Counter | 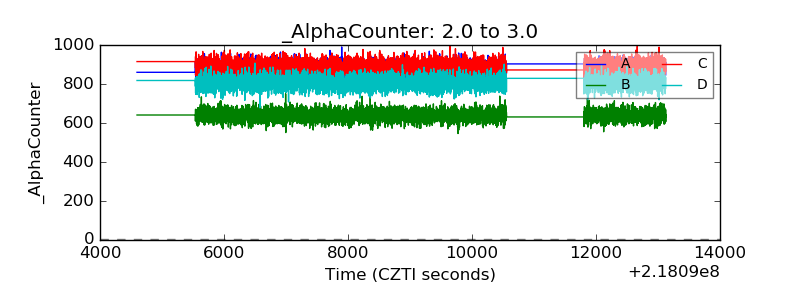 |
| _CPM_Rate | 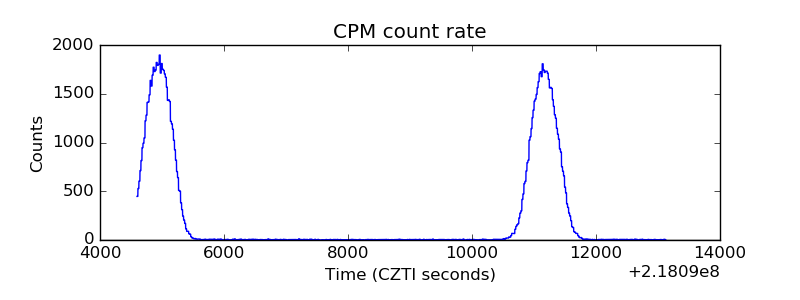 |
| CZT Counter | 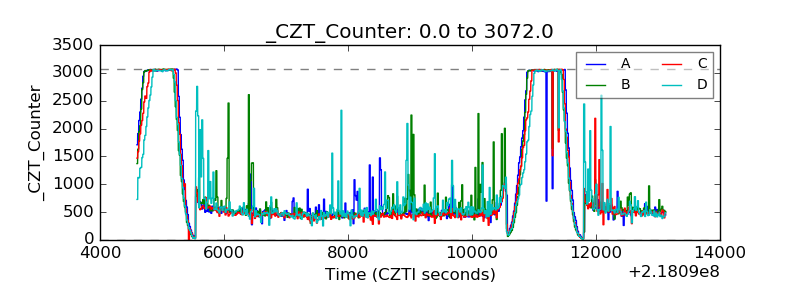 |
| +2.5 Volts monitor |  |
| +5 Volts monitor |  |
| _ROLL_ROT | 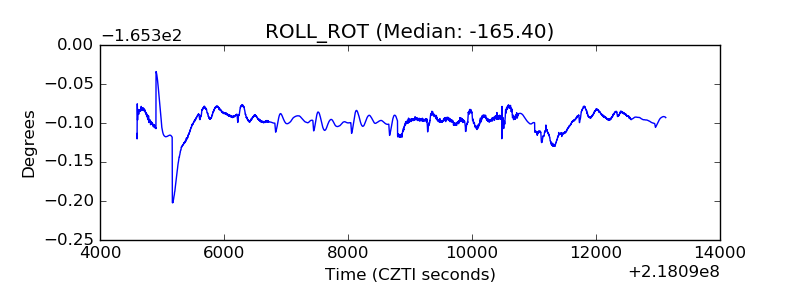 |
| _Roll_DEC | 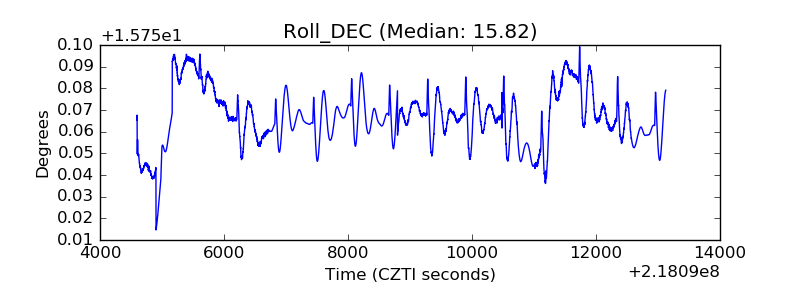 |
| _Roll_RA | 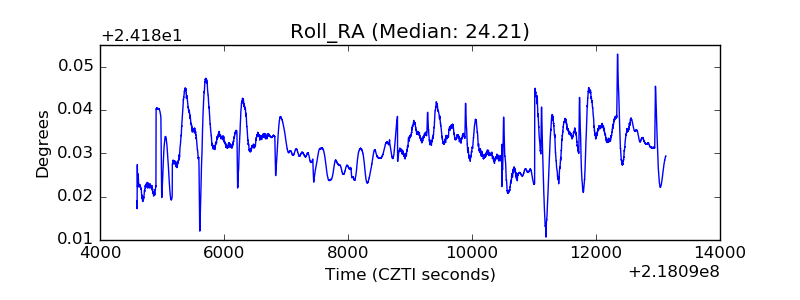 |
| Veto Counter | 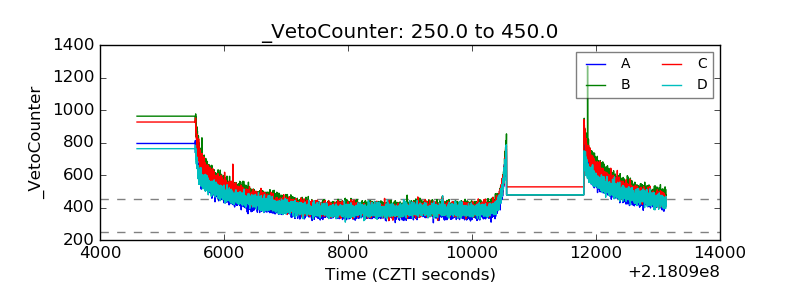 |