| Param | Original file | Final file |
|---|---|---|
| Filename | modeM0/AS1G06_151T01_9000000836_06339cztM0_level2.evt | modeM0/AS1G06_151T01_9000000836_06339cztM0_level2_quad_clean.evt |
| Size (bytes) | 473,944,320 | 73,192,320 |
| Size | 452.0 MB | 69.8 MB |
| Events in quadrant A | 3,378,151 | 450,462 |
| Events in quadrant B | 3,456,115 | 453,764 |
| Events in quadrant C | 3,152,924 | 444,737 |
| Events in quadrant D | 3,938,052 | 427,059 |
| Mode M0 | |||
|---|---|---|---|
| Quadrant | BADHDUFLAG | Total packets | Discarded packets |
| A | 0 | 13713 | 3 |
| B | 0 | 14135 | 2 |
| C | 0 | 13377 | 2 |
| D | 0 | 15700 | 2 |
| Mode M9 | |||
|---|---|---|---|
| Quadrant | BADHDUFLAG | Total packets | Discarded packets |
| A | 0 | 19 | 0 |
| B | 0 | 19 | 0 |
| C | 0 | 19 | 0 |
| D | 0 | 20 | 0 |
| Mode SS | |||
|---|---|---|---|
| Quadrant | BADHDUFLAG | Total packets | Discarded packets |
| A | 0 | 126 | 0 |
| B | 0 | 126 | 0 |
| C | 0 | 126 | 0 |
| D | 0 | 126 | 0 |
| Quadrant | Total seconds | Saturated seconds | Saturation percentage |
|---|---|---|---|
| A | 6316 | 87 | 1.377454% |
| B | 6316 | 114 | 1.804940% |
| C | 6316 | 66 | 1.044965% |
| D | 6316 | 166 | 2.628246% |
Noise dominated data is calculated using 1-second bins in cleaned event files. If a bin has >2000 counts, and if more than 50% of those come from <1% of pixels, then it is considered to be noise-dominated and hence unusable.
| Quadrant | # 1 sec bins | Bins with >0 counts | Bins with >2000 counts | High rate bins dominated by noise | Noise dominated (total time) | Noise dominated (detector-on time) | Marked lightcurve |
|---|---|---|---|---|---|---|---|
| A | 7581 | 6317 | 6 | 6 | 0.08% | 0.09% | 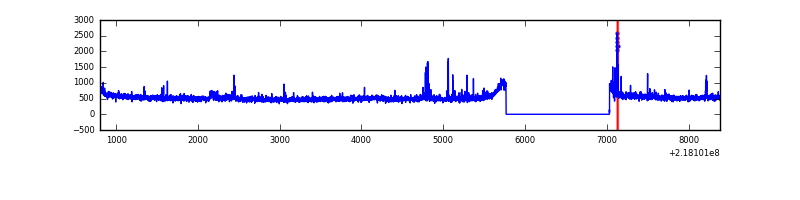 |
| B | 7581 | 6317 | 27 | 27 | 0.36% | 0.43% | 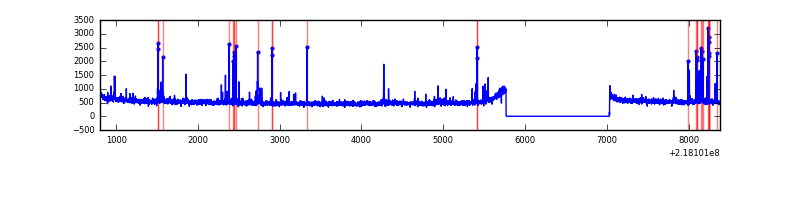 |
| C | 7581 | 6317 | 7 | 7 | 0.09% | 0.11% | 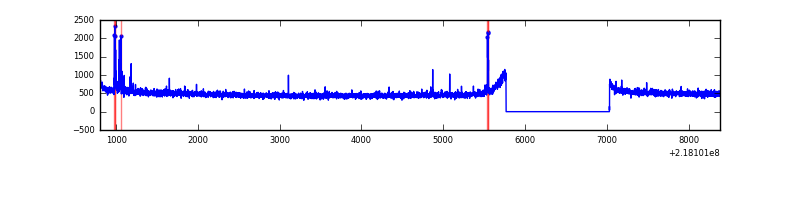 |
| D | 7581 | 6317 | 72 | 72 | 0.95% | 1.14% | 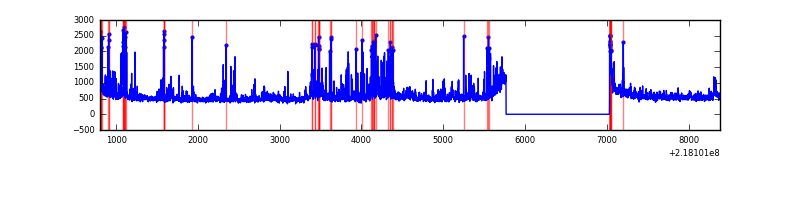 |
Top three noisy pixels from each quadrant. If the there are fewer than three noisy pixels in the level2.evt file, extra rows are filled as -1
| Pixel properties | Quadrant properties | ||||||
|---|---|---|---|---|---|---|---|
| Quadrant | DetID | PixID | Counts | Sigma | Mean | Median | Sigma |
| A | 13 | 251 | 99222 | 594.25 | 819 | 806 | 165.6 |
| A | 15 | 236 | 95123 | 569.5 | 819 | 806 | 165.6 |
| A | 8 | 15 | 13244 | 75.1 | 819 | 806 | 165.6 |
| B | 3 | 64 | 174032 | 1110.36 | 824 | 805 | 156.0 |
| B | 4 | 172 | 37697 | 236.47 | 824 | 805 | 156.0 |
| B | 15 | 204 | 21657 | 133.66 | 824 | 805 | 156.0 |
| C | 4 | 254 | 70195 | 381.42 | 786 | 792 | 182.0 |
| C | 14 | 67 | 10857 | 55.31 | 786 | 792 | 182.0 |
| C | 13 | 61 | 6261 | 30.06 | 786 | 792 | 182.0 |
| D | 12 | 220 | 335472 | 1754.67 | 782 | 760 | 190.8 |
| D | 12 | 221 | 243031 | 1270.07 | 782 | 760 | 190.8 |
| D | 4 | 95 | 146432 | 763.66 | 782 | 760 | 190.8 |
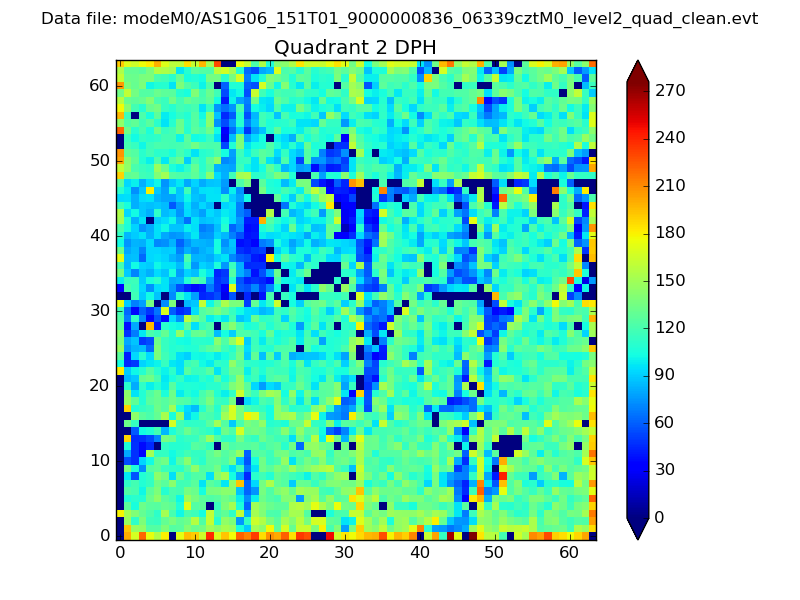
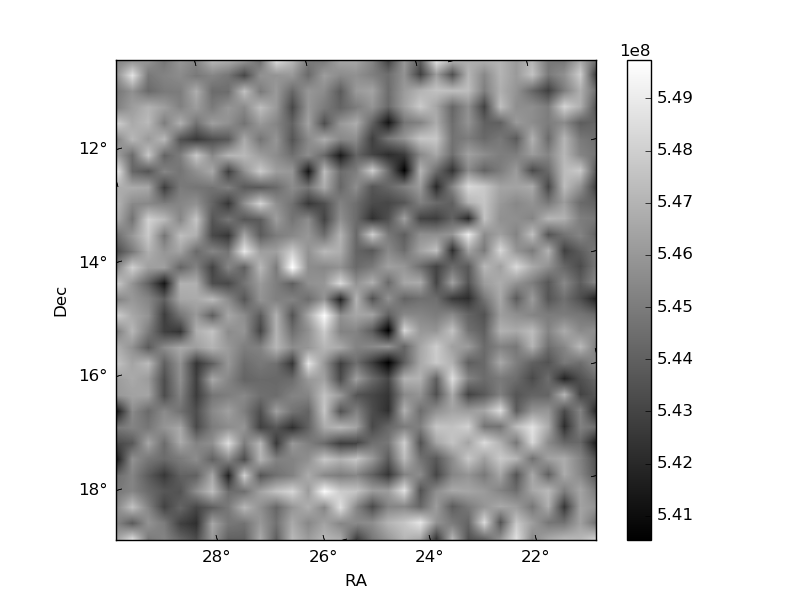
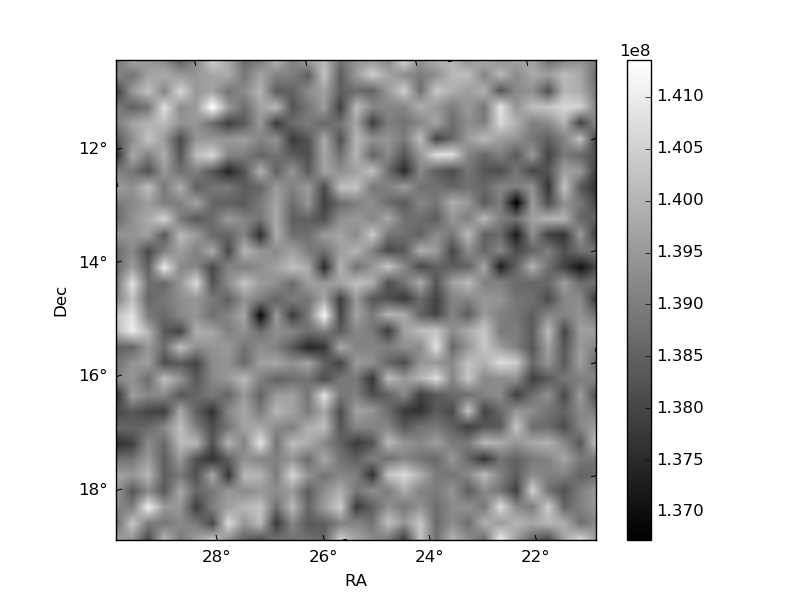
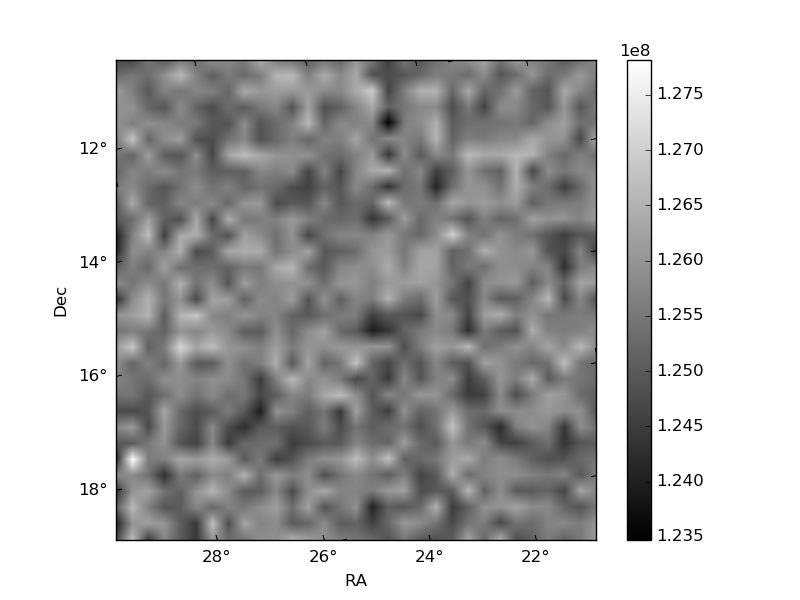
Histogram calculated using DETX and DETY for each event in the final _common_clean file
| Quadrant A | 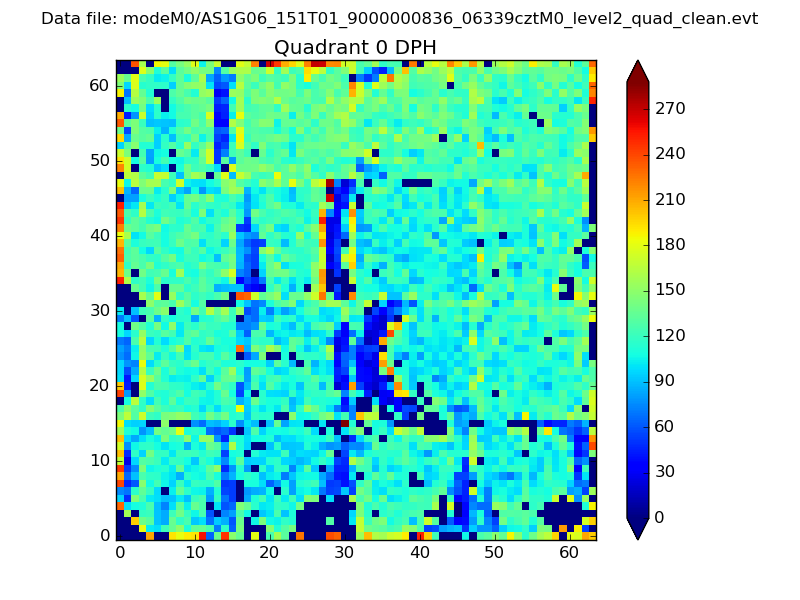 |
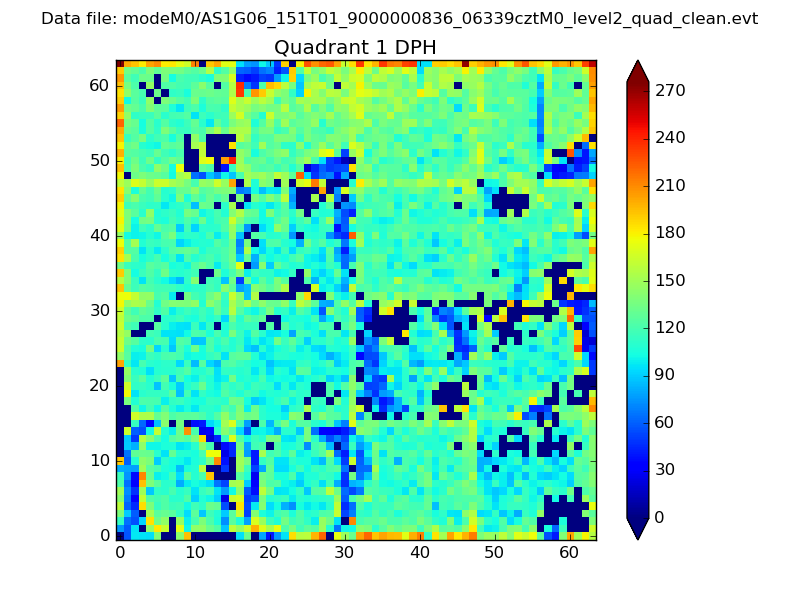 |
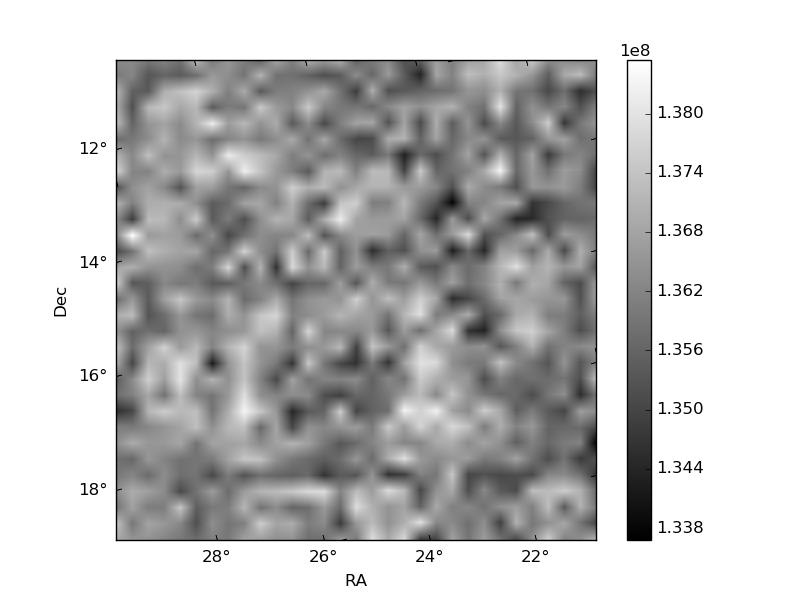
Quadrant B |
|---|---|---|---|
| Quadrant D | 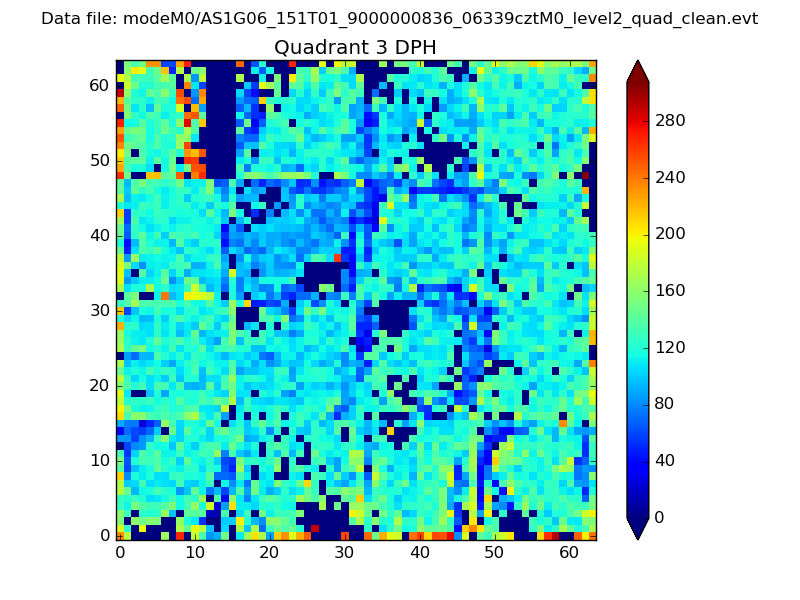 |
 |
Quadrant C |
| Plot type | Count rate plots | Images |
|---|---|---|
| Comparison with Poisson distribution Blue bars denote a histogram of data divided into 1 sec bins. Red curve is a Poisson curve with rate = median count rate of data. |
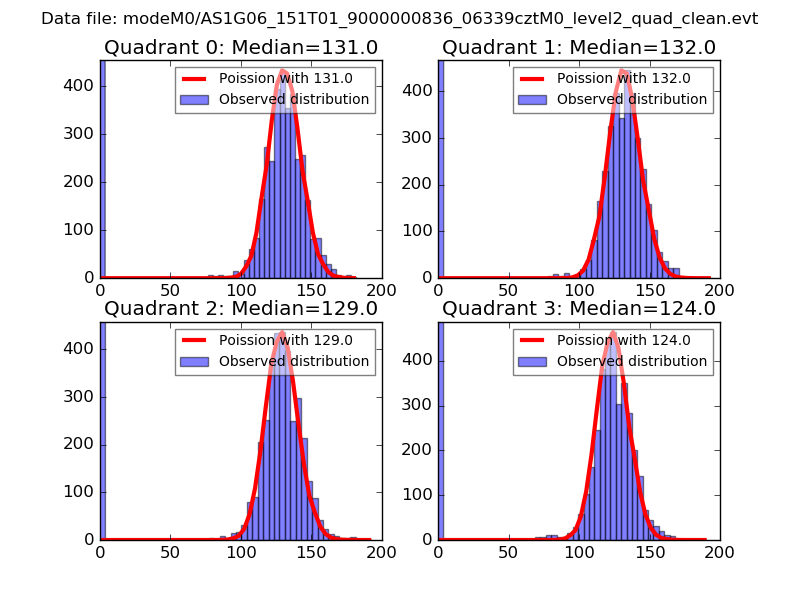 |
 |
| Quadrant-wise count rates Data is divided into 100 sec bins |
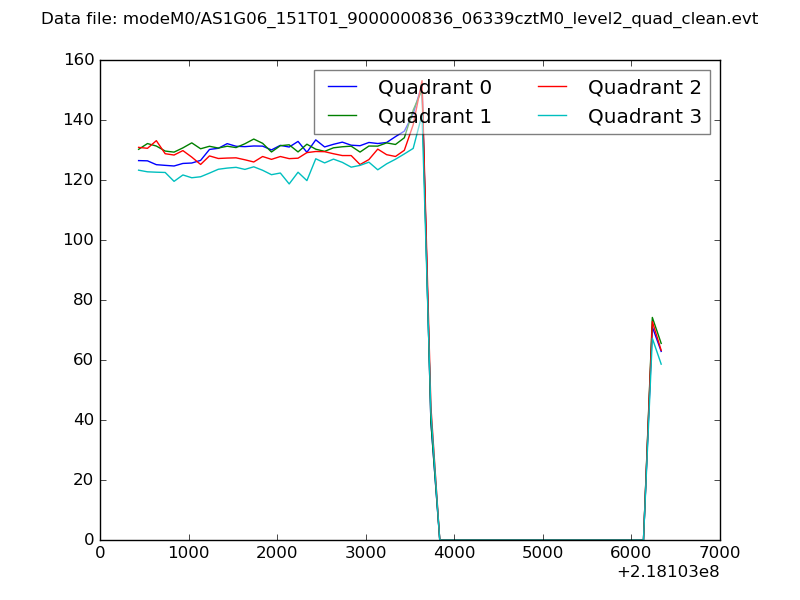 |
|
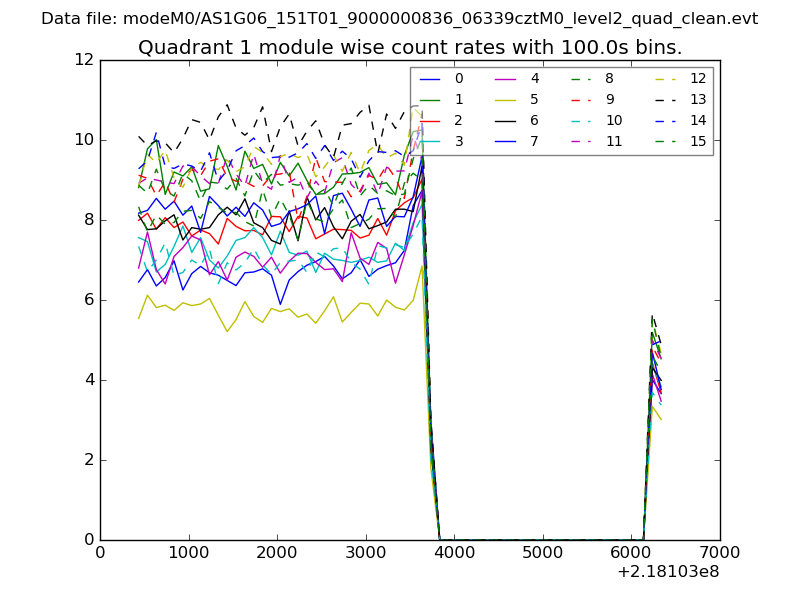
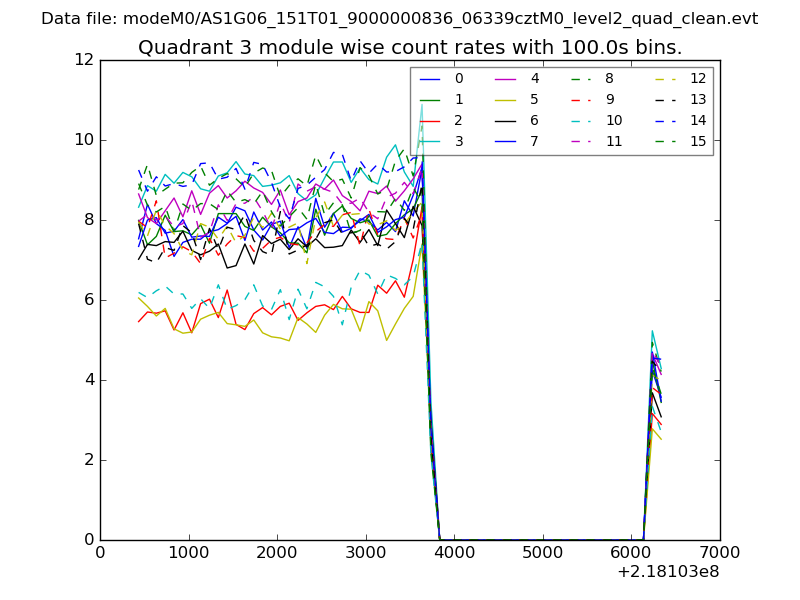
| Module-wise count rates for Quadrant A Data is divided into 100 sec bins |
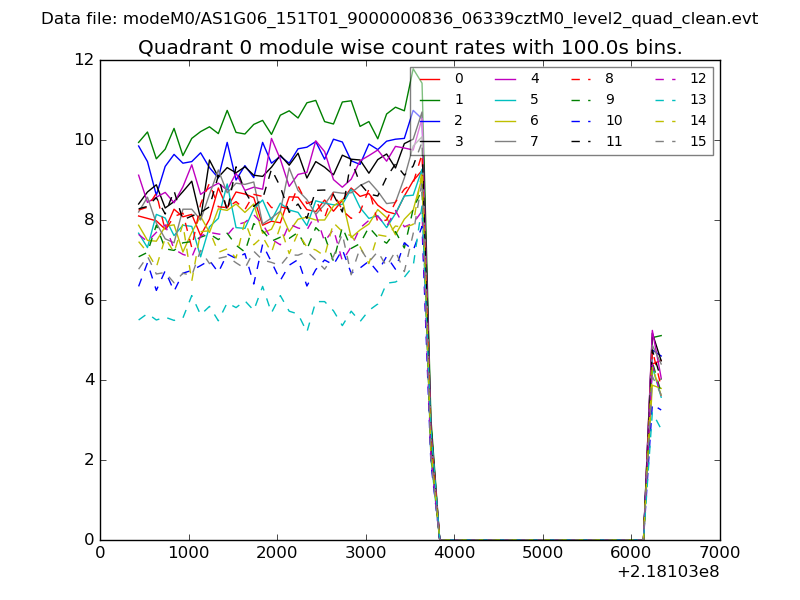 |
 |
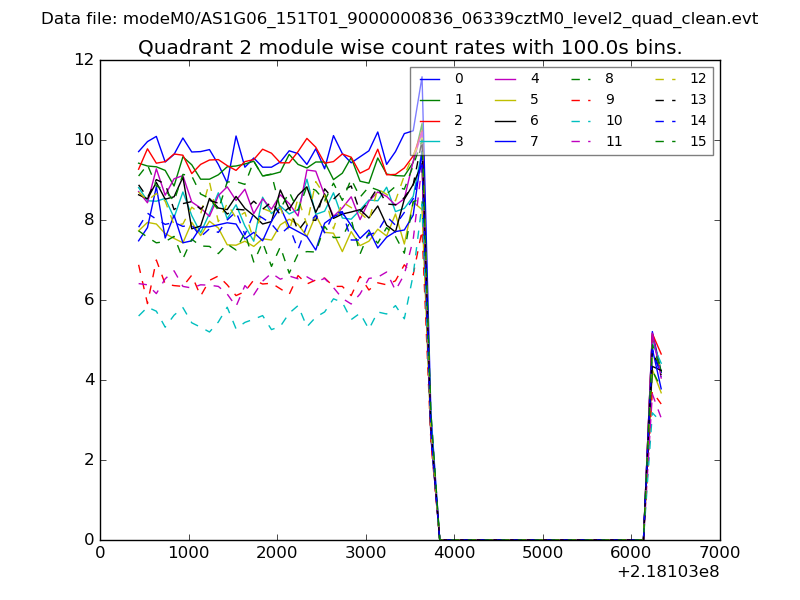
| Module-wise count rates for Quadrant B Data is divided into 100 sec bins |
 |
 |
| Module-wise count rates for Quadrant C Data is divided into 100 sec bins |
 |
 |
| Module-wise count rates for Quadrant D Data is divided into 100 sec bins |
 |
 |
| Parameter | Plot |
|---|---|
| CZT HV Monitor | 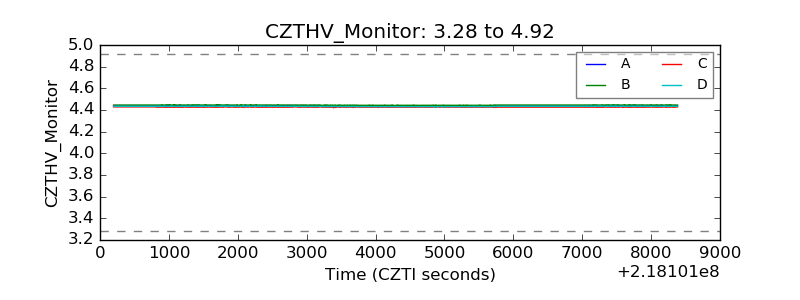 |
| D_VDD | 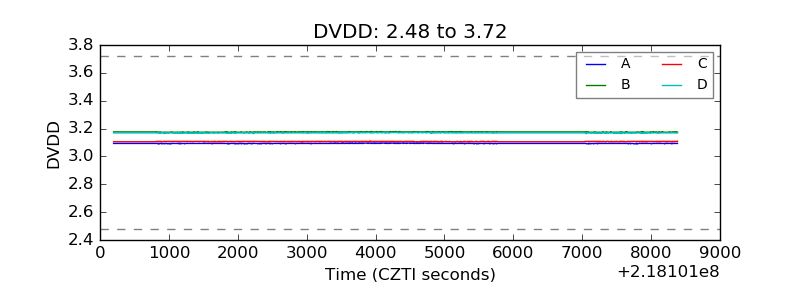 |
| Temperature 1 | 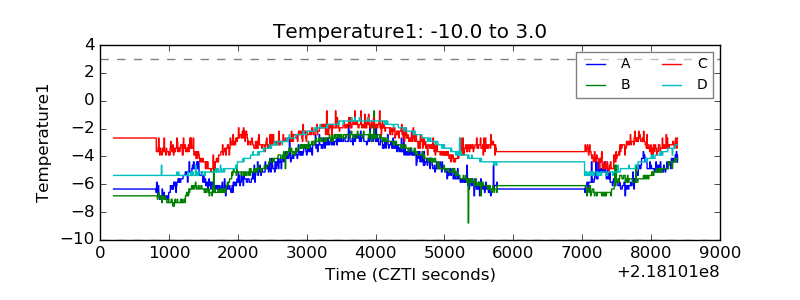 |
| Veto HV Monitor | 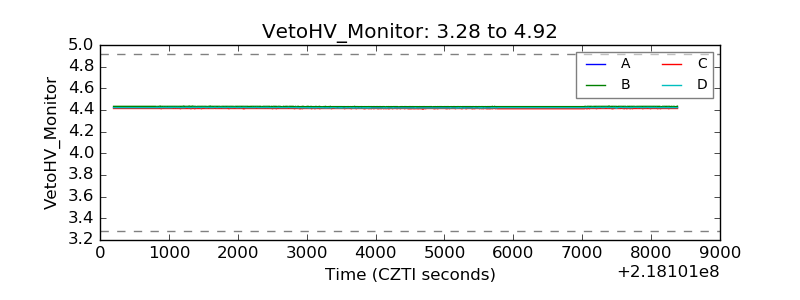 |
| Veto LLD | 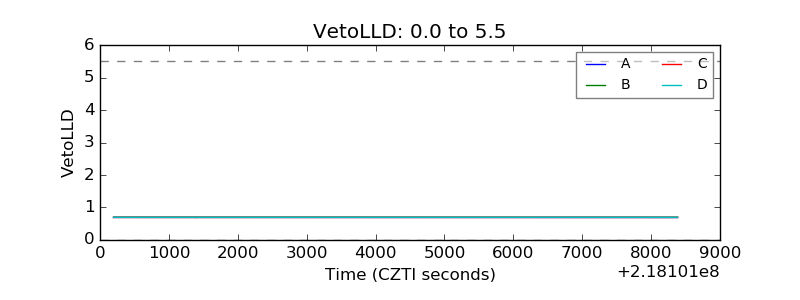 |
| Alpha Counter | 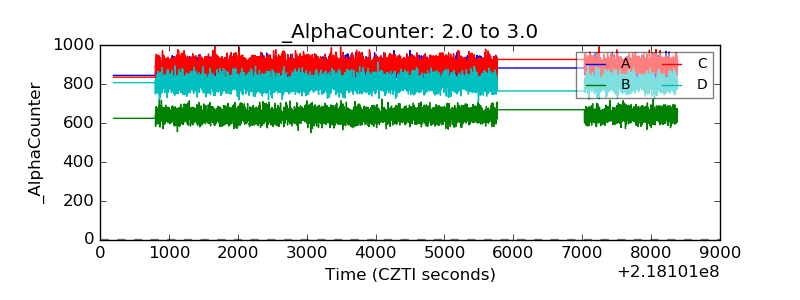 |
| _CPM_Rate | 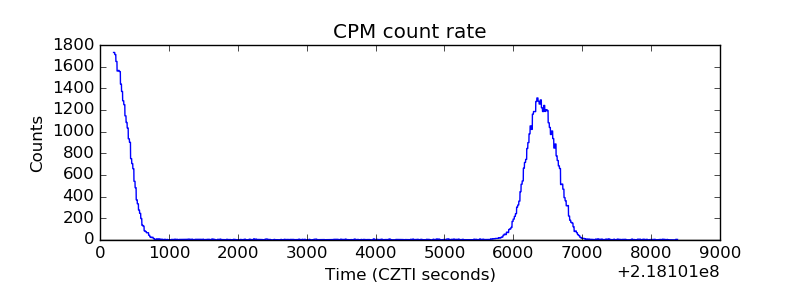 |
| CZT Counter | 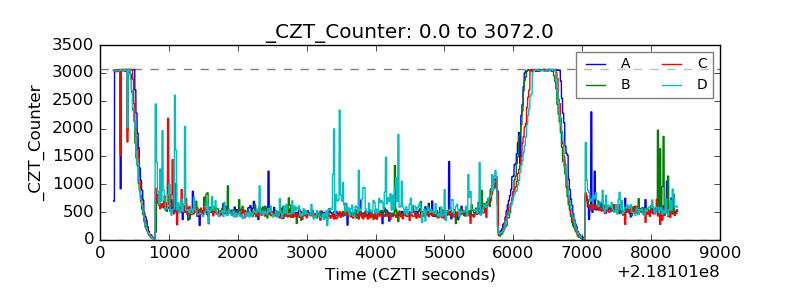 |
| +2.5 Volts monitor |  |
| +5 Volts monitor |  |
| _ROLL_ROT | 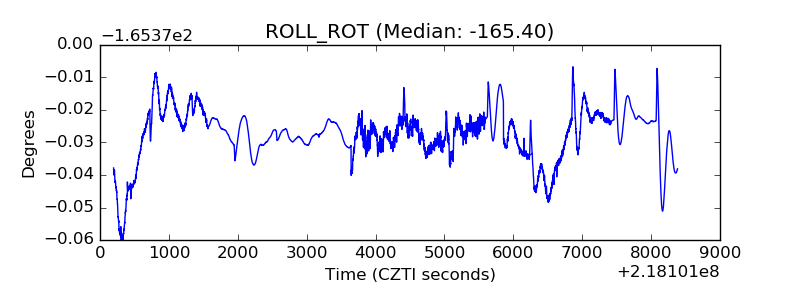 |
| _Roll_DEC | 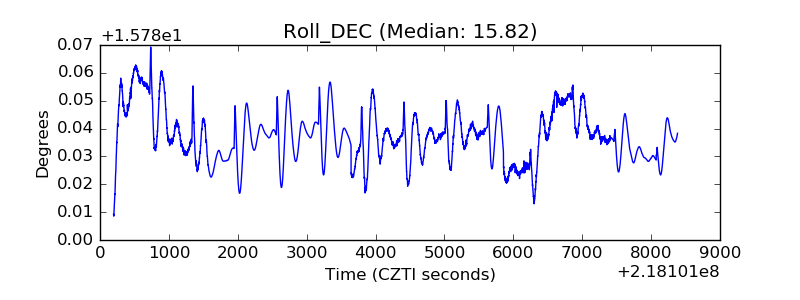 |
| _Roll_RA | 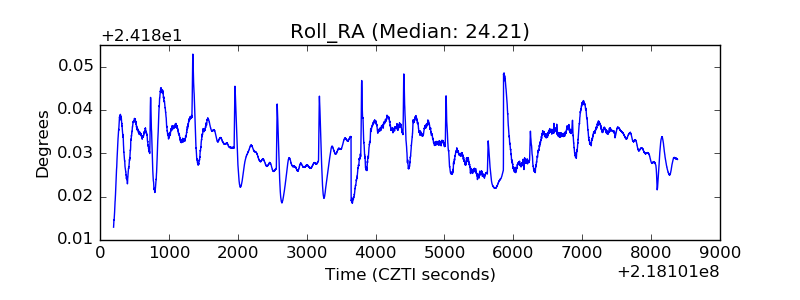 |
| Veto Counter | 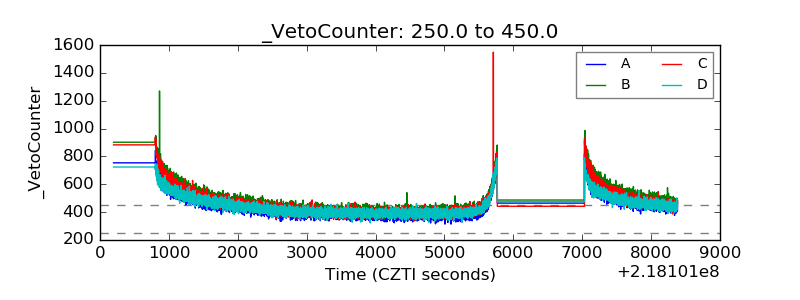 |