| Param | Original file | Final file |
|---|---|---|
| Filename | modeM0/AS1G06_151T01_9000000836_06341cztM0_level2.evt | modeM0/AS1G06_151T01_9000000836_06341cztM0_level2_quad_clean.evt |
| Size (bytes) | 484,583,040 | 87,480,000 |
| Size | 462.1 MB | 83.4 MB |
| Events in quadrant A | 3,312,565 | 559,722 |
| Events in quadrant B | 3,506,058 | 560,180 |
| Events in quadrant C | 3,153,370 | 549,600 |
| Events in quadrant D | 4,261,973 | 526,167 |
| Mode M0 | |||
|---|---|---|---|
| Quadrant | BADHDUFLAG | Total packets | Discarded packets |
| A | 0 | 13774 | 3 |
| B | 0 | 14429 | 2 |
| C | 0 | 13785 | 2 |
| D | 0 | 16837 | 2 |
| Mode M9 | |||
|---|---|---|---|
| Quadrant | BADHDUFLAG | Total packets | Discarded packets |
| A | 0 | 11 | 0 |
| B | 0 | 11 | 0 |
| C | 0 | 11 | 0 |
| D | 0 | 12 | 0 |
| Mode SS | |||
|---|---|---|---|
| Quadrant | BADHDUFLAG | Total packets | Discarded packets |
| A | 0 | 132 | 0 |
| B | 0 | 132 | 0 |
| C | 0 | 132 | 0 |
| D | 0 | 132 | 0 |
| Quadrant | Total seconds | Saturated seconds | Saturation percentage |
|---|---|---|---|
| A | 6503 | 121 | 1.860680% |
| B | 6503 | 157 | 2.414270% |
| C | 6503 | 97 | 1.491619% |
| D | 6503 | 200 | 3.075504% |
Noise dominated data is calculated using 1-second bins in cleaned event files. If a bin has >2000 counts, and if more than 50% of those come from <1% of pixels, then it is considered to be noise-dominated and hence unusable.
| Quadrant | # 1 sec bins | Bins with >0 counts | Bins with >2000 counts | High rate bins dominated by noise | Noise dominated (total time) | Noise dominated (detector-on time) | Marked lightcurve |
|---|---|---|---|---|---|---|---|
| A | 7568 | 6504 | 8 | 8 | 0.11% | 0.12% | 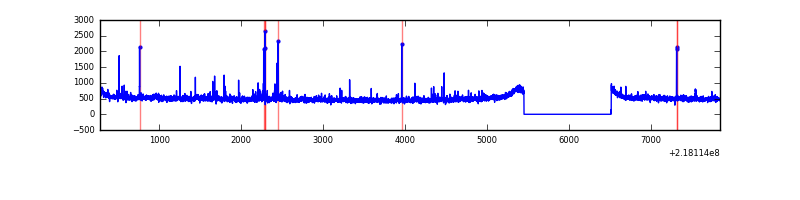 |
| B | 7568 | 6504 | 28 | 28 | 0.37% | 0.43% | 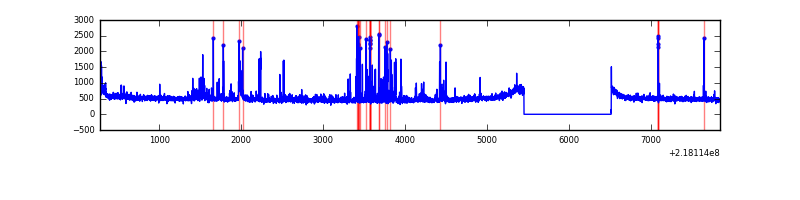 |
| C | 7568 | 6504 | 10 | 10 | 0.13% | 0.15% | 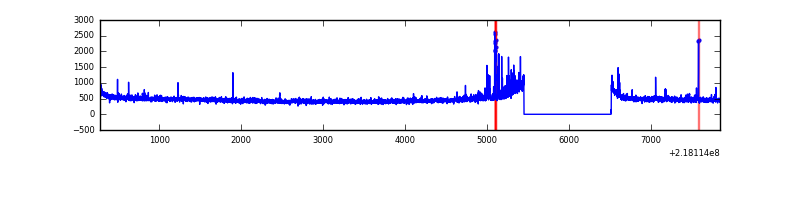 |
| D | 7568 | 6504 | 92 | 92 | 1.22% | 1.41% | 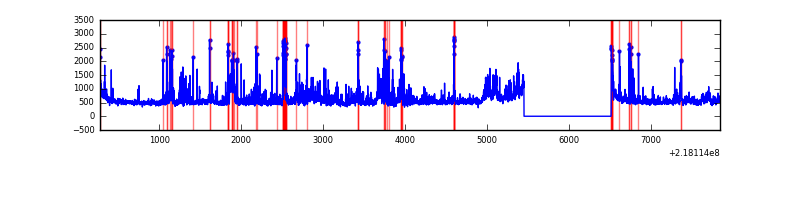 |
Top three noisy pixels from each quadrant. If the there are fewer than three noisy pixels in the level2.evt file, extra rows are filled as -1
| Pixel properties | Quadrant properties | ||||||
|---|---|---|---|---|---|---|---|
| Quadrant | DetID | PixID | Counts | Sigma | Mean | Median | Sigma |
| A | 13 | 251 | 93397 | 556.87 | 810 | 792 | 166.3 |
| A | 15 | 236 | 68083 | 404.65 | 810 | 792 | 166.3 |
| A | 8 | 15 | 15386 | 87.76 | 810 | 792 | 166.3 |
| B | 3 | 64 | 286597 | 1828.24 | 809 | 791 | 156.3 |
| B | 15 | 204 | 49593 | 312.18 | 809 | 791 | 156.3 |
| B | 4 | 172 | 20647 | 127.01 | 809 | 791 | 156.3 |
| C | 4 | 254 | 122731 | 683.43 | 772 | 777 | 178.4 |
| C | 9 | 54 | 11057 | 57.61 | 772 | 777 | 178.4 |
| C | 13 | 61 | 6052 | 29.56 | 772 | 777 | 178.4 |
| D | 12 | 220 | 552912 | 2892.97 | 775 | 750 | 190.9 |
| D | 13 | 46 | 279317 | 1459.51 | 775 | 750 | 190.9 |
| D | 12 | 221 | 182987 | 954.8 | 775 | 750 | 190.9 |
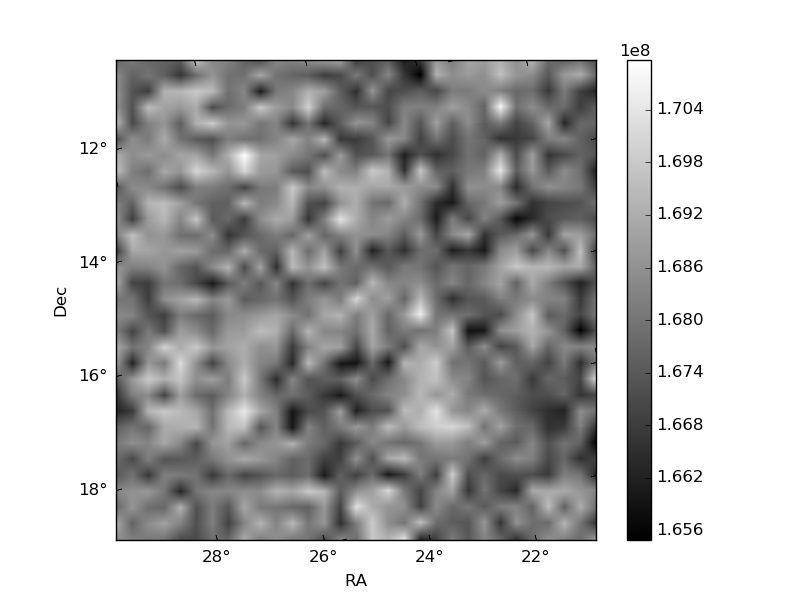
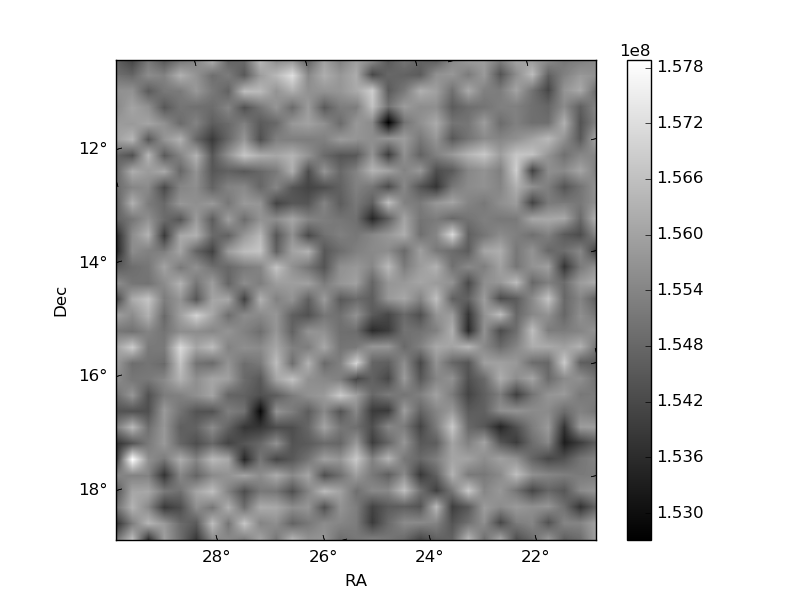
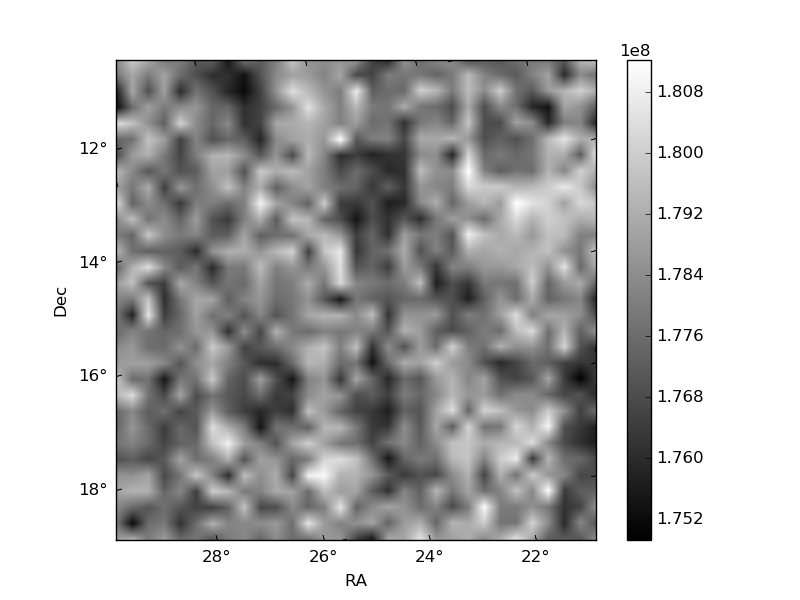
Histogram calculated using DETX and DETY for each event in the final _common_clean file
| Quadrant A | 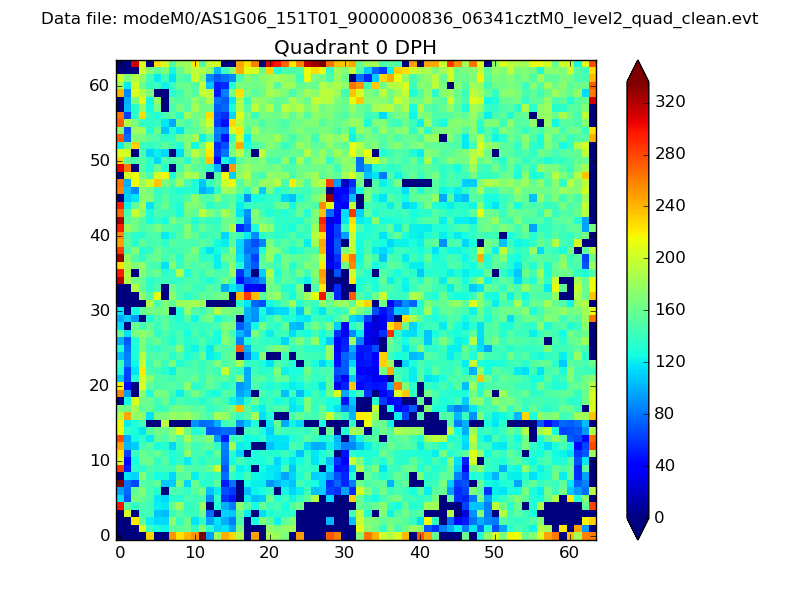 |
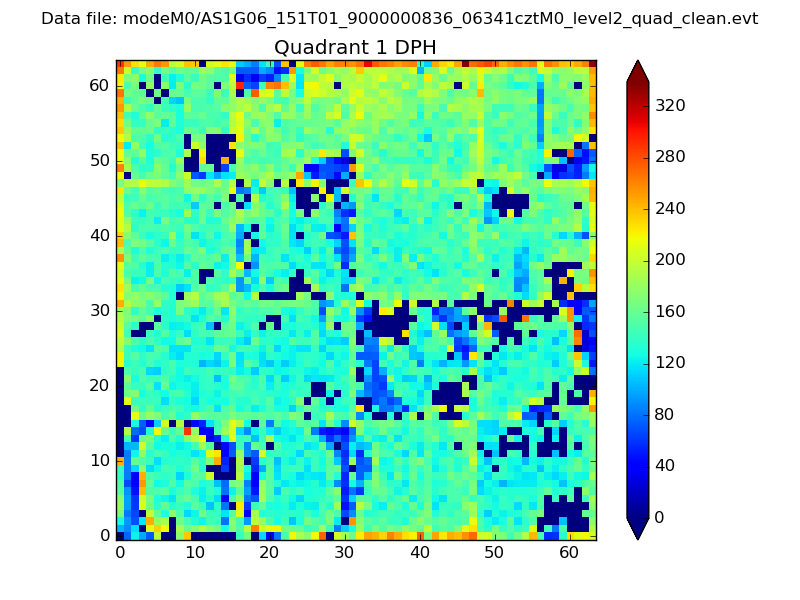 |
Quadrant B |
|---|---|---|---|
| Quadrant D | 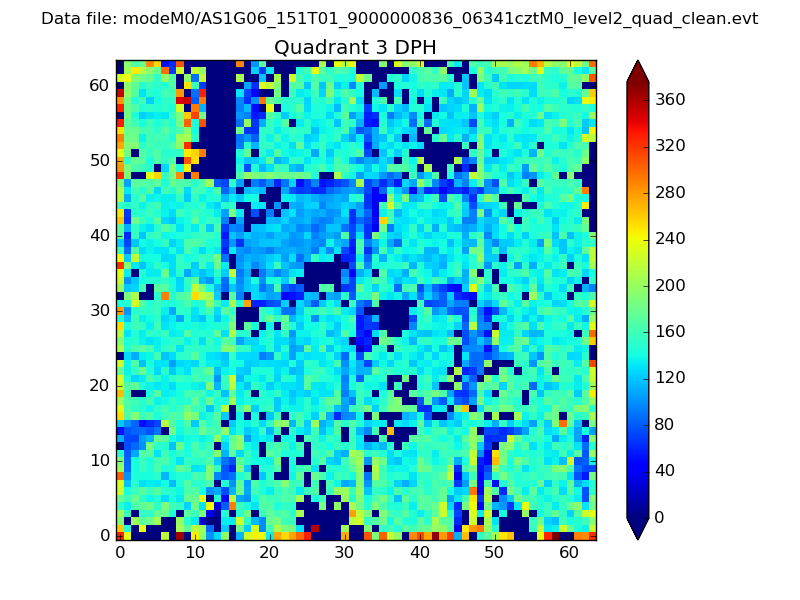 |
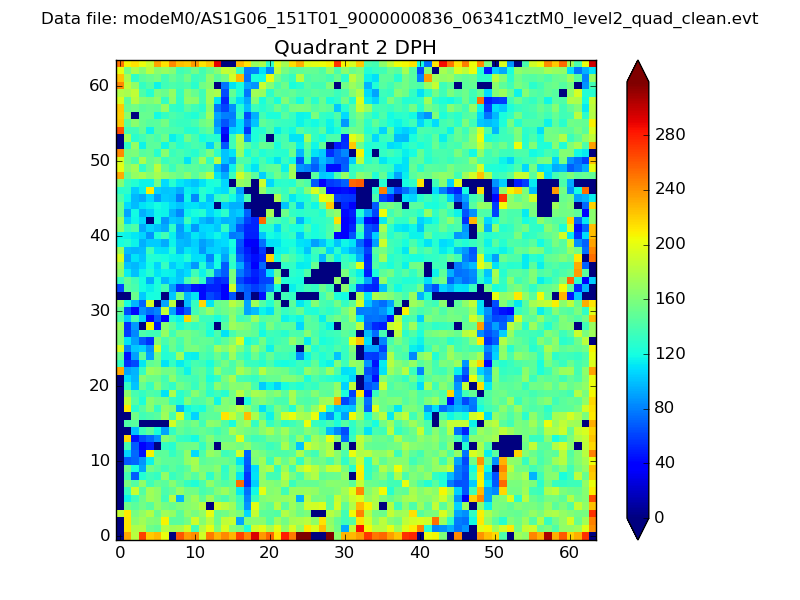 |
Quadrant C |
| Plot type | Count rate plots | Images |
|---|---|---|
| Comparison with Poisson distribution Blue bars denote a histogram of data divided into 1 sec bins. Red curve is a Poisson curve with rate = median count rate of data. |
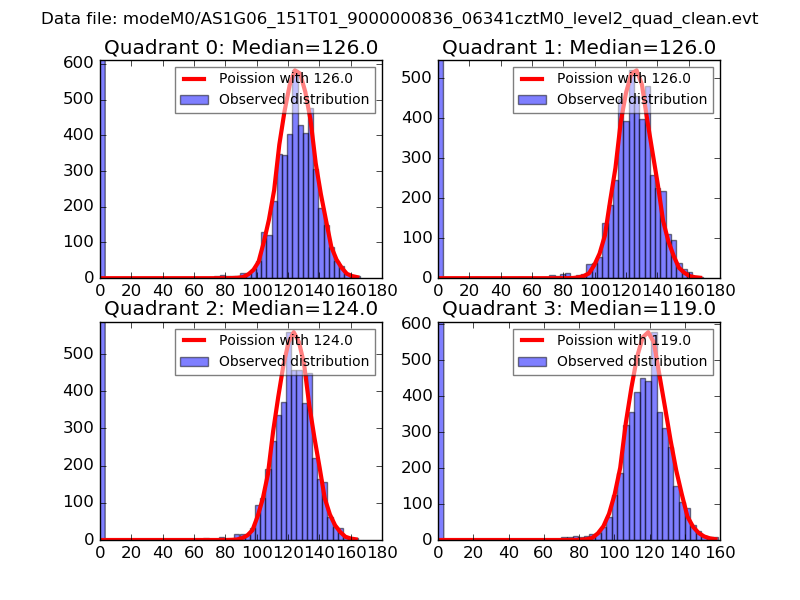 |
 |
| Quadrant-wise count rates Data is divided into 100 sec bins |
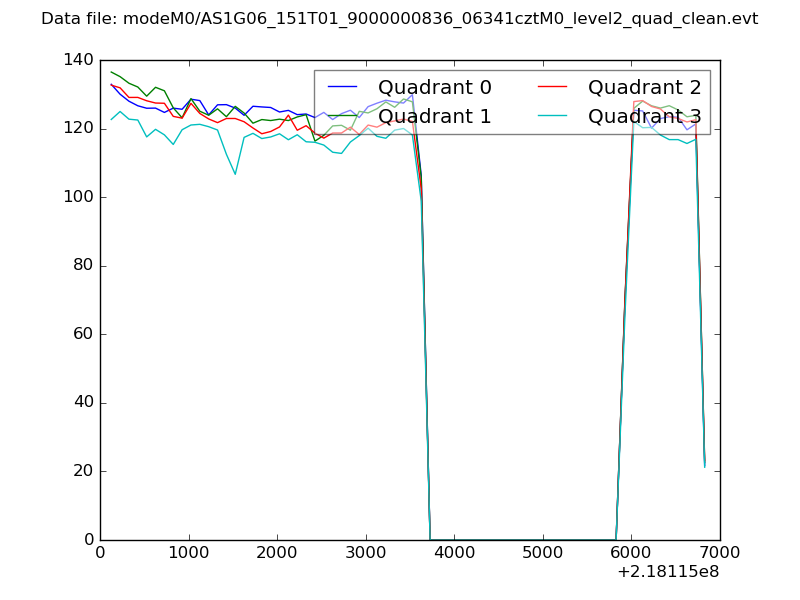 |
|
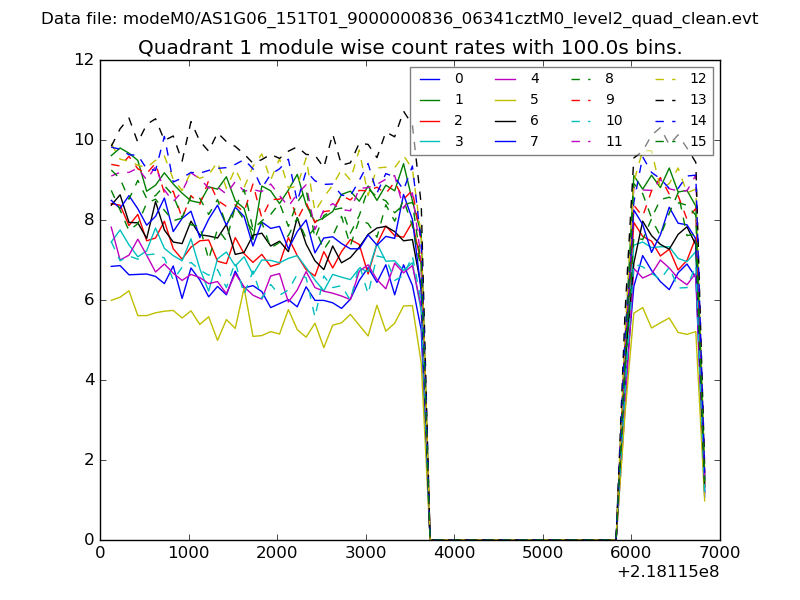
| Module-wise count rates for Quadrant A Data is divided into 100 sec bins |
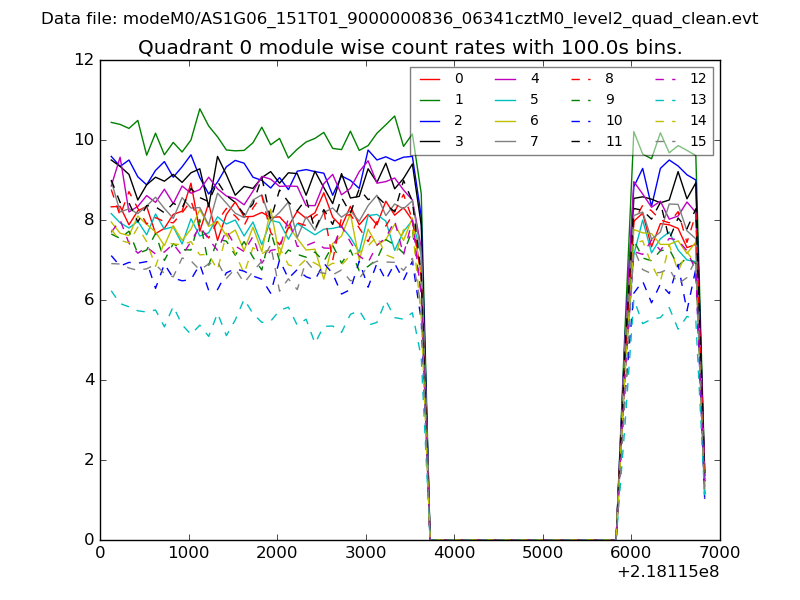 |
 |
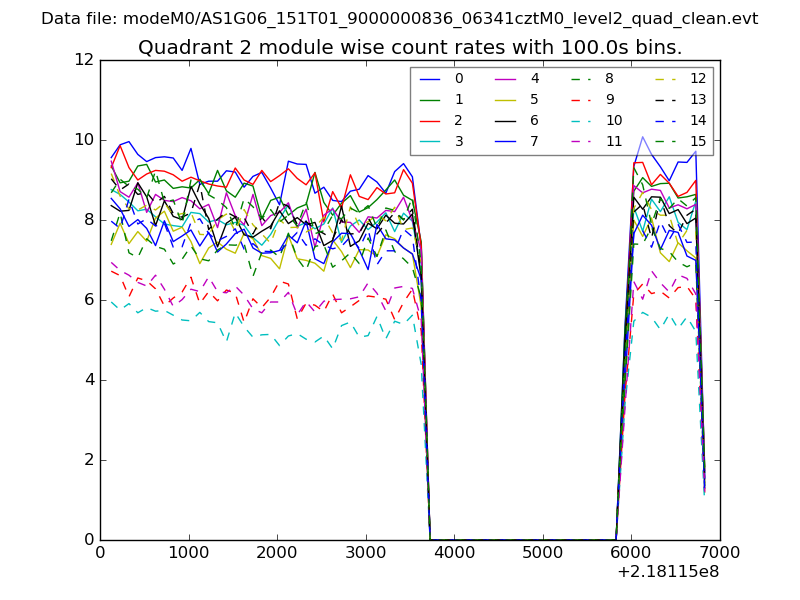
| Module-wise count rates for Quadrant B Data is divided into 100 sec bins |
 |
 |
| Module-wise count rates for Quadrant C Data is divided into 100 sec bins |
 |
 |
| Module-wise count rates for Quadrant D Data is divided into 100 sec bins |
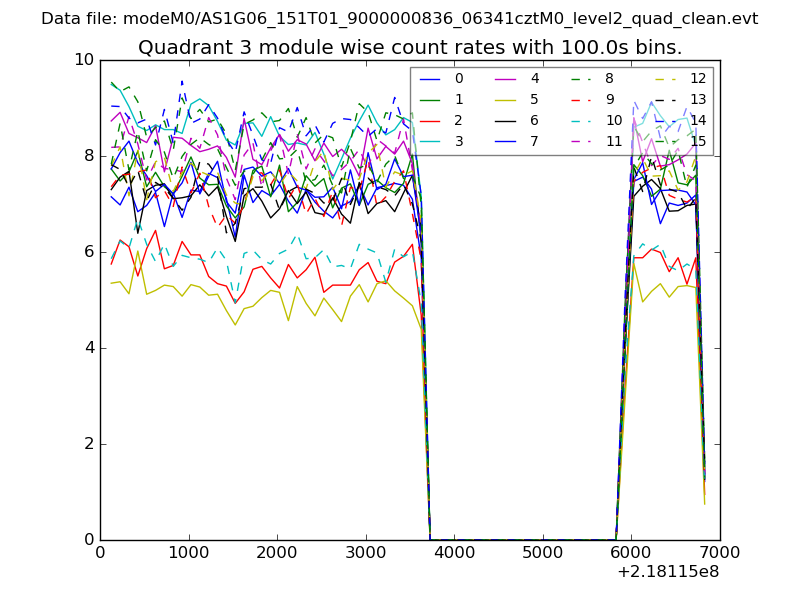 |
 |
| Parameter | Plot |
|---|---|
| CZT HV Monitor | 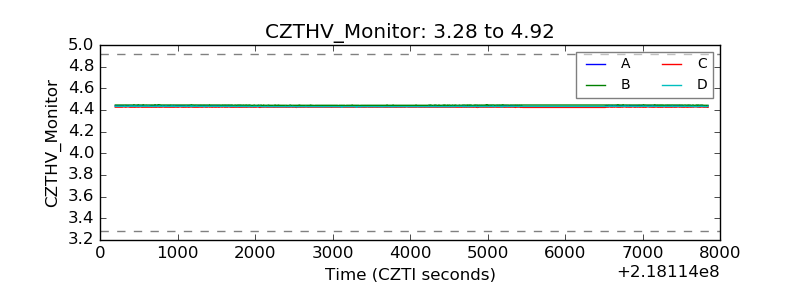 |
| D_VDD | 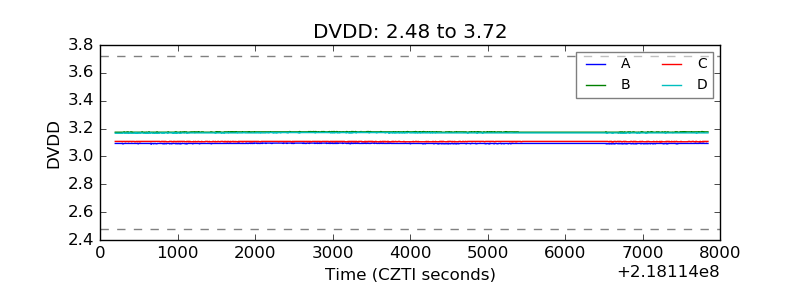 |
| Temperature 1 | 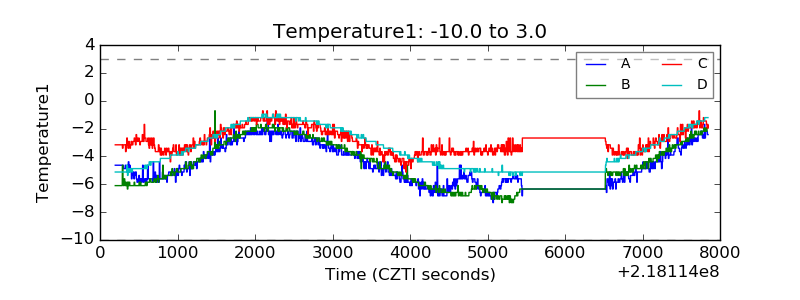 |
| Veto HV Monitor | 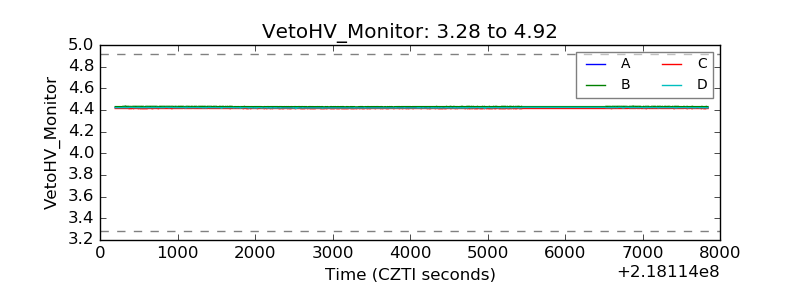 |
| Veto LLD | 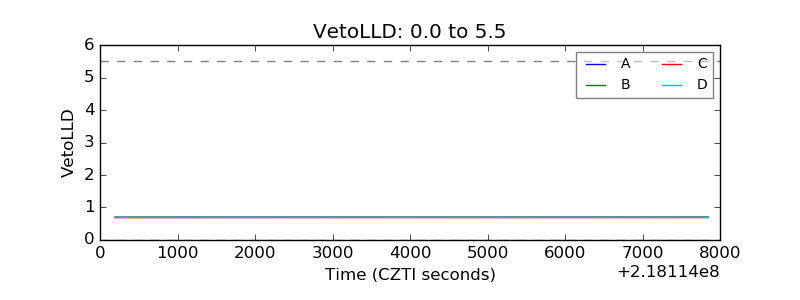 |
| Alpha Counter | 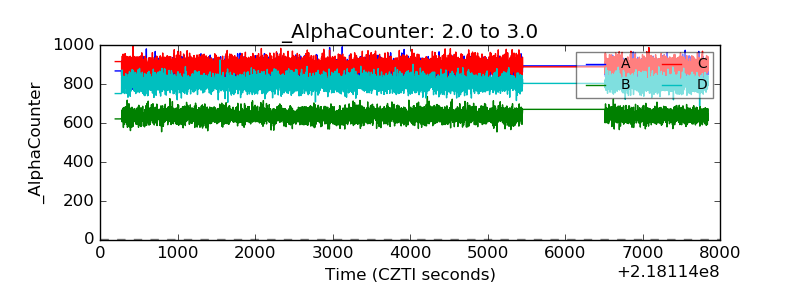 |
| _CPM_Rate | 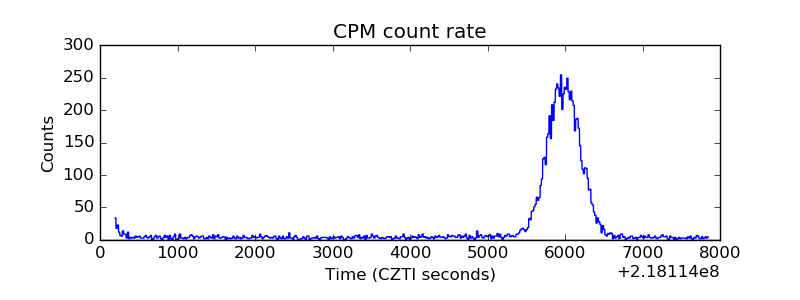 |
| CZT Counter | 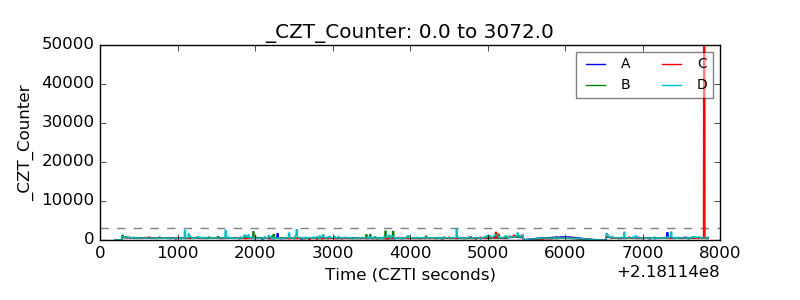 |
| +2.5 Volts monitor | 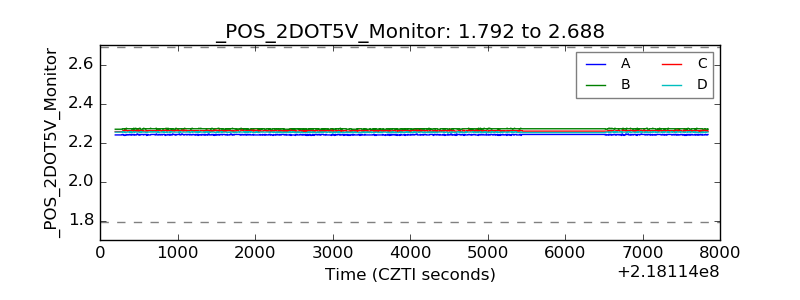 |
| +5 Volts monitor |  |
| _ROLL_ROT | 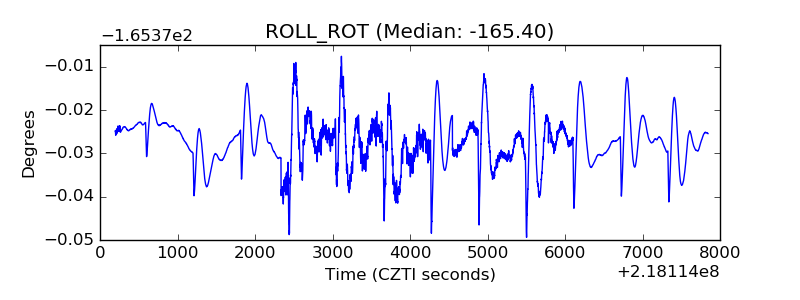 |
| _Roll_DEC | 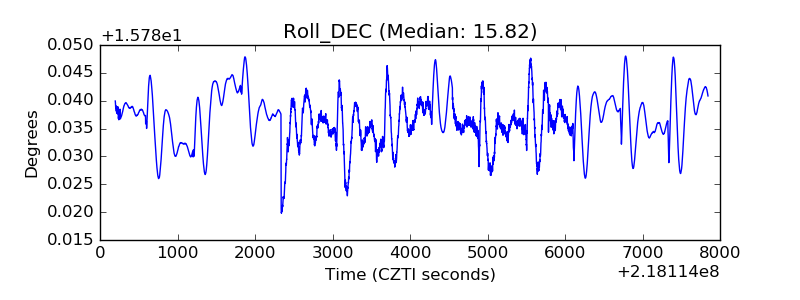 |
| _Roll_RA |  |
| Veto Counter | 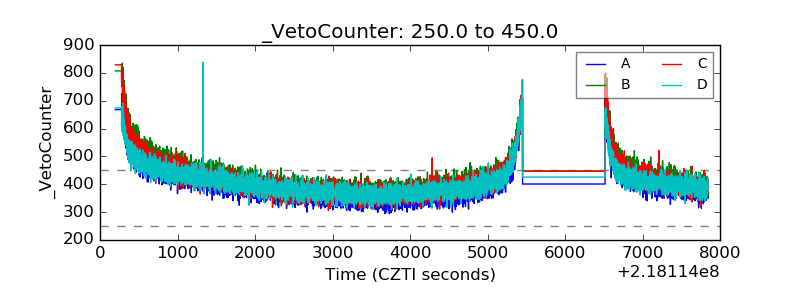 |