| Param | Original file | Final file |
|---|---|---|
| Filename | modeM0/AS1A02_173T01_9000000840cztM0_level2.fits | modeM0/AS1A02_173T01_9000000840cztM0_level2_quad_clean.evt |
| Size (bytes) | 47,848,320 | 46,615,680 |
| Size | 45.6 MB | 44.5 MB |
| Events in quadrant A | 284,622 | 275,103 |
| Events in quadrant B | 266,110 | 258,681 |
| Events in quadrant C | 278,882 | 258,065 |
| Events in quadrant D | 236,706 | 236,165 |
| Mode M0 | |||
|---|---|---|---|
| Quadrant | BADHDUFLAG | Total packets | Discarded packets |
| A | 0 | 11146 | 0 |
| B | 0 | 13988 | 0 |
| C | 0 | 11152 | 0 |
| D | 0 | 14347 | 0 |
| Mode SS | |||
|---|---|---|---|
| Quadrant | BADHDUFLAG | Total packets | Discarded packets |
| A | 0 | 112 | 0 |
| B | 0 | 112 | 0 |
| C | 0 | 112 | 0 |
| D | 0 | 112 | 0 |
| Mode M9 | |||
|---|---|---|---|
| Quadrant | BADHDUFLAG | Total packets | Discarded packets |
| A | 0 | 7 | 0 |
| B | 0 | 7 | 0 |
| C | 0 | 7 | 0 |
| D | 0 | 7 | 0 |
| Quadrant | Total seconds | Saturated seconds | Saturation percentage |
|---|---|---|---|
| A | 5465 | 12 | 0.219579% |
| B | 5465 | 257 | 4.702653% |
| C | 5465 | 7 | 0.128088% |
| D | 5465 | 126 | 2.305581% |
Noise dominated data is calculated using 1-second bins in cleaned event files. If a bin has >2000 counts, and if more than 50% of those come from <1% of pixels, then it is considered to be noise-dominated and hence unusable.
| Quadrant | # 1 sec bins | Bins with >0 counts | Bins with >2000 counts | High rate bins dominated by noise | Noise dominated (total time) | Noise dominated (detector-on time) | Marked lightcurve |
|---|---|---|---|---|---|---|---|
| A | 6164 | 5464 | 0 | 0 | 0.00% | 0.00% |  |
| B | 6164 | 5438 | 0 | 0 | 0.00% | 0.00% | 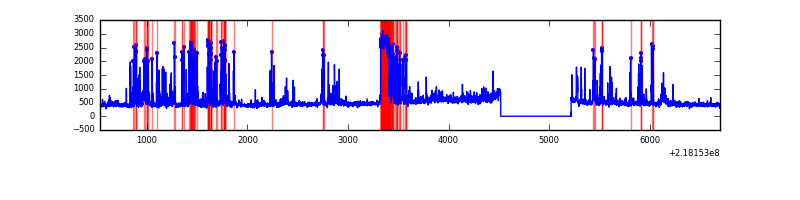 |
| C | 6164 | 5464 | 0 | 0 | 0.00% | 0.00% | 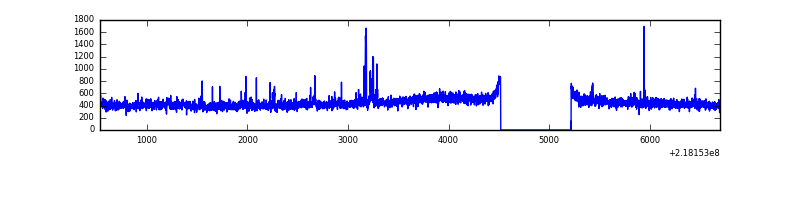 |
| D | 6164 | 5462 | 0 | 0 | 0.00% | 0.00% |  |
Top three noisy pixels from each quadrant. If the there are fewer than three noisy pixels in the level2.evt file, extra rows are filled as -1
| Pixel properties | Quadrant properties | ||||||
|---|---|---|---|---|---|---|---|
| Quadrant | DetID | PixID | Counts | Sigma | Mean | Median | Sigma |
| A | 14 | 188 | 309 | 11.3 | 73 | 69 | 21.2 |
| A | 0 | 29 | 278 | 9.84 | 73 | 69 | 21.2 |
| A | 14 | 204 | 258 | 8.9 | 73 | 69 | 21.2 |
| B | 2 | 9 | 245 | 11.09 | 70 | 67 | 16.1 |
| B | 14 | 254 | 204 | 8.54 | 70 | 67 | 16.1 |
| B | 5 | 128 | 196 | 8.04 | 70 | 67 | 16.1 |
| C | 3 | 158 | 201 | 6.27 | 73 | 68 | 21.2 |
| C | 7 | 111 | 199 | 6.17 | 73 | 68 | 21.2 |
| C | 12 | 241 | 196 | 6.03 | 73 | 68 | 21.2 |
| D | 6 | 231 | 196 | 6.69 | 67 | 61 | 20.2 |
| D | 4 | 246 | 195 | 6.64 | 67 | 61 | 20.2 |
| D | 3 | 14 | 193 | 6.54 | 67 | 61 | 20.2 |
Histogram calculated using DETX and DETY for each event in the final _common_clean file
| Quadrant A | 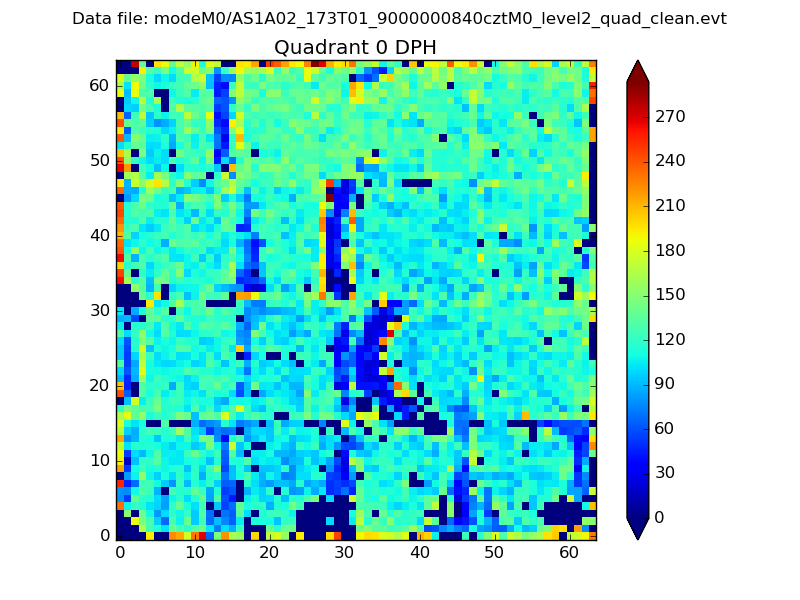 |
 |
Quadrant B |
|---|---|---|---|
| Quadrant D | 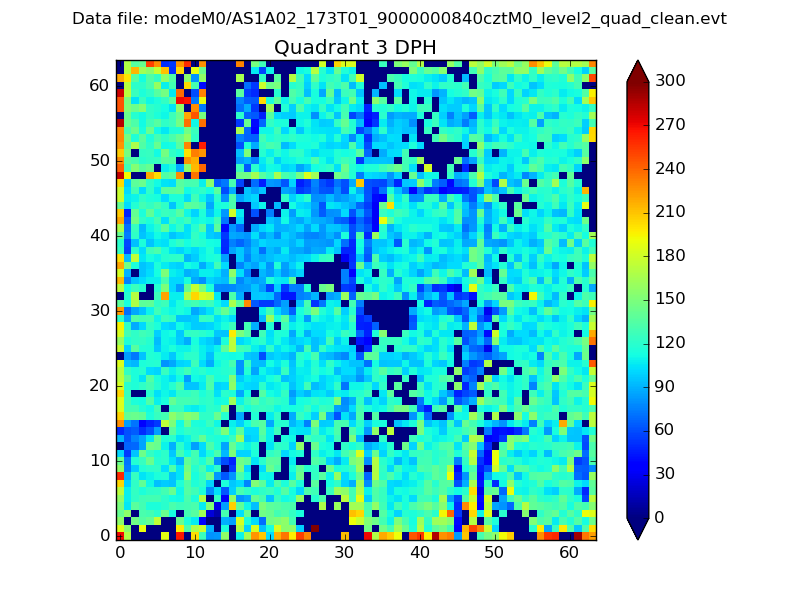 |
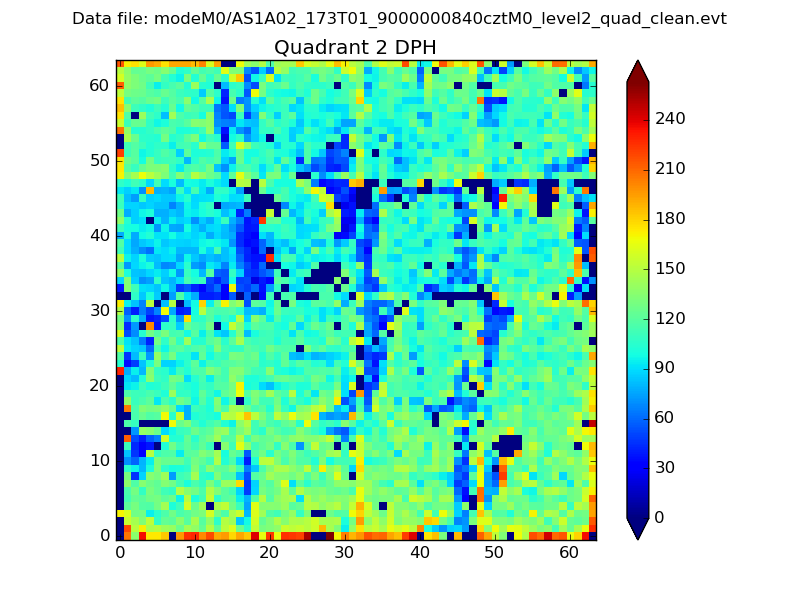 |
Quadrant C |
| Plot type | Count rate plots | Images |
|---|---|---|
| Comparison with Poisson distribution Blue bars denote a histogram of data divided into 1 sec bins. Red curve is a Poisson curve with rate = median count rate of data. |
 |
 |
| Quadrant-wise count rates Data is divided into 100 sec bins |
 |
|
| Module-wise count rates for Quadrant A Data is divided into 100 sec bins |
 |
 |
| Module-wise count rates for Quadrant B Data is divided into 100 sec bins |
 |
 |
| Module-wise count rates for Quadrant C Data is divided into 100 sec bins |
 |
 |
| Module-wise count rates for Quadrant D Data is divided into 100 sec bins |
 |
 |
| Parameter | Plot |
|---|---|
| CZT HV Monitor |  |
| D_VDD | 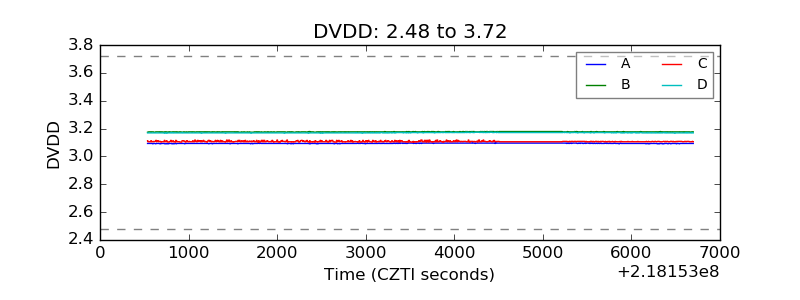 |
| Temperature 1 |  |
| Veto HV Monitor |  |
| Veto LLD |  |
| Alpha Counter |  |
| _CPM_Rate |  |
| CZT Counter | 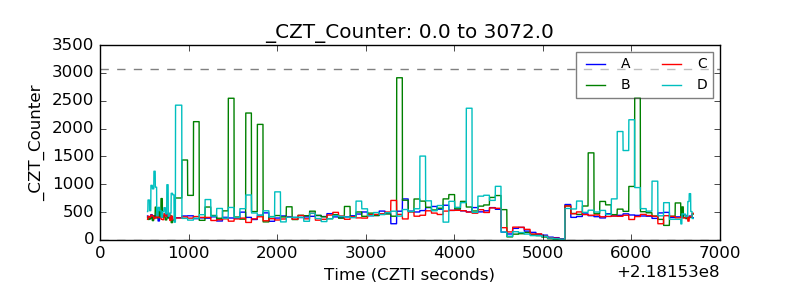 |
| +2.5 Volts monitor |  |
| +5 Volts monitor |  |
| _ROLL_ROT |  |
| _Roll_DEC |  |
| _Roll_RA |  |
| Veto Counter |  |