| Param | Original file | Final file |
|---|---|---|
| Filename | modeM0/AS1G06_132T01_9000000838cztM0_level2.fits | modeM0/AS1G06_132T01_9000000838cztM0_level2_quad_clean.evt |
| Size (bytes) | 227,563,200 | 211,645,440 |
| Size | 217.0 MB | 201.8 MB |
| Events in quadrant A | 1,374,630 | 1,255,021 |
| Events in quadrant B | 1,287,872 | 1,187,571 |
| Events in quadrant C | 1,352,164 | 1,206,663 |
| Events in quadrant D | 1,098,046 | 981,965 |
| Mode M9 | |||
|---|---|---|---|
| Quadrant | BADHDUFLAG | Total packets | Discarded packets |
| A | 0 | 23 | 0 |
| B | 0 | 23 | 0 |
| C | 0 | 23 | 0 |
| D | 0 | 23 | 0 |
| Mode M0 | |||
|---|---|---|---|
| Quadrant | BADHDUFLAG | Total packets | Discarded packets |
| A | 0 | 54232 | 0 |
| B | 0 | 65346 | 0 |
| C | 0 | 54096 | 0 |
| D | 0 | 88058 | 0 |
| Mode SS | |||
|---|---|---|---|
| Quadrant | BADHDUFLAG | Total packets | Discarded packets |
| A | 0 | 528 | 0 |
| B | 0 | 528 | 0 |
| C | 0 | 528 | 0 |
| D | 0 | 528 | 0 |
| Quadrant | Total seconds | Saturated seconds | Saturation percentage |
|---|---|---|---|
| A | 25853 | 218 | 0.843229% |
| B | 25853 | 1387 | 5.364948% |
| C | 25853 | 170 | 0.657564% |
| D | 25853 | 2704 | 10.459134% |
Noise dominated data is calculated using 1-second bins in cleaned event files. If a bin has >2000 counts, and if more than 50% of those come from <1% of pixels, then it is considered to be noise-dominated and hence unusable.
| Quadrant | # 1 sec bins | Bins with >0 counts | Bins with >2000 counts | High rate bins dominated by noise | Noise dominated (total time) | Noise dominated (detector-on time) | Marked lightcurve |
|---|---|---|---|---|---|---|---|
| A | 28002 | 25850 | 0 | 0 | 0.00% | 0.00% |  |
| B | 28003 | 25834 | 0 | 0 | 0.00% | 0.00% |  |
| C | 28002 | 25850 | 0 | 0 | 0.00% | 0.00% |  |
| D | 28003 | 25837 | 0 | 0 | 0.00% | 0.00% |  |
Top three noisy pixels from each quadrant. If the there are fewer than three noisy pixels in the level2.evt file, extra rows are filled as -1
| Pixel properties | Quadrant properties | ||||||
|---|---|---|---|---|---|---|---|
| Quadrant | DetID | PixID | Counts | Sigma | Mean | Median | Sigma |
| A | 14 | 188 | 1425 | 11.77 | 356 | 332 | 92.9 |
| A | 0 | 29 | 1391 | 11.4 | 356 | 332 | 92.9 |
| A | 14 | 204 | 1174 | 9.07 | 356 | 332 | 92.9 |
| B | 2 | 9 | 1107 | 11.04 | 341 | 323 | 71.0 |
| B | 14 | 254 | 961 | 8.98 | 341 | 323 | 71.0 |
| B | 12 | 226 | 933 | 8.59 | 341 | 323 | 71.0 |
| C | 12 | 241 | 976 | 6.66 | 357 | 329 | 97.1 |
| C | 1 | 80 | 971 | 6.61 | 357 | 329 | 97.1 |
| C | 1 | 81 | 958 | 6.47 | 357 | 329 | 97.1 |
| D | 3 | 14 | 838 | 6.44 | 313 | 283 | 86.2 |
| D | 6 | 83 | 816 | 6.18 | 313 | 283 | 86.2 |
| D | 6 | 231 | 798 | 5.97 | 313 | 283 | 86.2 |
Histogram calculated using DETX and DETY for each event in the final _common_clean file
| Quadrant A | 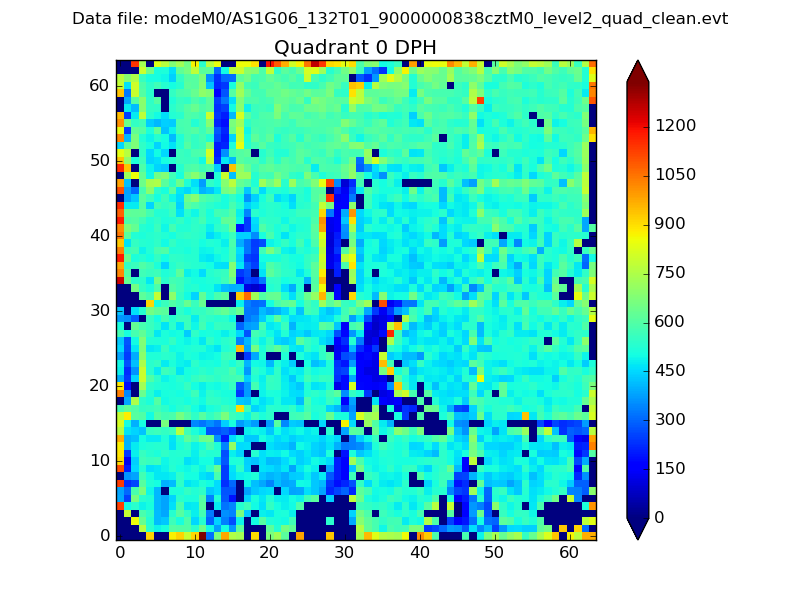 |
 |
Quadrant B |
|---|---|---|---|
| Quadrant D |  |
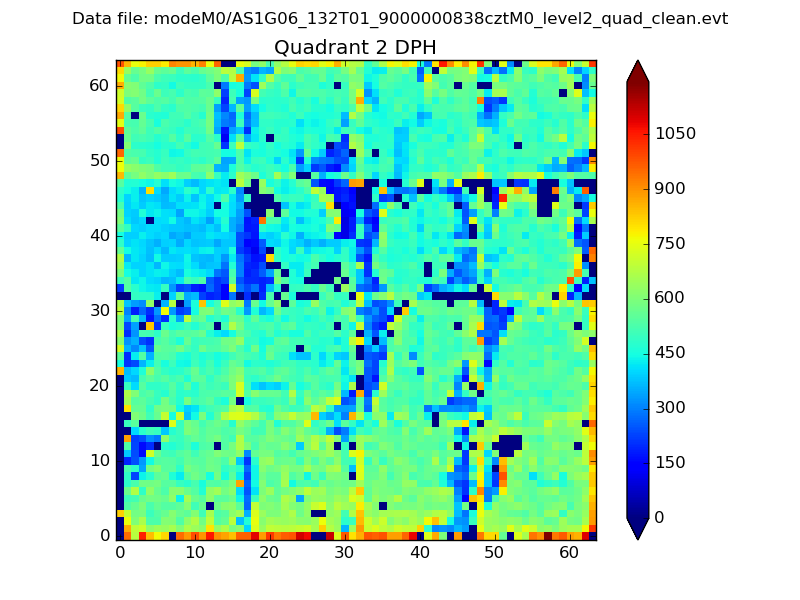 |
Quadrant C |
| Plot type | Count rate plots | Images |
|---|---|---|
| Comparison with Poisson distribution Blue bars denote a histogram of data divided into 1 sec bins. Red curve is a Poisson curve with rate = median count rate of data. |
 |
 |
| Quadrant-wise count rates Data is divided into 100 sec bins |
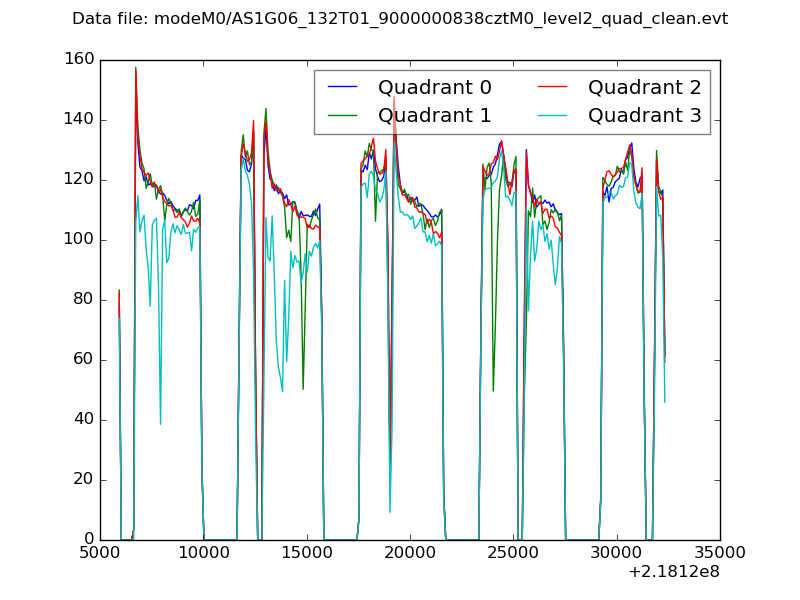 |
|
| Module-wise count rates for Quadrant A Data is divided into 100 sec bins |
 |
 |
| Module-wise count rates for Quadrant B Data is divided into 100 sec bins |
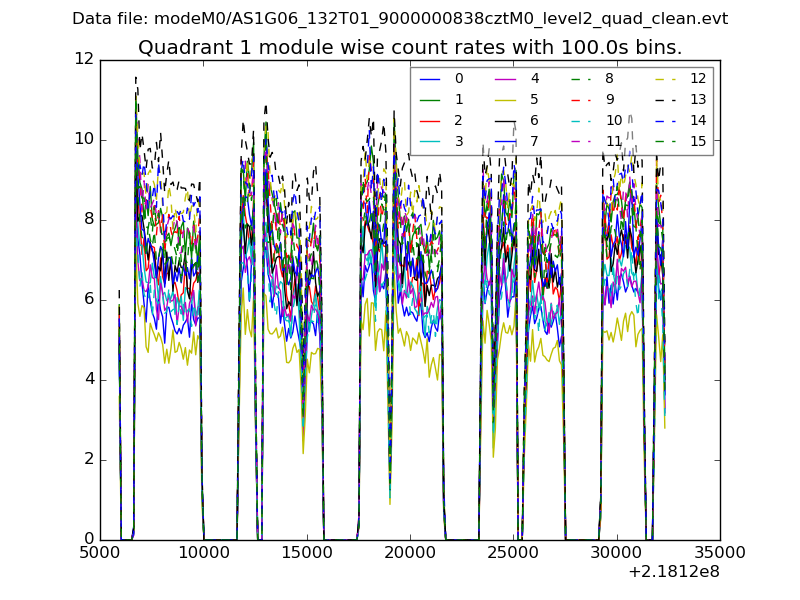 |
 |
| Module-wise count rates for Quadrant C Data is divided into 100 sec bins |
 |
 |
| Module-wise count rates for Quadrant D Data is divided into 100 sec bins |
 |
 |
| Parameter | Plot |
|---|---|
| CZT HV Monitor |  |
| D_VDD | 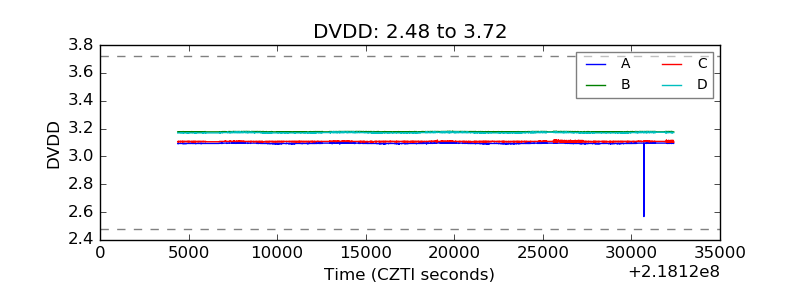 |
| Temperature 1 | 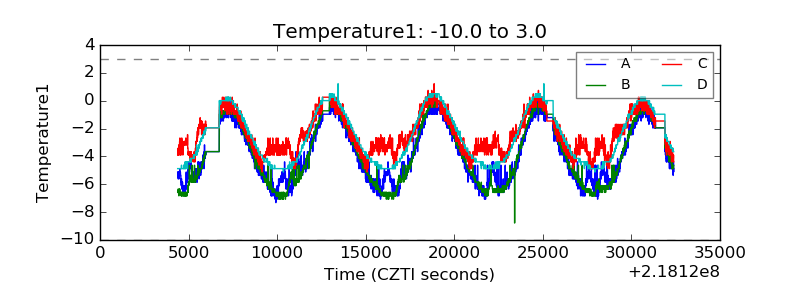 |
| Veto HV Monitor | 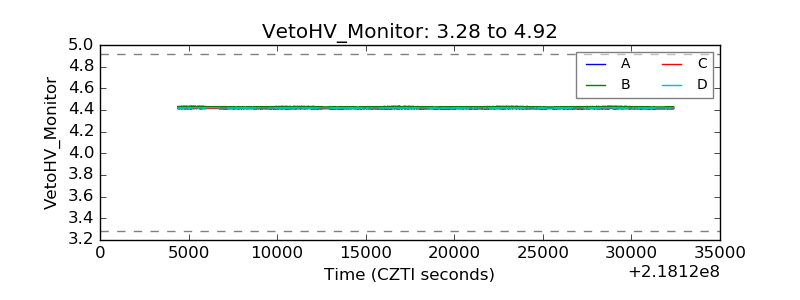 |
| Veto LLD | 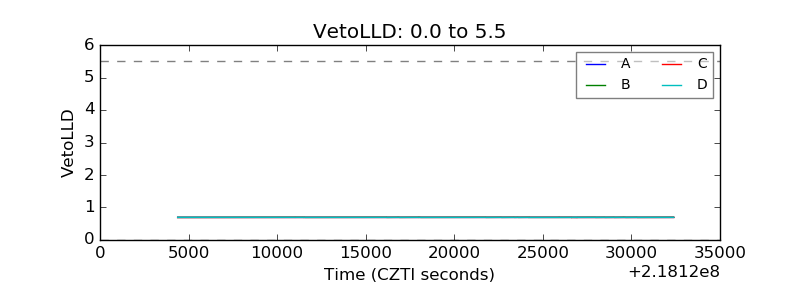 |
| Alpha Counter |  |
| _CPM_Rate |  |
| CZT Counter | 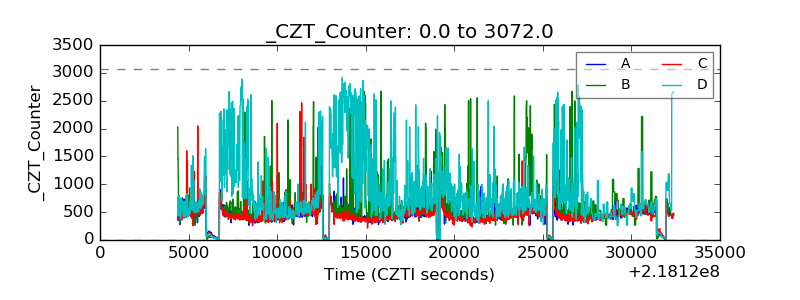 |
| +2.5 Volts monitor | 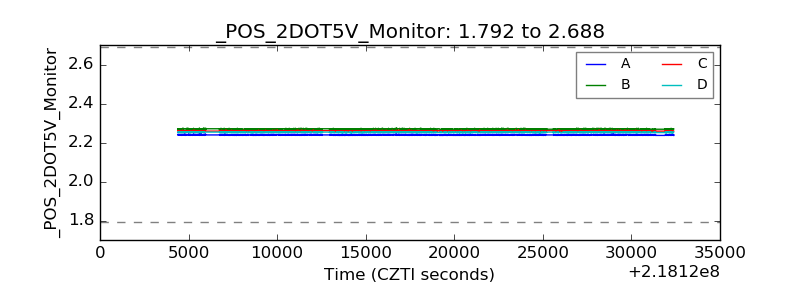 |
| +5 Volts monitor |  |
| _ROLL_ROT |  |
| _Roll_DEC |  |
| _Roll_RA |  |
| Veto Counter |  |