| Param | Original file | Final file |
|---|---|---|
| Filename | modeM0/AS1G06_132T01_9000000838_06342cztM0_level2.evt | modeM0/AS1G06_132T01_9000000838_06342cztM0_level2_quad_clean.evt |
| Size (bytes) | 302,207,040 | 34,084,800 |
| Size | 288.2 MB | 32.5 MB |
| Events in quadrant A | 1,678,267 | 208,688 |
| Events in quadrant B | 1,862,972 | 211,475 |
| Events in quadrant C | 1,676,790 | 211,457 |
| Events in quadrant D | 3,711,201 | 167,702 |
| Mode M9 | |||
|---|---|---|---|
| Quadrant | BADHDUFLAG | Total packets | Discarded packets |
| A | 0 | 8 | 0 |
| B | 0 | 8 | 0 |
| C | 0 | 8 | 0 |
| D | 0 | 8 | 0 |
| Mode M0 | |||
|---|---|---|---|
| Quadrant | BADHDUFLAG | Total packets | Discarded packets |
| A | 0 | 6970 | 2 |
| B | 0 | 7579 | 1 |
| C | 0 | 7227 | 1 |
| D | 0 | 13265 | 1 |
| Mode SS | |||
|---|---|---|---|
| Quadrant | BADHDUFLAG | Total packets | Discarded packets |
| A | 0 | 66 | 0 |
| B | 0 | 66 | 0 |
| C | 0 | 66 | 0 |
| D | 0 | 66 | 0 |
| Quadrant | Total seconds | Saturated seconds | Saturation percentage |
|---|---|---|---|
| A | 3270 | 77 | 2.354740% |
| B | 3270 | 141 | 4.311927% |
| C | 3270 | 48 | 1.467890% |
| D | 3270 | 607 | 18.562691% |
Noise dominated data is calculated using 1-second bins in cleaned event files. If a bin has >2000 counts, and if more than 50% of those come from <1% of pixels, then it is considered to be noise-dominated and hence unusable.
| Quadrant | # 1 sec bins | Bins with >0 counts | Bins with >2000 counts | High rate bins dominated by noise | Noise dominated (total time) | Noise dominated (detector-on time) | Marked lightcurve |
|---|---|---|---|---|---|---|---|
| A | 4010 | 3271 | 1 | 1 | 0.02% | 0.03% | 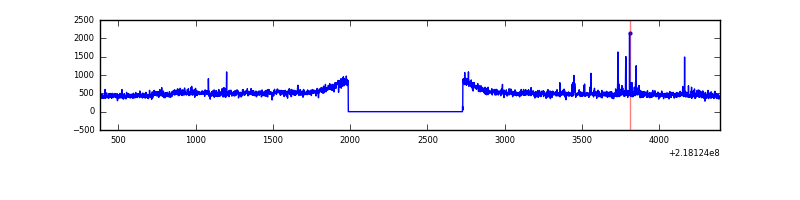 |
| B | 4010 | 3271 | 50 | 50 | 1.25% | 1.53% | 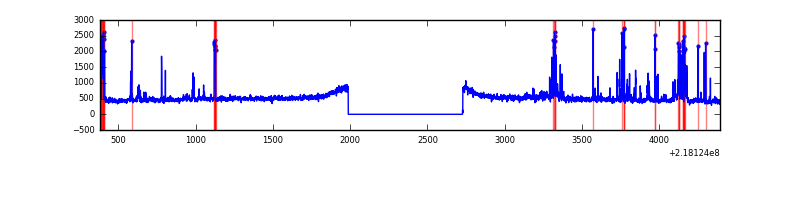 |
| C | 4010 | 3271 | 16 | 16 | 0.40% | 0.49% | 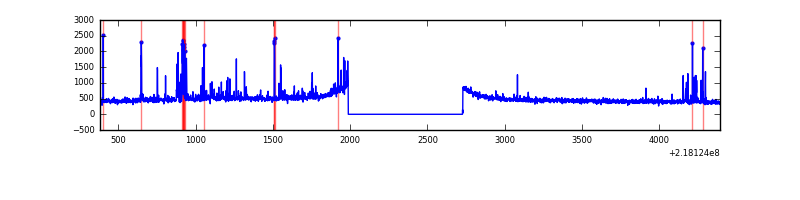 |
| D | 4010 | 3271 | 491 | 491 | 12.24% | 15.01% | 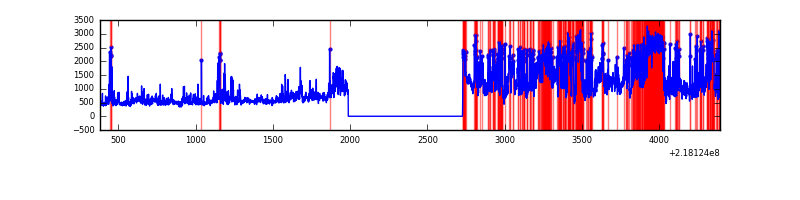 |
Top three noisy pixels from each quadrant. If the there are fewer than three noisy pixels in the level2.evt file, extra rows are filled as -1
| Pixel properties | Quadrant properties | ||||||
|---|---|---|---|---|---|---|---|
| Quadrant | DetID | PixID | Counts | Sigma | Mean | Median | Sigma |
| A | 15 | 236 | 42905 | 501.47 | 407 | 397 | 84.8 |
| A | 13 | 251 | 20850 | 241.28 | 407 | 397 | 84.8 |
| A | 15 | 234 | 20299 | 234.78 | 407 | 397 | 84.8 |
| B | 3 | 64 | 164763 | 2046.64 | 407 | 397 | 80.3 |
| B | 0 | 219 | 73917 | 915.45 | 407 | 397 | 80.3 |
| B | 0 | 214 | 26262 | 322.06 | 407 | 397 | 80.3 |
| C | 4 | 254 | 141879 | 1537.6 | 390 | 392 | 92.0 |
| C | 14 | 234 | 6856 | 70.25 | 390 | 392 | 92.0 |
| C | 13 | 61 | 3086 | 29.28 | 390 | 392 | 92.0 |
| D | 12 | 220 | 1041759 | 11384.46 | 367 | 355 | 91.5 |
| D | 12 | 221 | 587405 | 6417.54 | 367 | 355 | 91.5 |
| D | 13 | 46 | 317214 | 3463.85 | 367 | 355 | 91.5 |
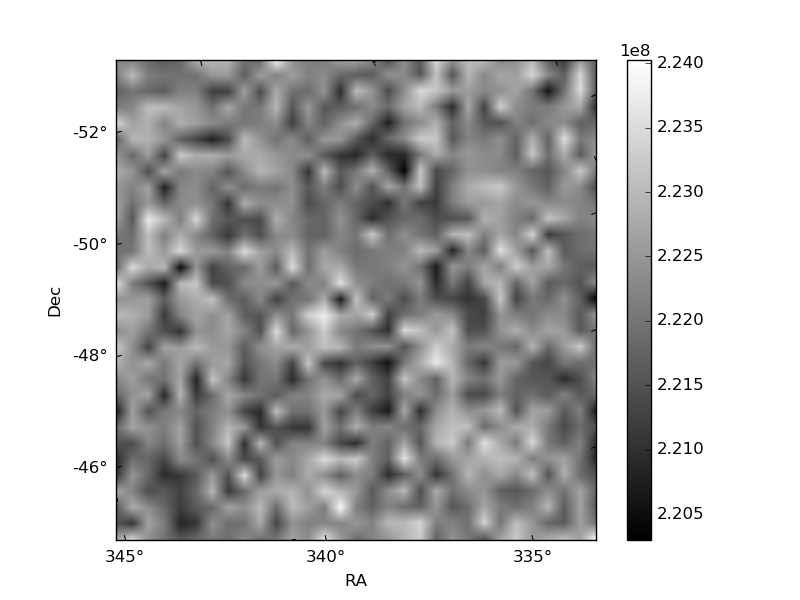
Histogram calculated using DETX and DETY for each event in the final _common_clean file
| Quadrant A | 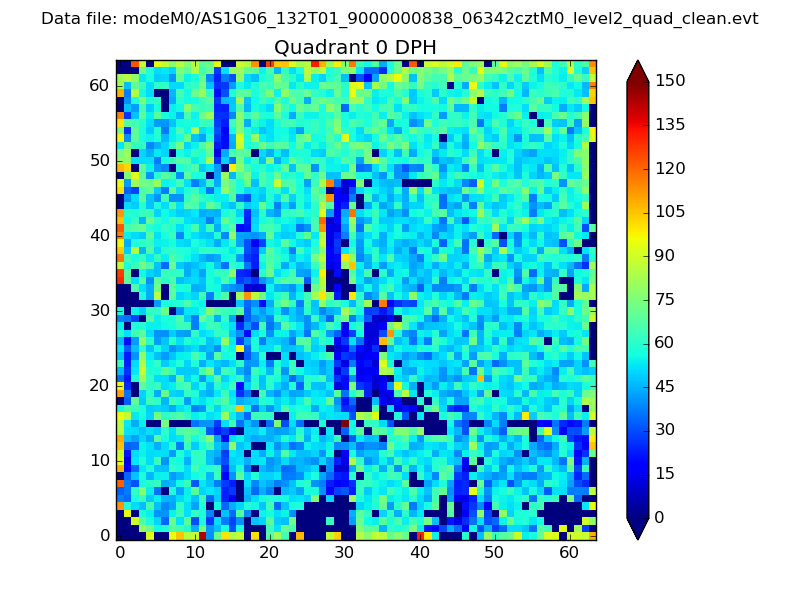 |
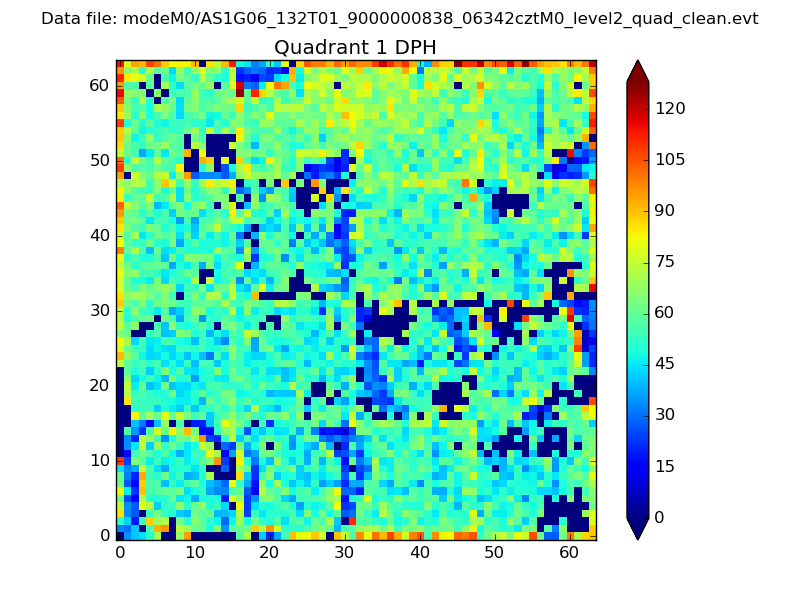 |
Quadrant B |
|---|---|---|---|
| Quadrant D |  |
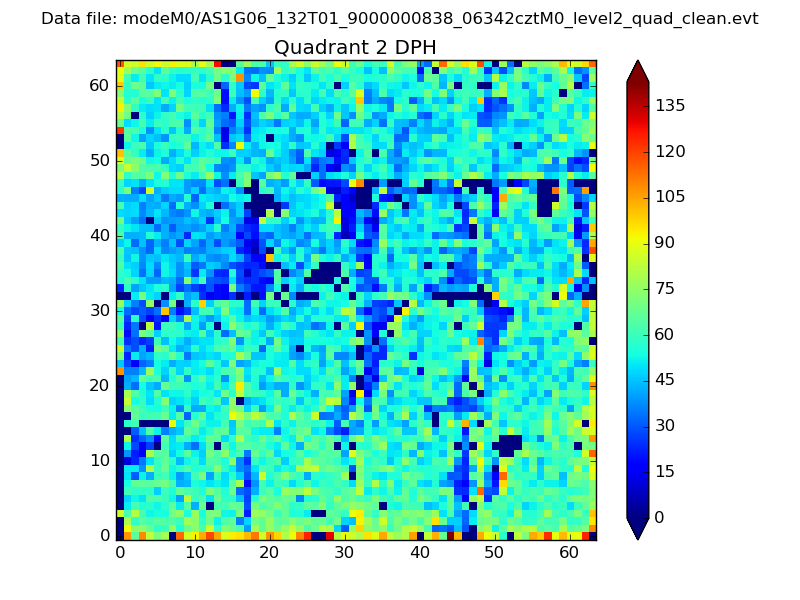 |
Quadrant C |
| Plot type | Count rate plots | Images |
|---|---|---|
| Comparison with Poisson distribution Blue bars denote a histogram of data divided into 1 sec bins. Red curve is a Poisson curve with rate = median count rate of data. |
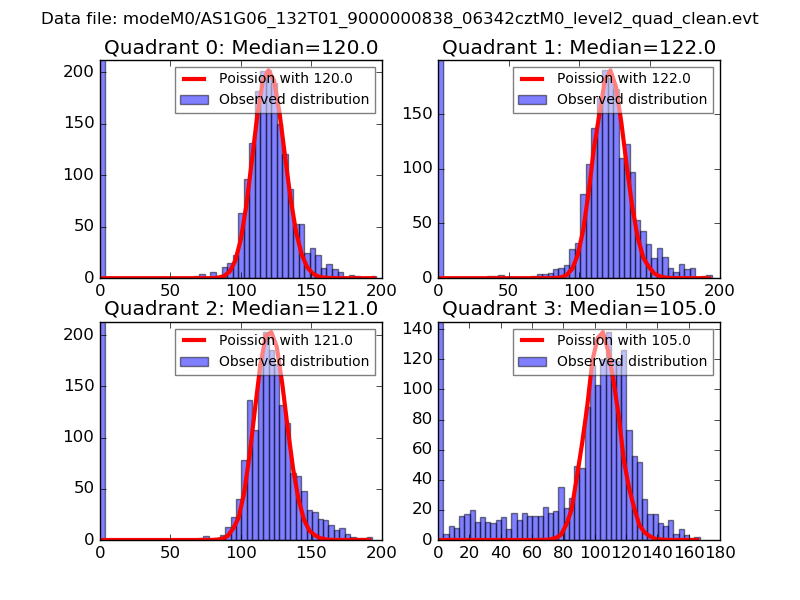 |
 |
| Quadrant-wise count rates Data is divided into 100 sec bins |
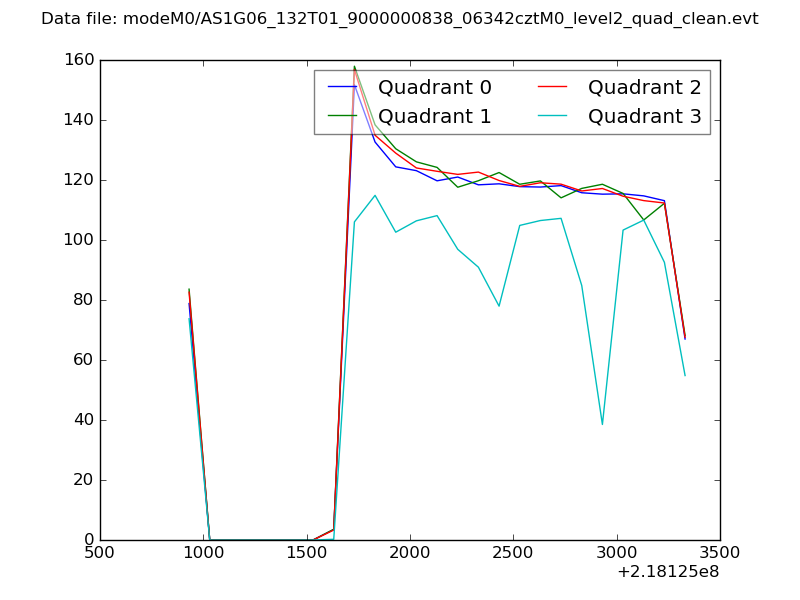 |
|
| Module-wise count rates for Quadrant A Data is divided into 100 sec bins |
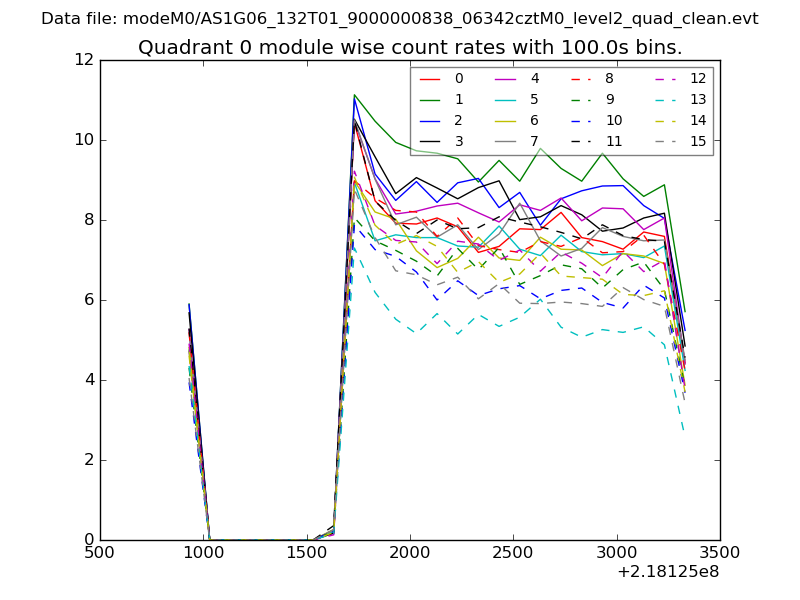 |
 |
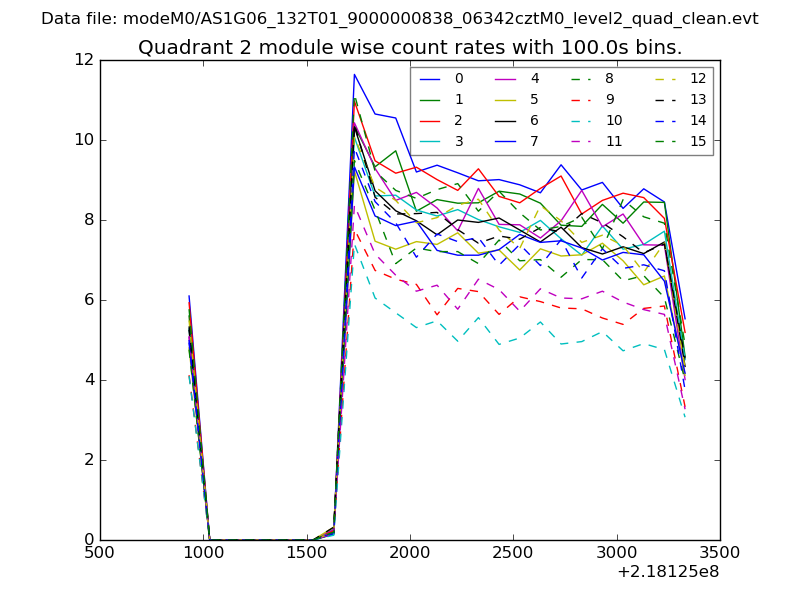
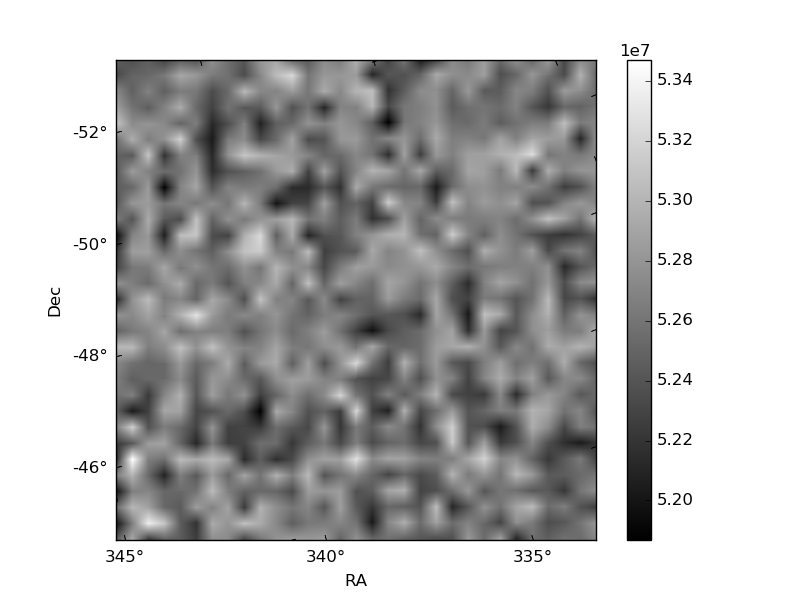
| Module-wise count rates for Quadrant B Data is divided into 100 sec bins |
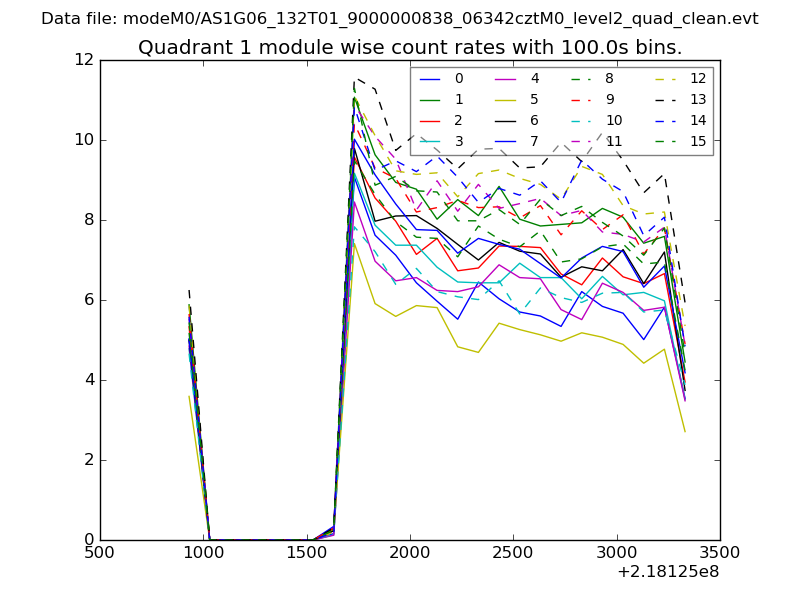 |
 |
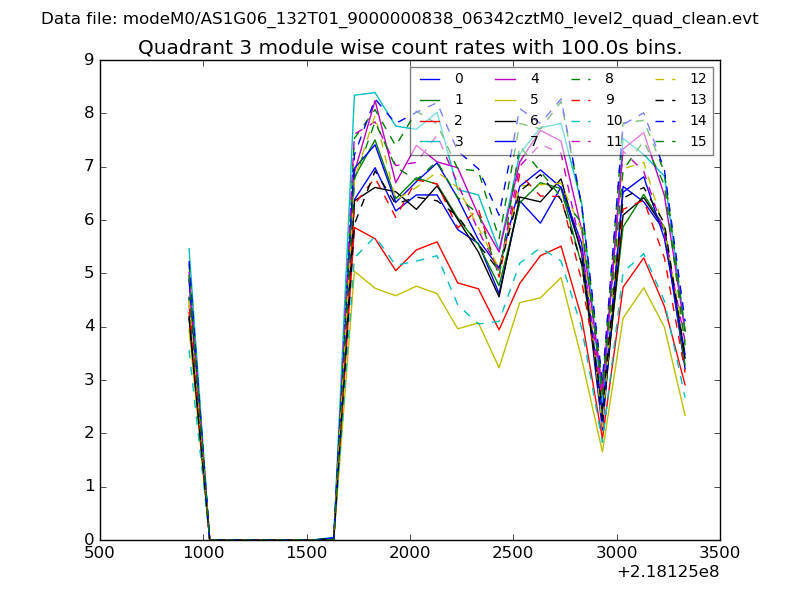
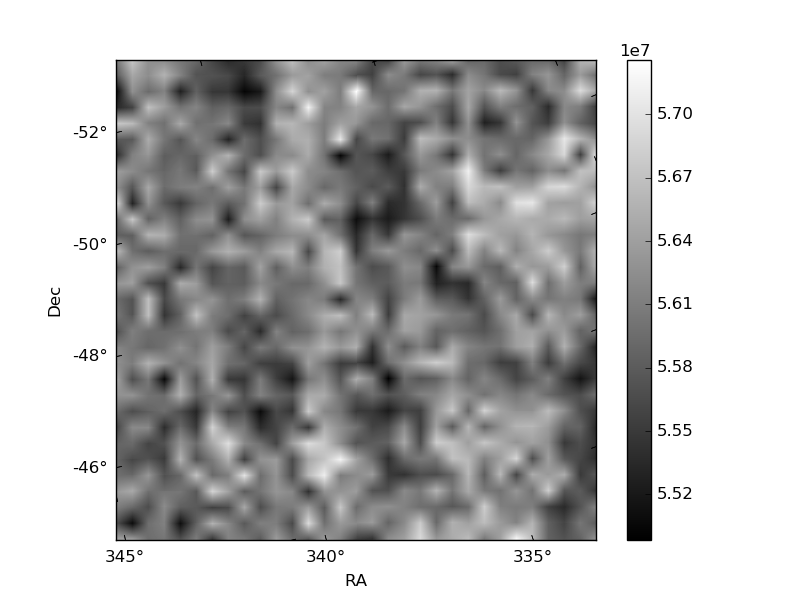
| Module-wise count rates for Quadrant C Data is divided into 100 sec bins |
 |
 |
| Module-wise count rates for Quadrant D Data is divided into 100 sec bins |
 |
 |
| Parameter | Plot |
|---|---|
| CZT HV Monitor | 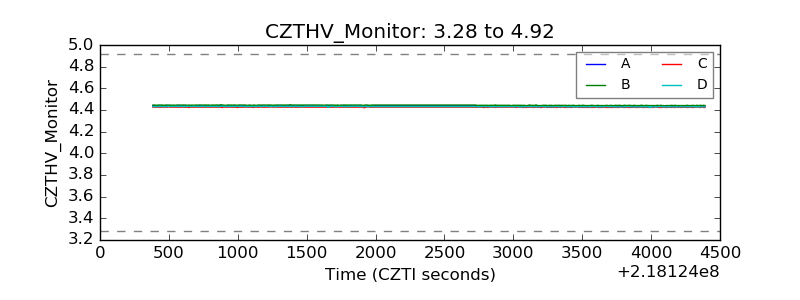 |
| D_VDD | 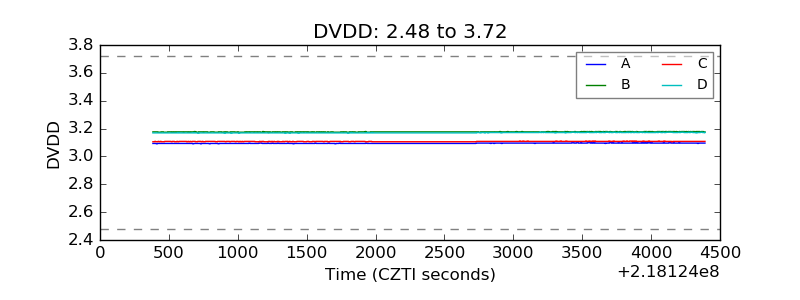 |
| Temperature 1 | 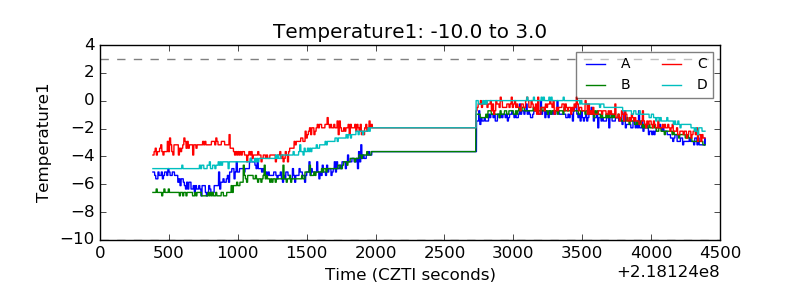 |
| Veto HV Monitor | 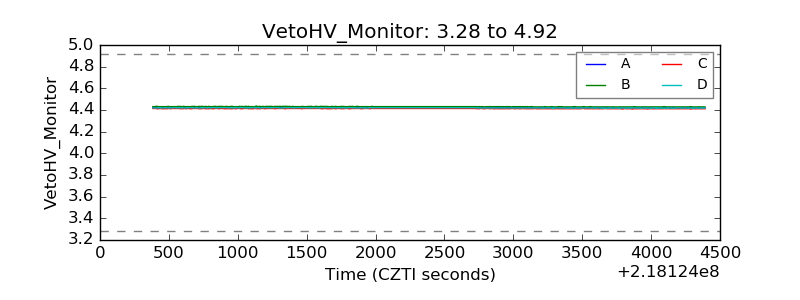 |
| Veto LLD | 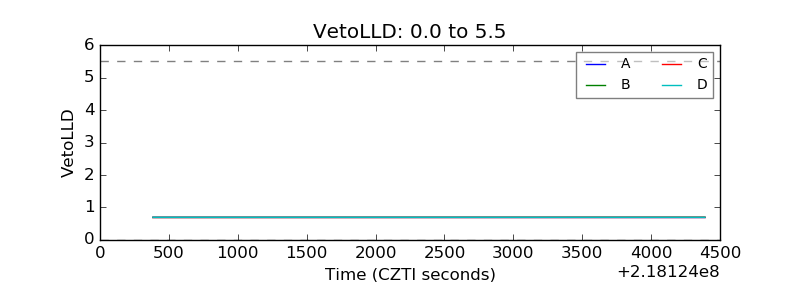 |
| Alpha Counter | 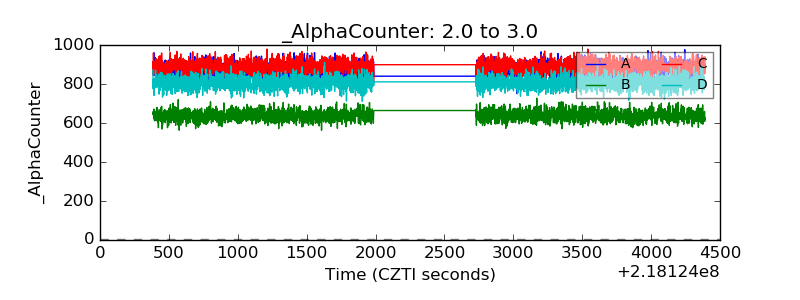 |
| _CPM_Rate | 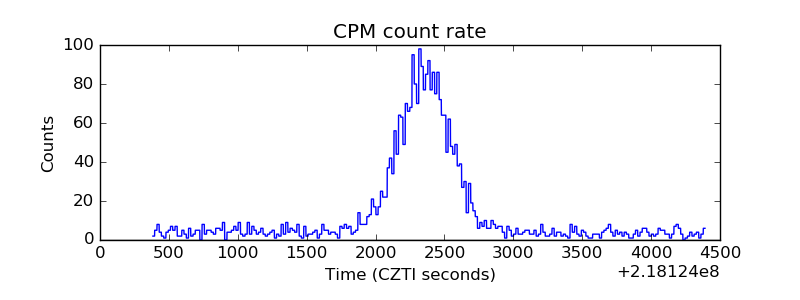 |
| CZT Counter | 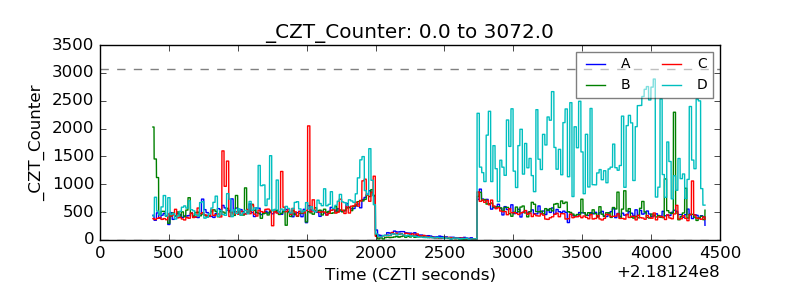 |
| +2.5 Volts monitor |  |
| +5 Volts monitor | 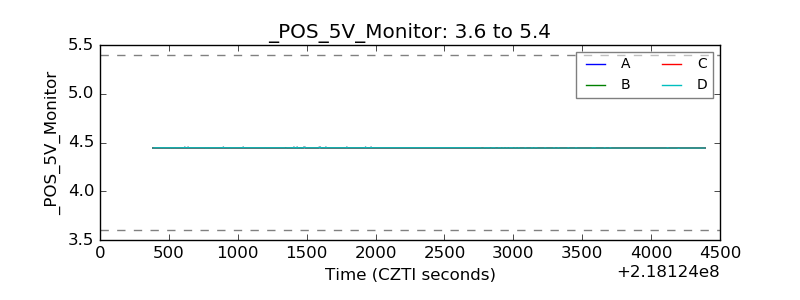 |
| _ROLL_ROT | 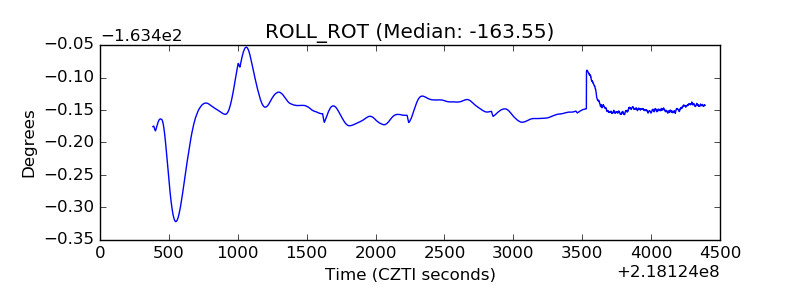 |
| _Roll_DEC | 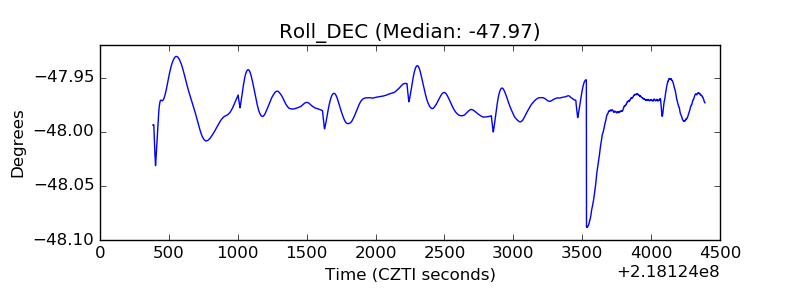 |
| _Roll_RA | 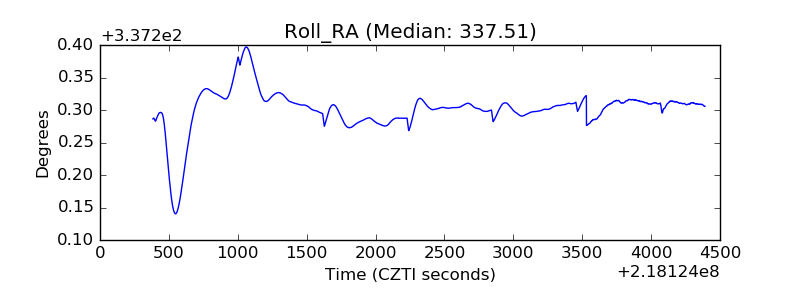 |
| Veto Counter | 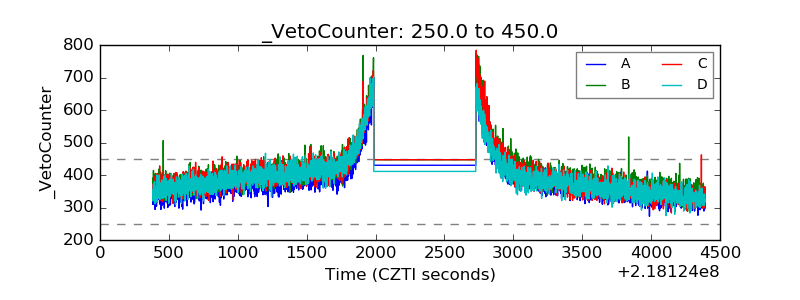 |