| Param | Original file | Final file |
|---|---|---|
| Filename | modeM0/AS1G06_132T01_9000000838_06343cztM0_level2.evt | modeM0/AS1G06_132T01_9000000838_06343cztM0_level2_quad_clean.evt |
| Size (bytes) | 633,142,080 | 92,439,360 |
| Size | 603.8 MB | 88.2 MB |
| Events in quadrant A | 3,409,443 | 606,935 |
| Events in quadrant B | 3,964,710 | 606,593 |
| Events in quadrant C | 3,314,258 | 604,325 |
| Events in quadrant D | 8,012,167 | 493,143 |
| Mode M9 | |||
|---|---|---|---|
| Quadrant | BADHDUFLAG | Total packets | Discarded packets |
| A | 0 | 4 | 0 |
| B | 0 | 4 | 0 |
| C | 0 | 4 | 0 |
| D | 0 | 4 | 0 |
| Mode M0 | |||
|---|---|---|---|
| Quadrant | BADHDUFLAG | Total packets | Discarded packets |
| A | 0 | 14893 | 2 |
| B | 0 | 16569 | 1 |
| C | 0 | 15130 | 1 |
| D | 0 | 28564 | 1 |
| Mode SS | |||
|---|---|---|---|
| Quadrant | BADHDUFLAG | Total packets | Discarded packets |
| A | 0 | 142 | 0 |
| B | 0 | 142 | 0 |
| C | 0 | 142 | 0 |
| D | 0 | 142 | 0 |
| Quadrant | Total seconds | Saturated seconds | Saturation percentage |
|---|---|---|---|
| A | 7000 | 31 | 0.442857% |
| B | 7000 | 227 | 3.242857% |
| C | 7000 | 54 | 0.771429% |
| D | 7000 | 1534 | 21.914286% |
Noise dominated data is calculated using 1-second bins in cleaned event files. If a bin has >2000 counts, and if more than 50% of those come from <1% of pixels, then it is considered to be noise-dominated and hence unusable.
| Quadrant | # 1 sec bins | Bins with >0 counts | Bins with >2000 counts | High rate bins dominated by noise | Noise dominated (total time) | Noise dominated (detector-on time) | Marked lightcurve |
|---|---|---|---|---|---|---|---|
| A | 7375 | 7001 | 2 | 2 | 0.03% | 0.03% | 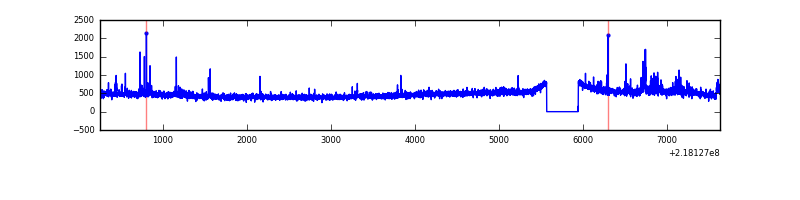 |
| B | 7375 | 7001 | 130 | 130 | 1.76% | 1.86% | 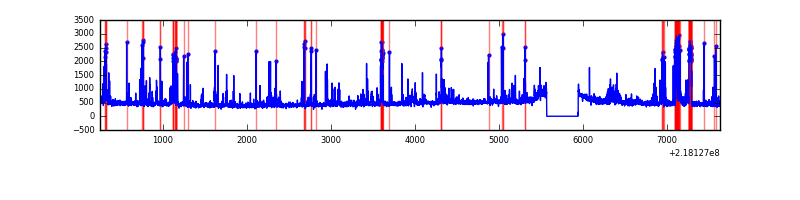 |
| C | 7375 | 7001 | 39 | 39 | 0.53% | 0.56% | 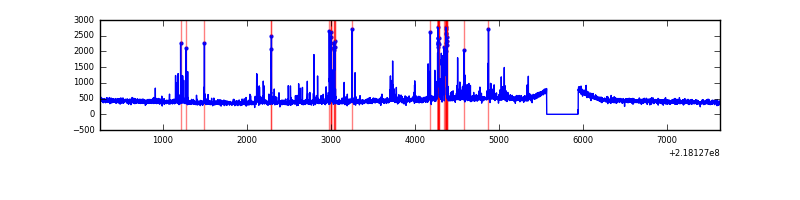 |
| D | 7375 | 7001 | 1462 | 1462 | 19.82% | 20.88% | 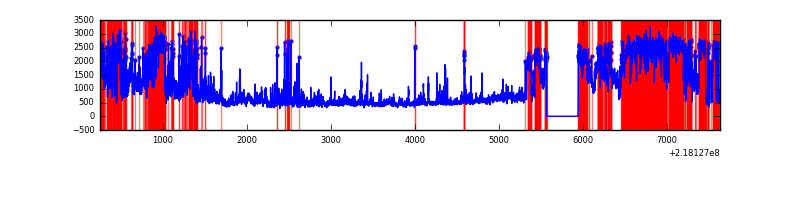 |
Top three noisy pixels from each quadrant. If the there are fewer than three noisy pixels in the level2.evt file, extra rows are filled as -1
| Pixel properties | Quadrant properties | ||||||
|---|---|---|---|---|---|---|---|
| Quadrant | DetID | PixID | Counts | Sigma | Mean | Median | Sigma |
| A | 15 | 236 | 242129 | 1486.01 | 794 | 776 | 162.4 |
| A | 3 | 1 | 38783 | 234.01 | 794 | 776 | 162.4 |
| A | 13 | 251 | 32401 | 194.72 | 794 | 776 | 162.4 |
| B | 3 | 64 | 456341 | 2960.48 | 796 | 775 | 153.9 |
| B | 0 | 219 | 280567 | 1818.22 | 796 | 775 | 153.9 |
| B | 4 | 81 | 33392 | 211.96 | 796 | 775 | 153.9 |
| C | 4 | 254 | 323267 | 1827.57 | 761 | 765 | 176.5 |
| C | 9 | 54 | 7484 | 38.07 | 761 | 765 | 176.5 |
| C | 1 | 16 | 6601 | 33.07 | 761 | 765 | 176.5 |
| D | 12 | 220 | 1553340 | 9121.55 | 696 | 673 | 170.2 |
| D | 12 | 221 | 1522125 | 8938.17 | 696 | 673 | 170.2 |
| D | 1 | 239 | 1264249 | 7423.21 | 696 | 673 | 170.2 |
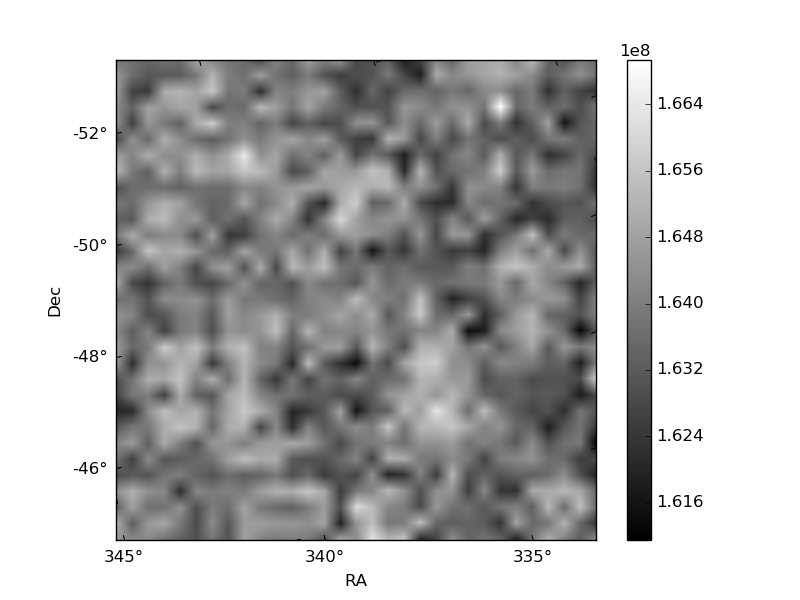
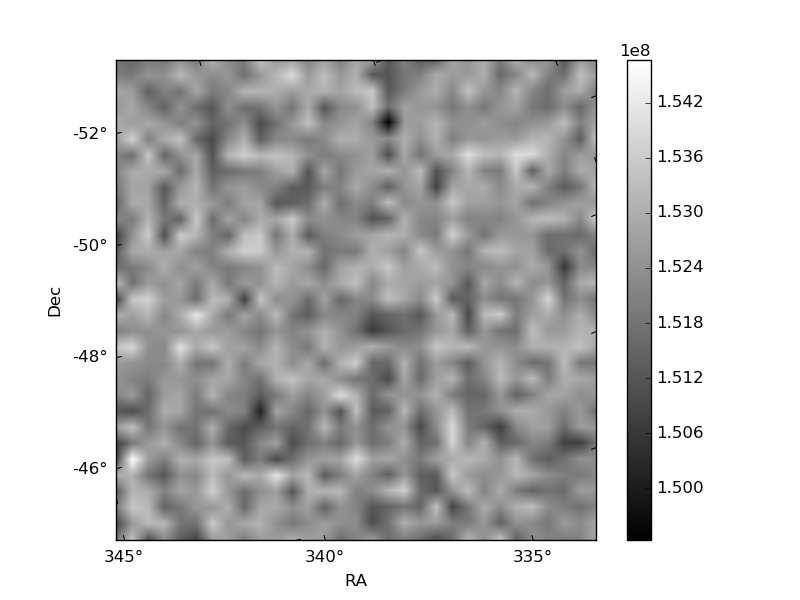
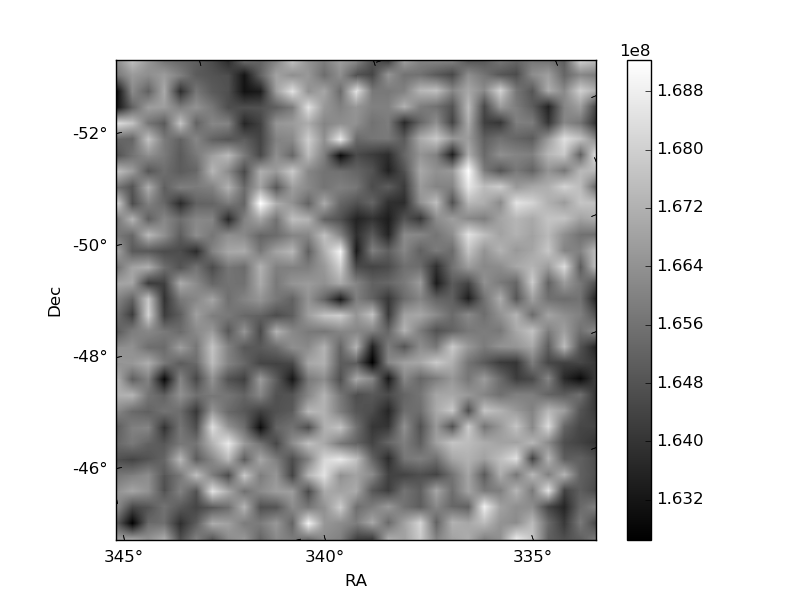
Histogram calculated using DETX and DETY for each event in the final _common_clean file
| Quadrant A | 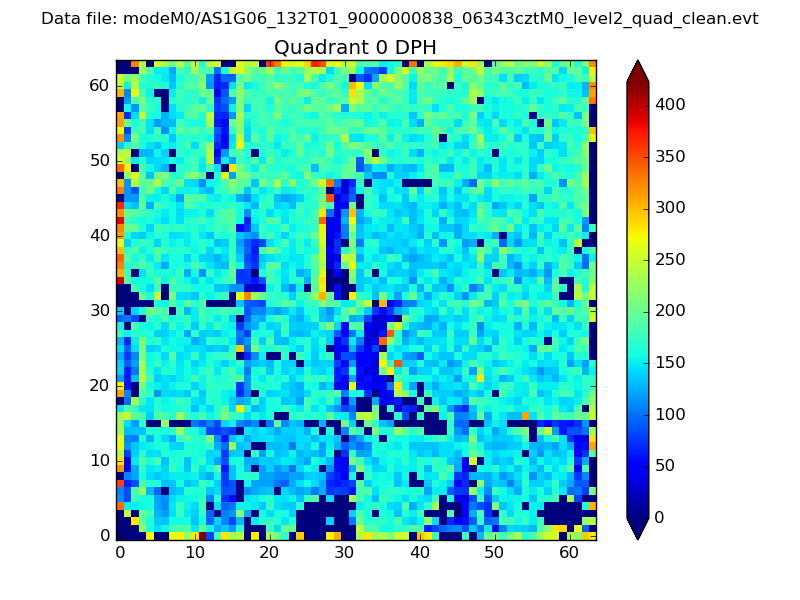 |
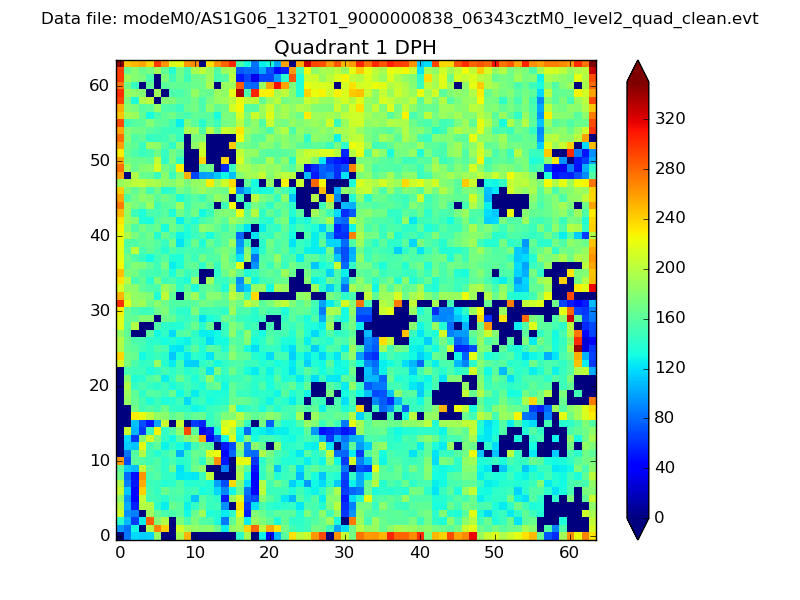 |
Quadrant B |
|---|---|---|---|
| Quadrant D | 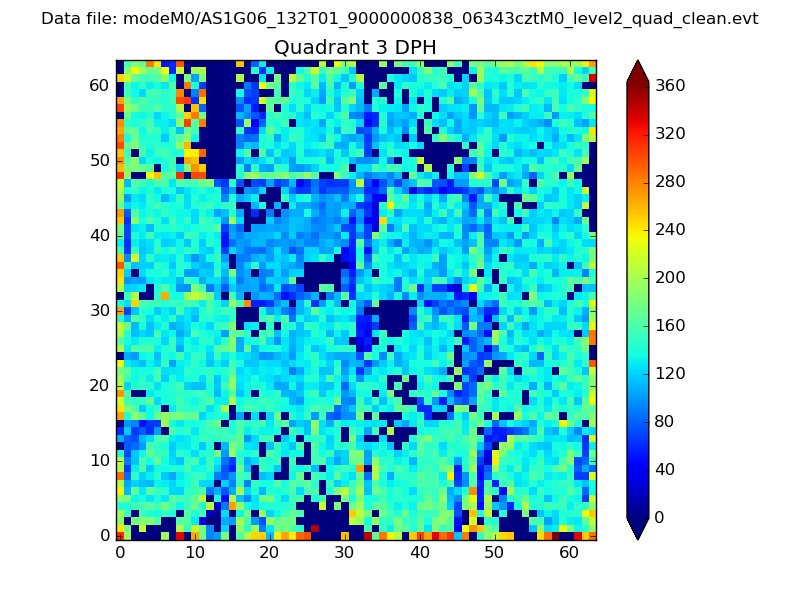 |
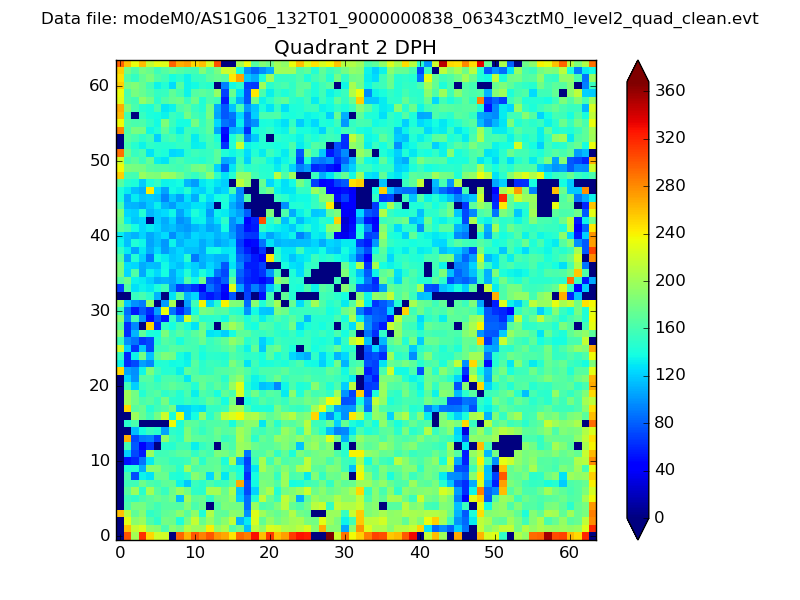 |
Quadrant C |
| Plot type | Count rate plots | Images |
|---|---|---|
| Comparison with Poisson distribution Blue bars denote a histogram of data divided into 1 sec bins. Red curve is a Poisson curve with rate = median count rate of data. |
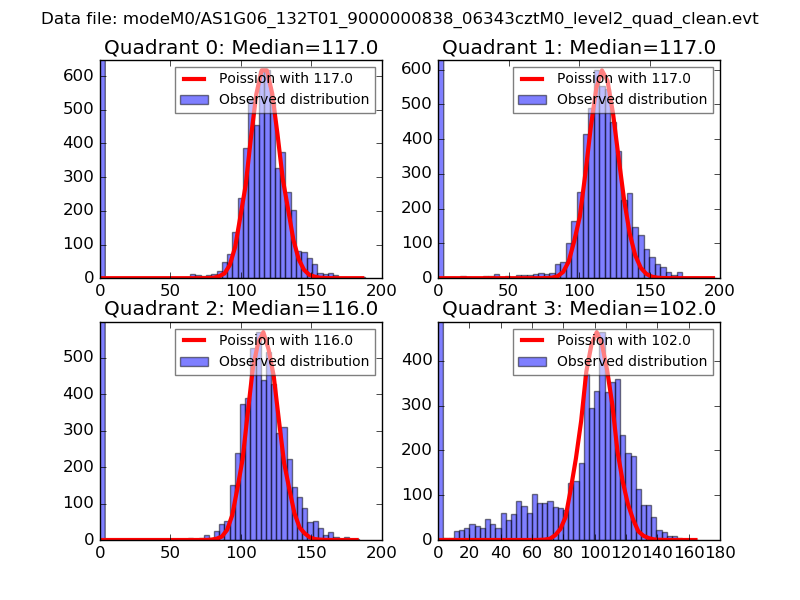 |
 |
| Quadrant-wise count rates Data is divided into 100 sec bins |
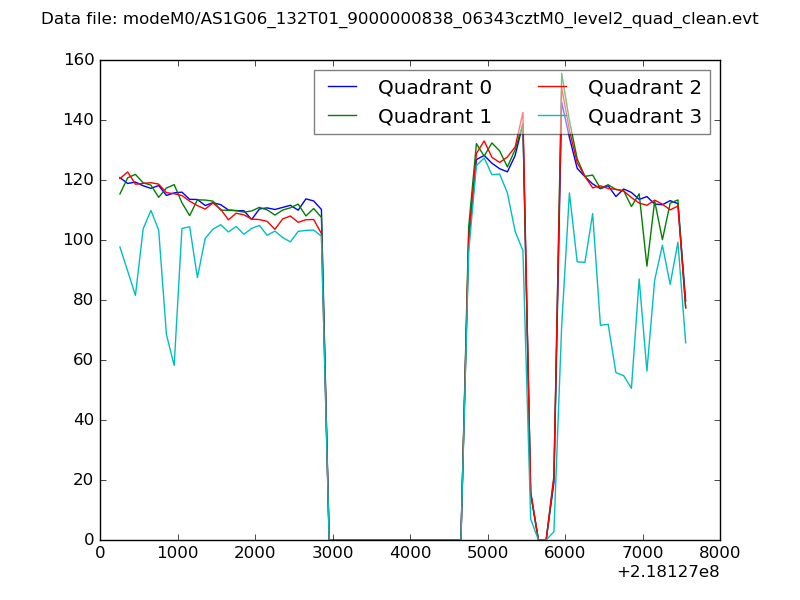 |
|
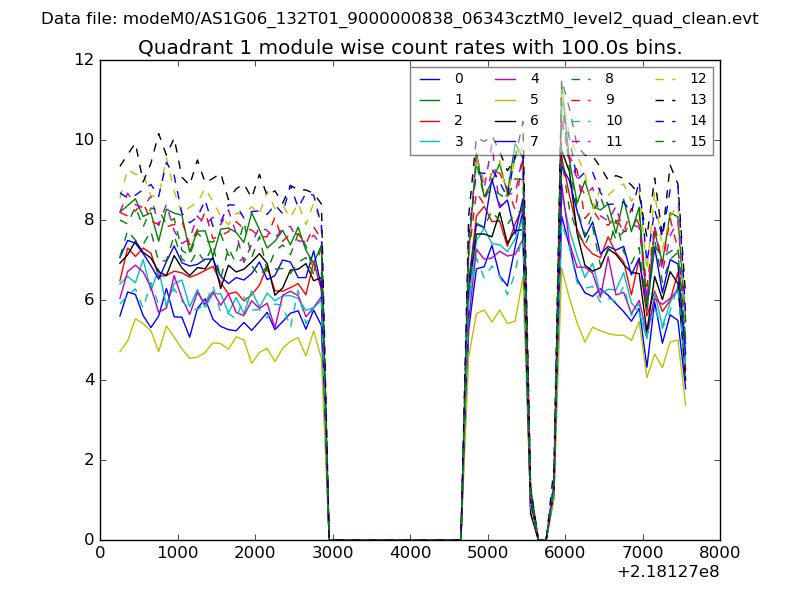
| Module-wise count rates for Quadrant A Data is divided into 100 sec bins |
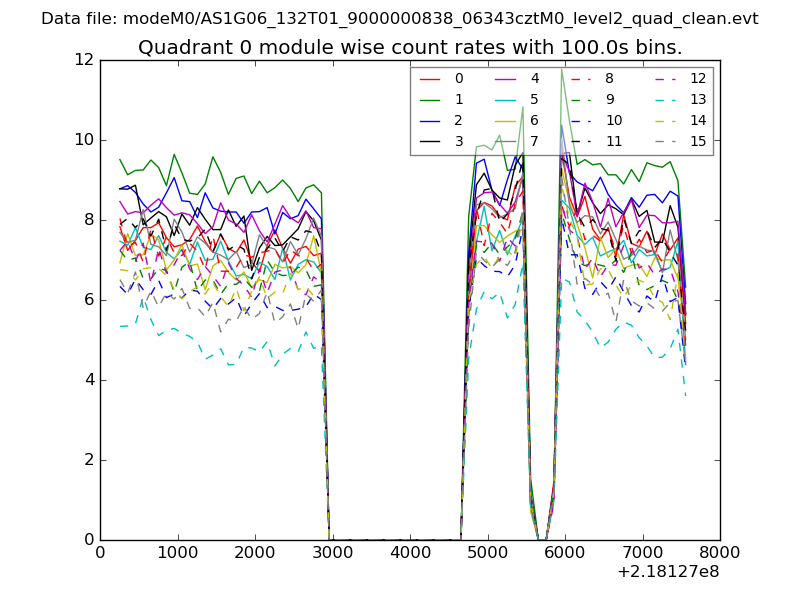 |
 |
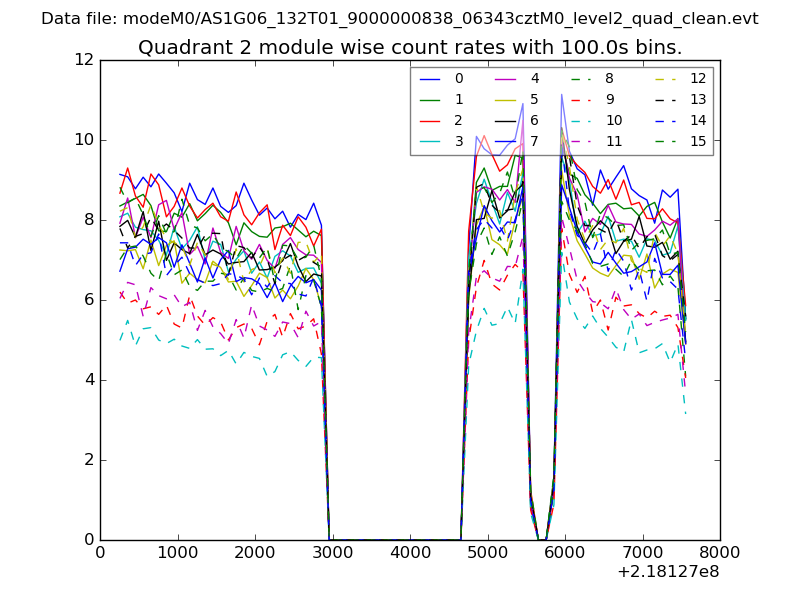
| Module-wise count rates for Quadrant B Data is divided into 100 sec bins |
 |
 |
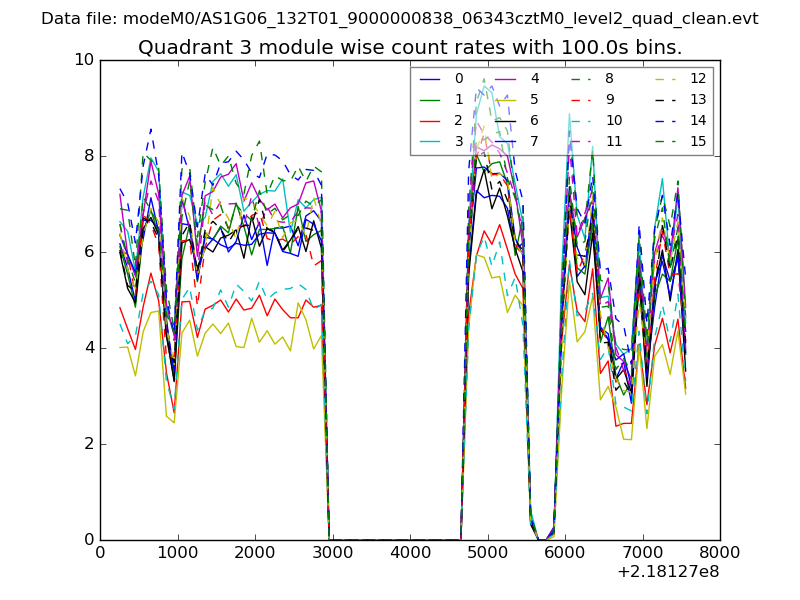
| Module-wise count rates for Quadrant C Data is divided into 100 sec bins |
 |
 |
| Module-wise count rates for Quadrant D Data is divided into 100 sec bins |
 |
 |
| Parameter | Plot |
|---|---|
| CZT HV Monitor |  |
| D_VDD | 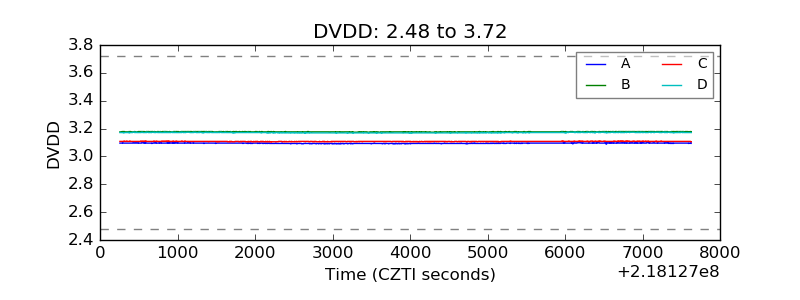 |
| Temperature 1 | 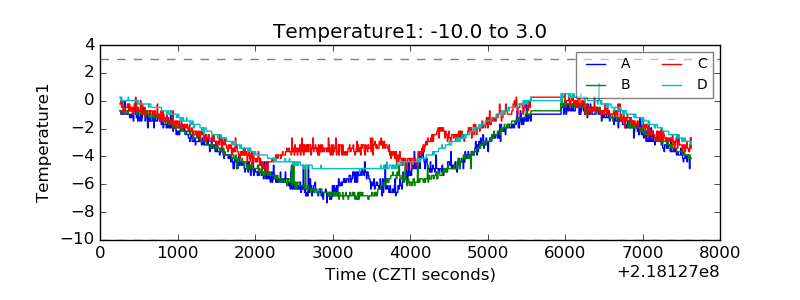 |
| Veto HV Monitor | 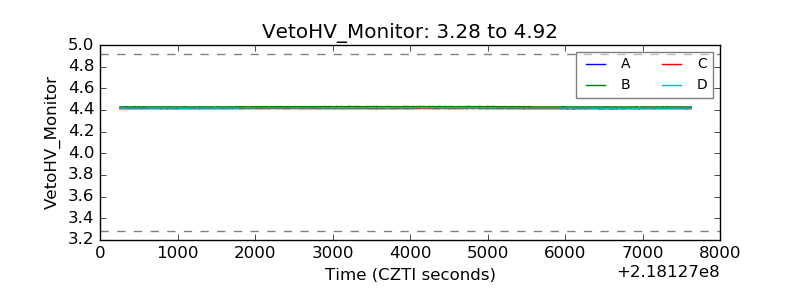 |
| Veto LLD | 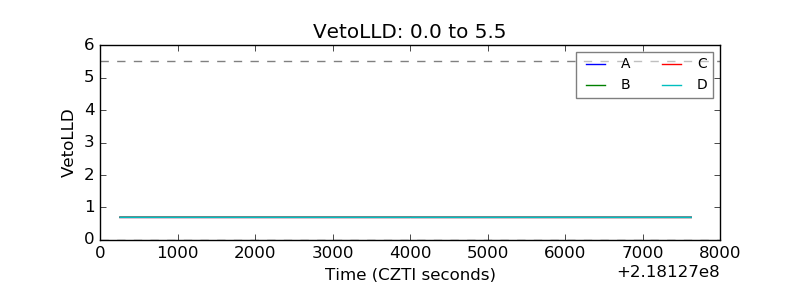 |
| Alpha Counter |  |
| _CPM_Rate | 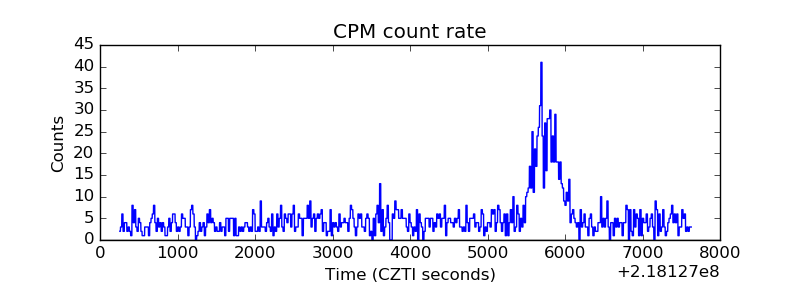 |
| CZT Counter |  |
| +2.5 Volts monitor |  |
| +5 Volts monitor |  |
| _ROLL_ROT | 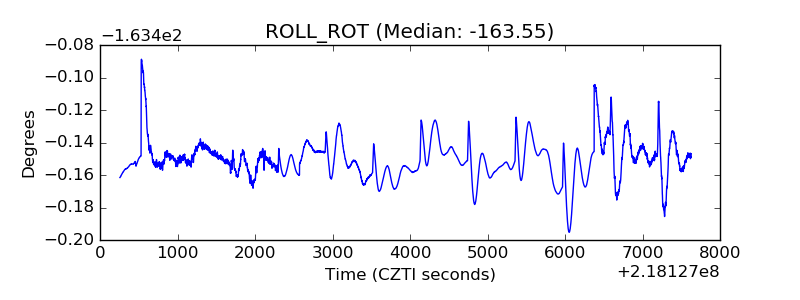 |
| _Roll_DEC | 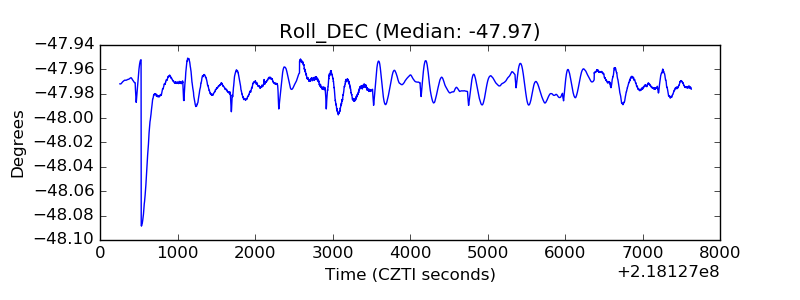 |
| _Roll_RA | 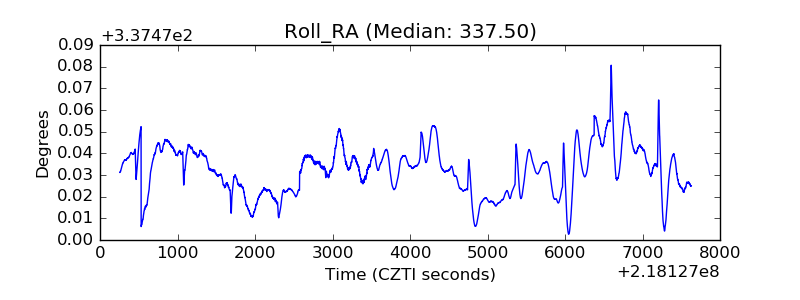 |
| Veto Counter |  |