| Param | Original file | Final file |
|---|---|---|
| Filename | modeM0/AS1G06_132T01_9000000838_06344cztM0_level2.evt | modeM0/AS1G06_132T01_9000000838_06344cztM0_level2_quad_clean.evt |
| Size (bytes) | 654,621,120 | 95,984,640 |
| Size | 624.3 MB | 91.5 MB |
| Events in quadrant A | 3,427,972 | 629,283 |
| Events in quadrant B | 4,685,089 | 610,151 |
| Events in quadrant C | 3,082,695 | 627,377 |
| Events in quadrant D | 8,143,297 | 539,320 |
| Mode M9 | |||
|---|---|---|---|
| Quadrant | BADHDUFLAG | Total packets | Discarded packets |
| A | 0 | 3 | 0 |
| B | 0 | 3 | 0 |
| C | 0 | 3 | 0 |
| D | 0 | 3 | 0 |
| Mode M0 | |||
|---|---|---|---|
| Quadrant | BADHDUFLAG | Total packets | Discarded packets |
| A | 0 | 15198 | 2 |
| B | 0 | 18742 | 1 |
| C | 0 | 14649 | 1 |
| D | 0 | 29202 | 1 |
| Mode SS | |||
|---|---|---|---|
| Quadrant | BADHDUFLAG | Total packets | Discarded packets |
| A | 0 | 146 | 0 |
| B | 0 | 146 | 0 |
| C | 0 | 146 | 0 |
| D | 0 | 146 | 0 |
| Quadrant | Total seconds | Saturated seconds | Saturation percentage |
|---|---|---|---|
| A | 7195 | 56 | 0.778318% |
| B | 7195 | 476 | 6.615705% |
| C | 7195 | 34 | 0.472550% |
| D | 7195 | 1132 | 15.733148% |
Noise dominated data is calculated using 1-second bins in cleaned event files. If a bin has >2000 counts, and if more than 50% of those come from <1% of pixels, then it is considered to be noise-dominated and hence unusable.
| Quadrant | # 1 sec bins | Bins with >0 counts | Bins with >2000 counts | High rate bins dominated by noise | Noise dominated (total time) | Noise dominated (detector-on time) | Marked lightcurve |
|---|---|---|---|---|---|---|---|
| A | 7355 | 7198 | 10 | 10 | 0.14% | 0.14% | 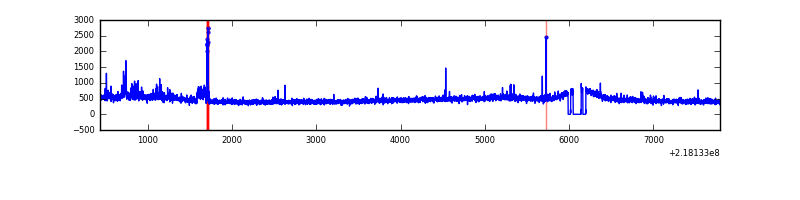 |
| B | 7355 | 7198 | 278 | 278 | 3.78% | 3.86% | 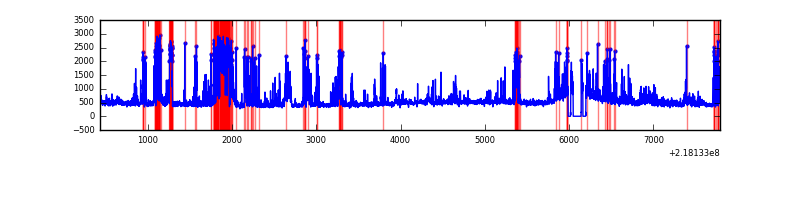 |
| C | 7355 | 7198 | 1 | 1 | 0.01% | 0.01% | 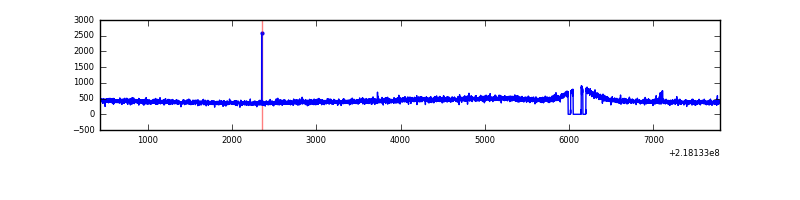 |
| D | 7355 | 7198 | 1239 | 1239 | 16.85% | 17.21% | 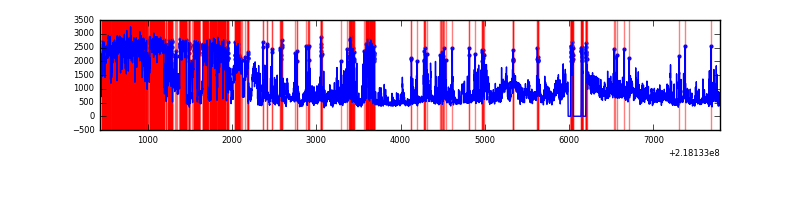 |
Top three noisy pixels from each quadrant. If the there are fewer than three noisy pixels in the level2.evt file, extra rows are filled as -1
| Pixel properties | Quadrant properties | ||||||
|---|---|---|---|---|---|---|---|
| Quadrant | DetID | PixID | Counts | Sigma | Mean | Median | Sigma |
| A | 15 | 236 | 180584 | 1082.64 | 815 | 798 | 166.1 |
| A | 13 | 251 | 49502 | 293.29 | 815 | 798 | 166.1 |
| A | 3 | 1 | 27401 | 160.2 | 815 | 798 | 166.1 |
| B | 3 | 64 | 1182641 | 7634.56 | 802 | 782 | 154.8 |
| B | 0 | 219 | 153824 | 988.62 | 802 | 782 | 154.8 |
| B | 15 | 204 | 85166 | 545.1 | 802 | 782 | 154.8 |
| C | 9 | 54 | 7476 | 36.6 | 785 | 788 | 182.7 |
| C | 13 | 61 | 6327 | 30.31 | 785 | 788 | 182.7 |
| C | 1 | 16 | 5438 | 25.45 | 785 | 788 | 182.7 |
| D | 1 | 239 | 1836166 | 10054.6 | 741 | 717 | 182.5 |
| D | 12 | 220 | 1522618 | 8336.98 | 741 | 717 | 182.5 |
| D | 12 | 221 | 1137043 | 6224.8 | 741 | 717 | 182.5 |
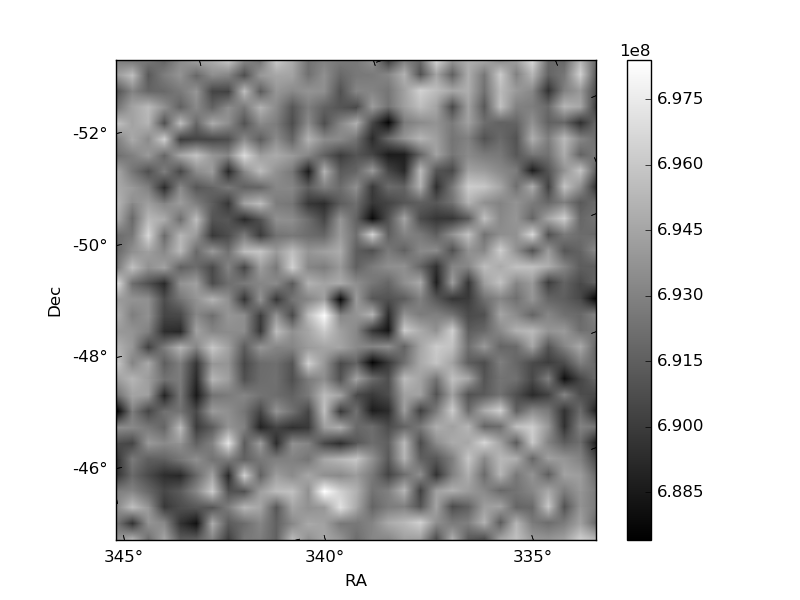
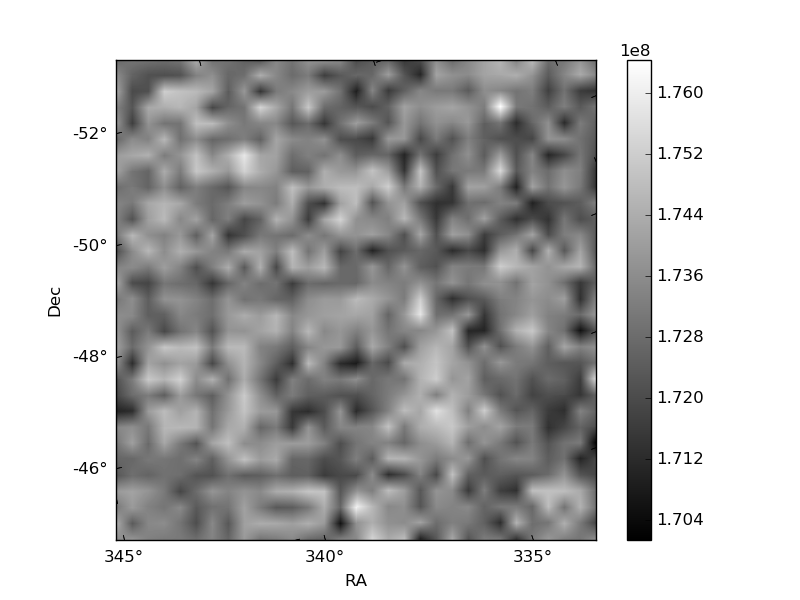
Histogram calculated using DETX and DETY for each event in the final _common_clean file
| Quadrant A | 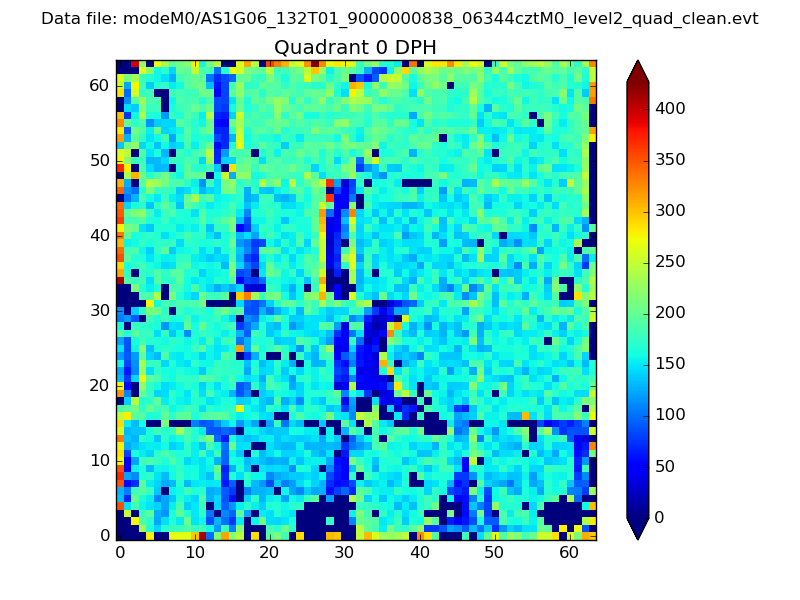 |
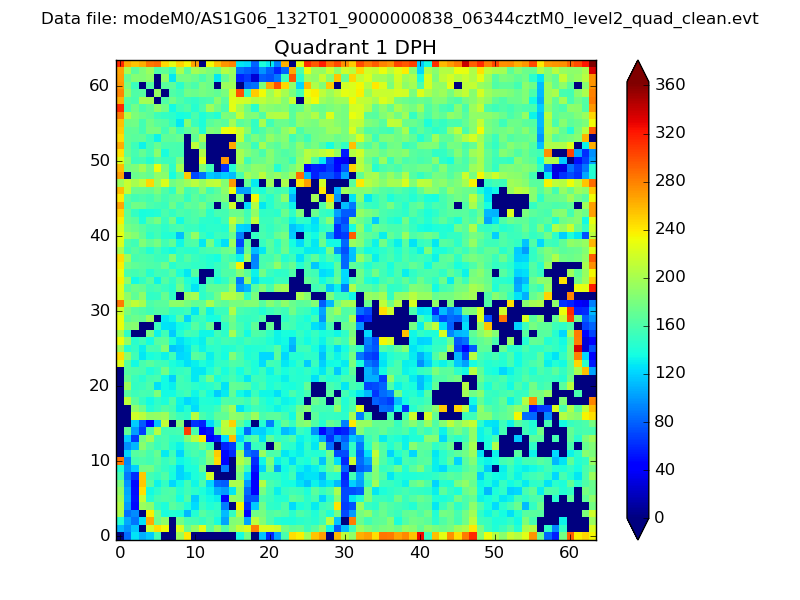 |
Quadrant B |
|---|---|---|---|
| Quadrant D | 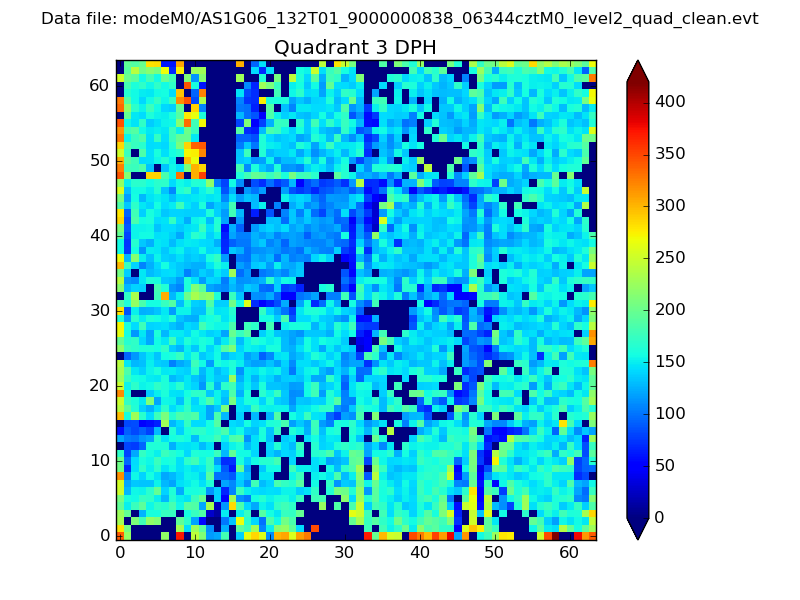 |
 |
Quadrant C |
| Plot type | Count rate plots | Images |
|---|---|---|
| Comparison with Poisson distribution Blue bars denote a histogram of data divided into 1 sec bins. Red curve is a Poisson curve with rate = median count rate of data. |
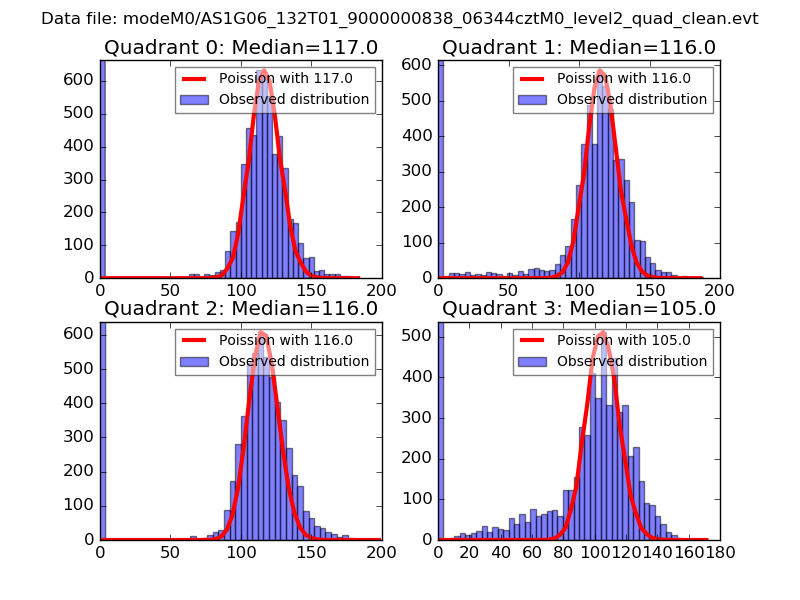 |
 |
| Quadrant-wise count rates Data is divided into 100 sec bins |
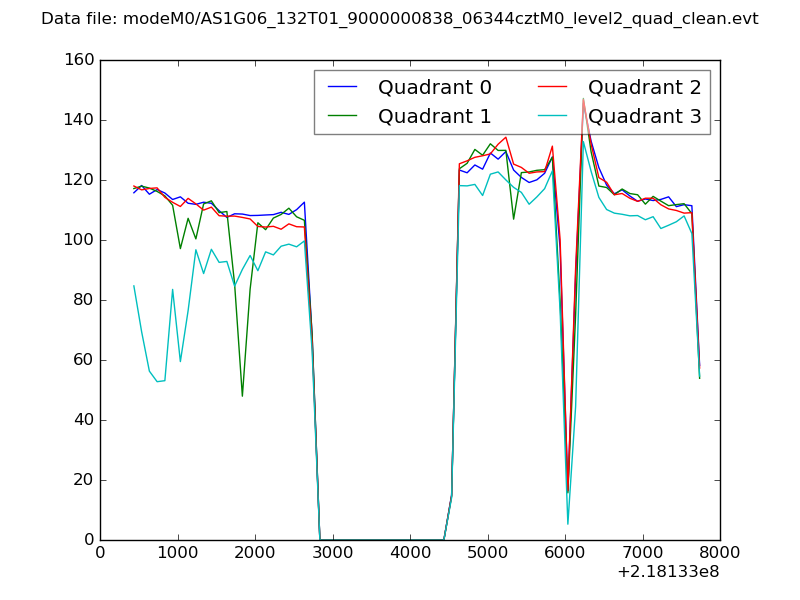 |
|
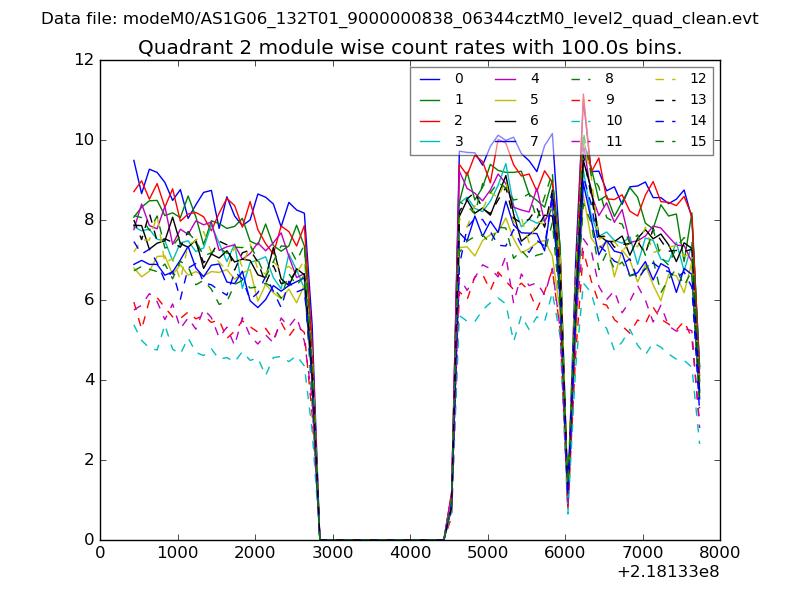
| Module-wise count rates for Quadrant A Data is divided into 100 sec bins |
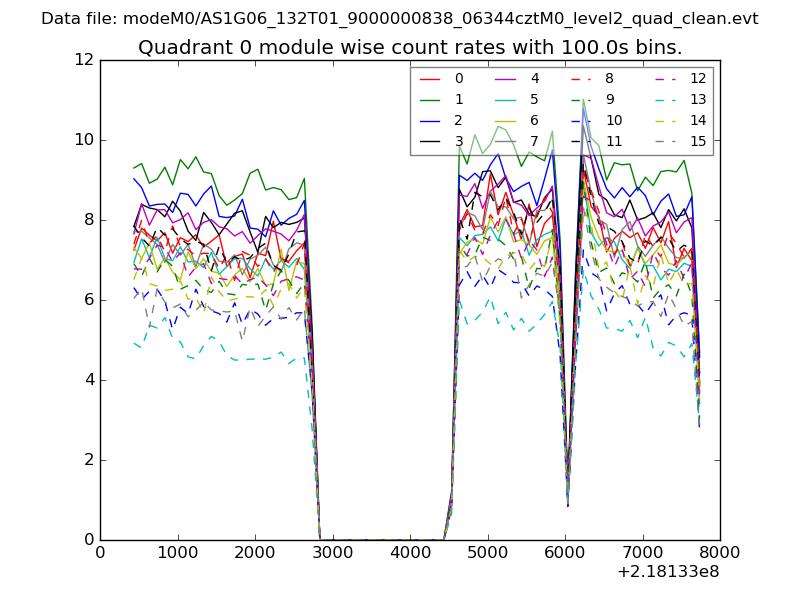 |
 |
| Module-wise count rates for Quadrant B Data is divided into 100 sec bins |
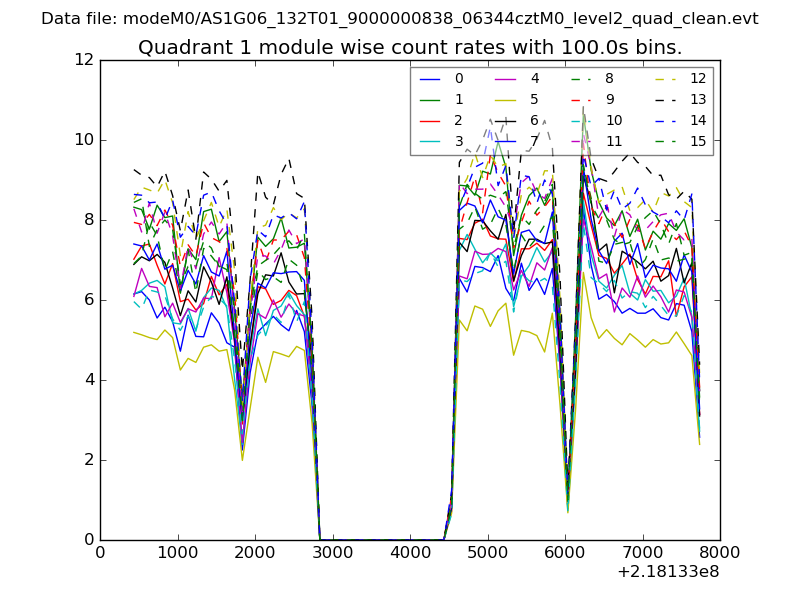 |
 |
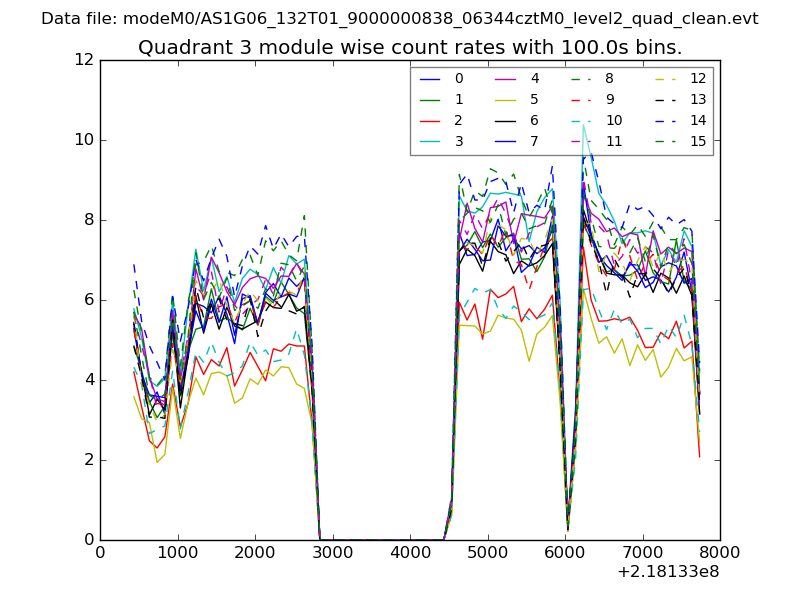
| Module-wise count rates for Quadrant C Data is divided into 100 sec bins |
 |
 |
| Module-wise count rates for Quadrant D Data is divided into 100 sec bins |
 |
 |
| Parameter | Plot |
|---|---|
| CZT HV Monitor | 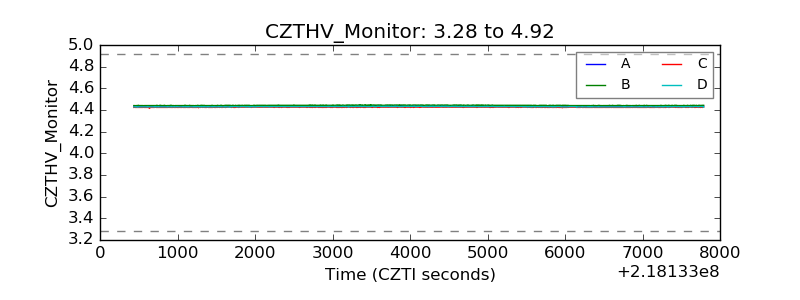 |
| D_VDD | 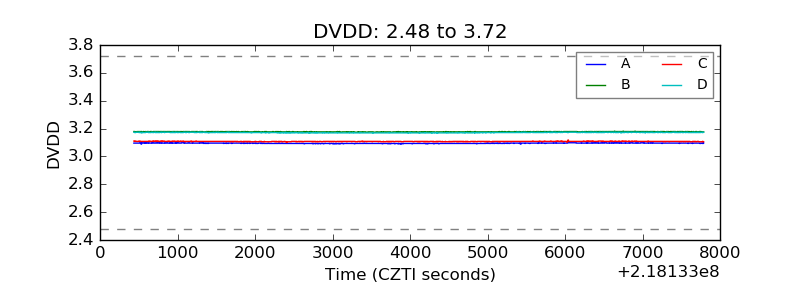 |
| Temperature 1 | 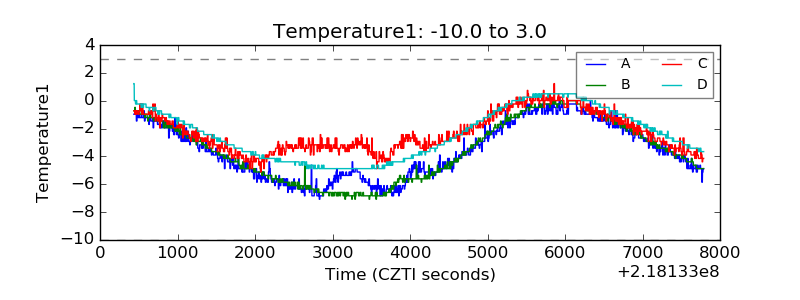 |
| Veto HV Monitor | 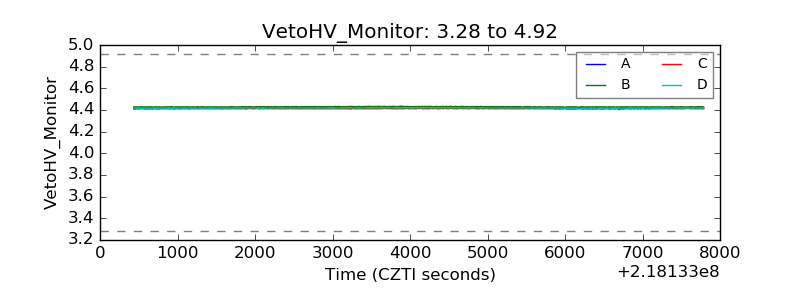 |
| Veto LLD | 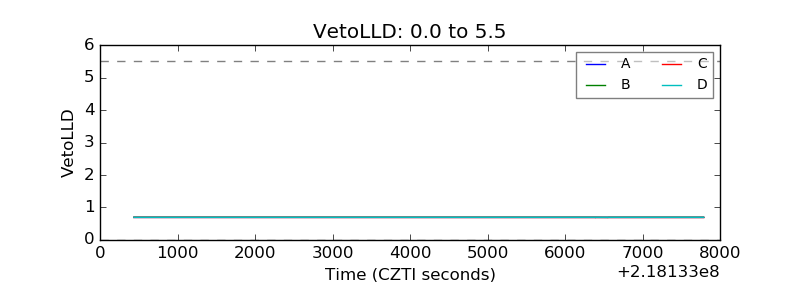 |
| Alpha Counter | 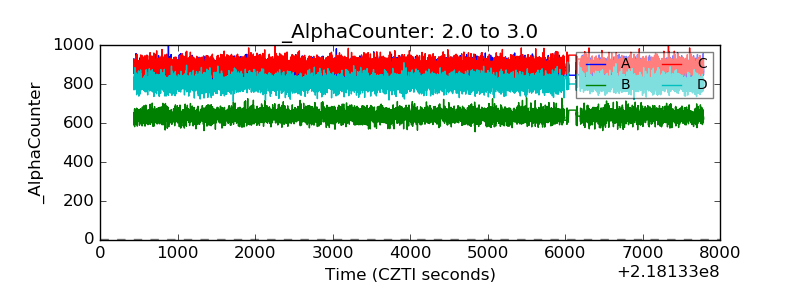 |
| _CPM_Rate | 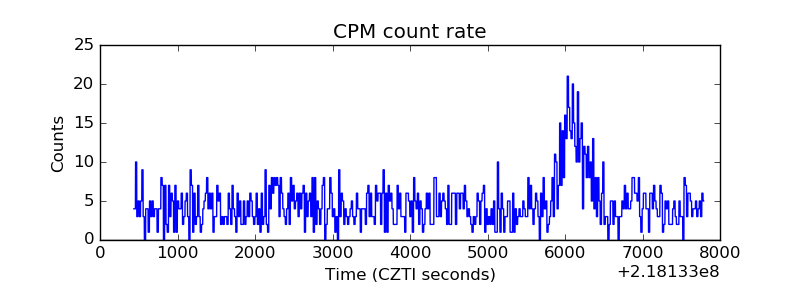 |
| CZT Counter | 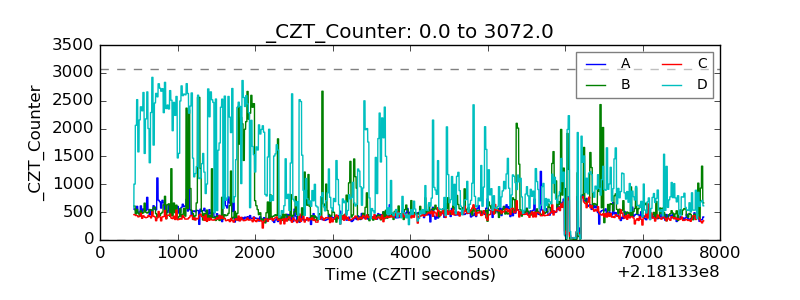 |
| +2.5 Volts monitor | 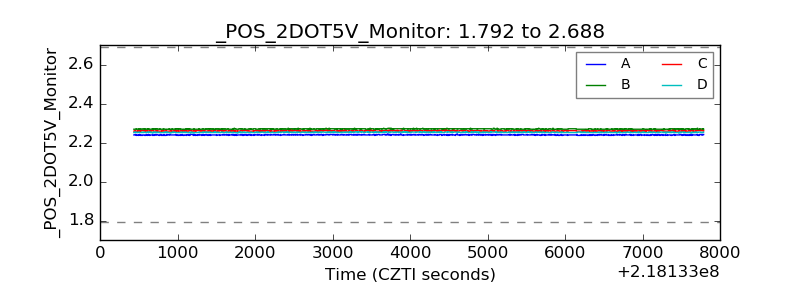 |
| +5 Volts monitor |  |
| _ROLL_ROT | 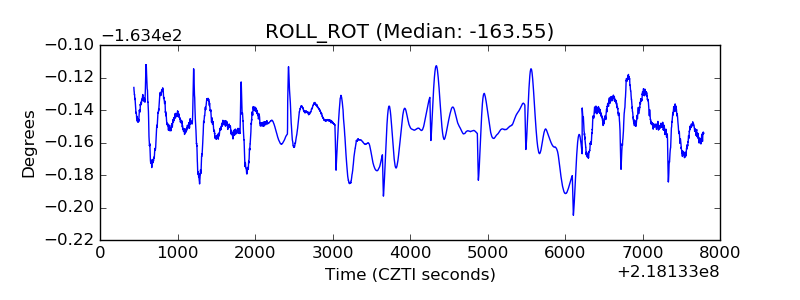 |
| _Roll_DEC | 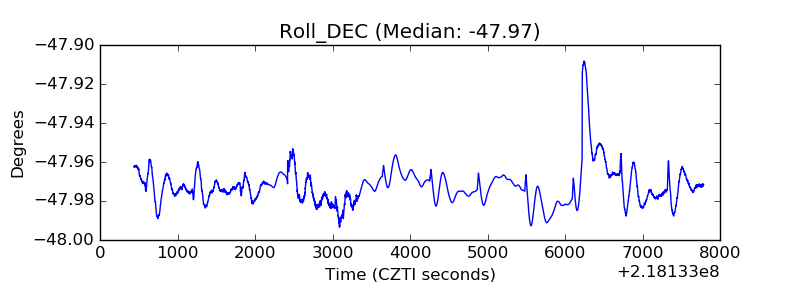 |
| _Roll_RA | 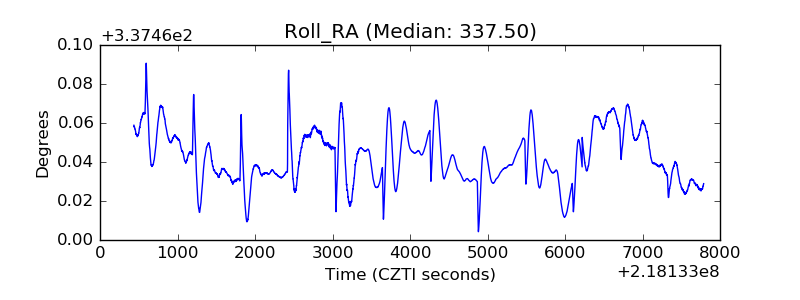 |
| Veto Counter | 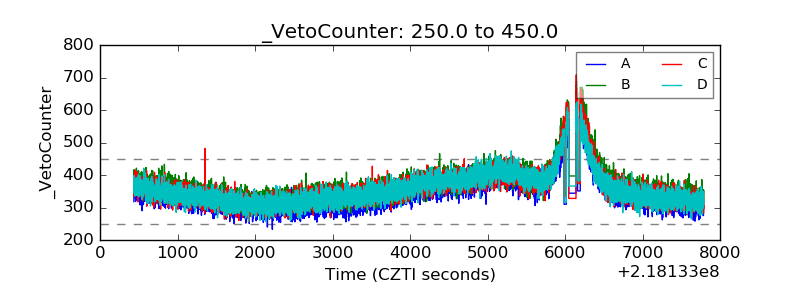 |