| Param | Original file | Final file |
|---|---|---|
| Filename | modeM0/AS1G06_132T01_9000000838_06345cztM0_level2.evt | modeM0/AS1G06_132T01_9000000838_06345cztM0_level2_quad_clean.evt |
| Size (bytes) | 610,194,240 | 102,366,720 |
| Size | 581.9 MB | 97.6 MB |
| Events in quadrant A | 3,433,471 | 666,645 |
| Events in quadrant B | 5,064,679 | 633,536 |
| Events in quadrant C | 3,220,866 | 660,053 |
| Events in quadrant D | 6,248,272 | 613,232 |
| Mode M9 | |||
|---|---|---|---|
| Quadrant | BADHDUFLAG | Total packets | Discarded packets |
| A | 0 | 3 | 0 |
| B | 0 | 3 | 0 |
| C | 0 | 3 | 0 |
| D | 0 | 3 | 0 |
| Mode M0 | |||
|---|---|---|---|
| Quadrant | BADHDUFLAG | Total packets | Discarded packets |
| A | 0 | 15590 | 2 |
| B | 0 | 20268 | 1 |
| C | 0 | 15324 | 1 |
| D | 0 | 23795 | 1 |
| Mode SS | |||
|---|---|---|---|
| Quadrant | BADHDUFLAG | Total packets | Discarded packets |
| A | 0 | 156 | 0 |
| B | 0 | 156 | 0 |
| C | 0 | 156 | 0 |
| D | 0 | 156 | 0 |
| Quadrant | Total seconds | Saturated seconds | Saturation percentage |
|---|---|---|---|
| A | 7555 | 30 | 0.397088% |
| B | 7555 | 611 | 8.087359% |
| C | 7555 | 24 | 0.317670% |
| D | 7555 | 413 | 5.466578% |
Noise dominated data is calculated using 1-second bins in cleaned event files. If a bin has >2000 counts, and if more than 50% of those come from <1% of pixels, then it is considered to be noise-dominated and hence unusable.
| Quadrant | # 1 sec bins | Bins with >0 counts | Bins with >2000 counts | High rate bins dominated by noise | Noise dominated (total time) | Noise dominated (detector-on time) | Marked lightcurve |
|---|---|---|---|---|---|---|---|
| A | 7910 | 7556 | 2 | 2 | 0.03% | 0.03% | 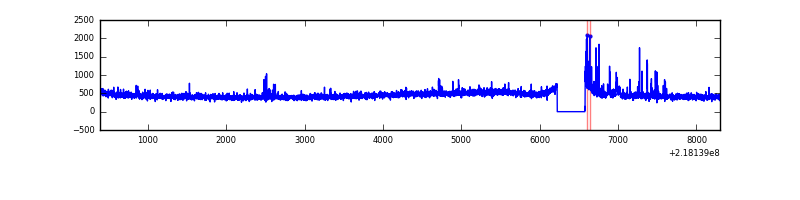 |
| B | 7910 | 7556 | 360 | 360 | 4.55% | 4.76% | 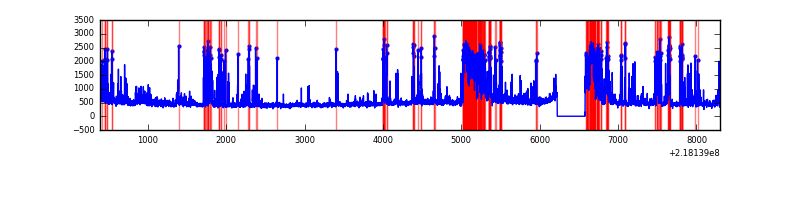 |
| C | 7910 | 7556 | 1 | 1 | 0.01% | 0.01% | 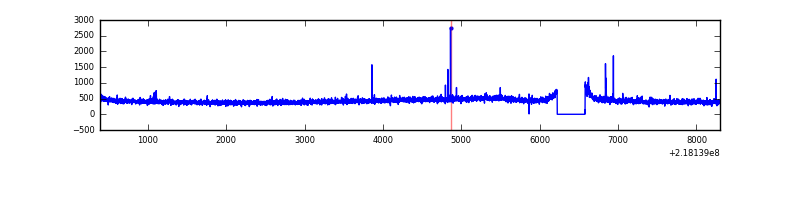 |
| D | 7910 | 7556 | 408 | 408 | 5.16% | 5.40% | 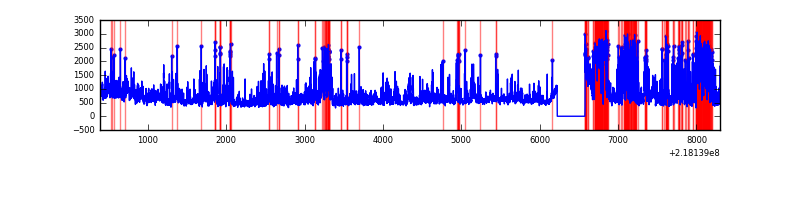 |
Top three noisy pixels from each quadrant. If the there are fewer than three noisy pixels in the level2.evt file, extra rows are filled as -1
| Pixel properties | Quadrant properties | ||||||
|---|---|---|---|---|---|---|---|
| Quadrant | DetID | PixID | Counts | Sigma | Mean | Median | Sigma |
| A | 13 | 251 | 46019 | 259.95 | 844 | 826 | 173.9 |
| A | 3 | 1 | 43853 | 247.49 | 844 | 826 | 173.9 |
| A | 15 | 236 | 37846 | 212.94 | 844 | 826 | 173.9 |
| B | 3 | 64 | 1534091 | 9684.79 | 821 | 803 | 158.3 |
| B | 15 | 204 | 151876 | 954.23 | 821 | 803 | 158.3 |
| B | 0 | 219 | 44920 | 278.66 | 821 | 803 | 158.3 |
| C | 9 | 54 | 23080 | 118.24 | 811 | 815 | 188.3 |
| C | 4 | 254 | 21750 | 111.18 | 811 | 815 | 188.3 |
| C | 13 | 61 | 6513 | 30.26 | 811 | 815 | 188.3 |
| D | 12 | 220 | 1786446 | 9086.59 | 799 | 772 | 196.5 |
| D | 12 | 221 | 607665 | 3088.24 | 799 | 772 | 196.5 |
| D | 4 | 95 | 219678 | 1113.92 | 799 | 772 | 196.5 |
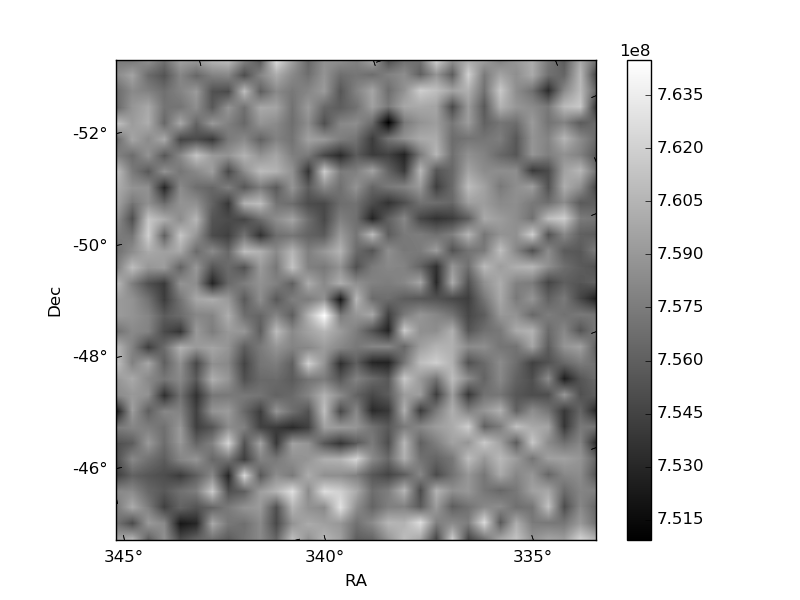
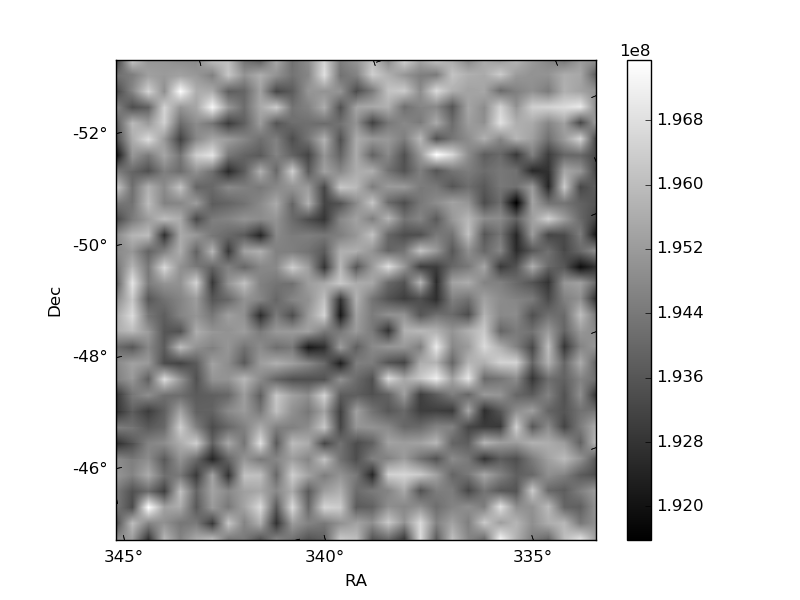
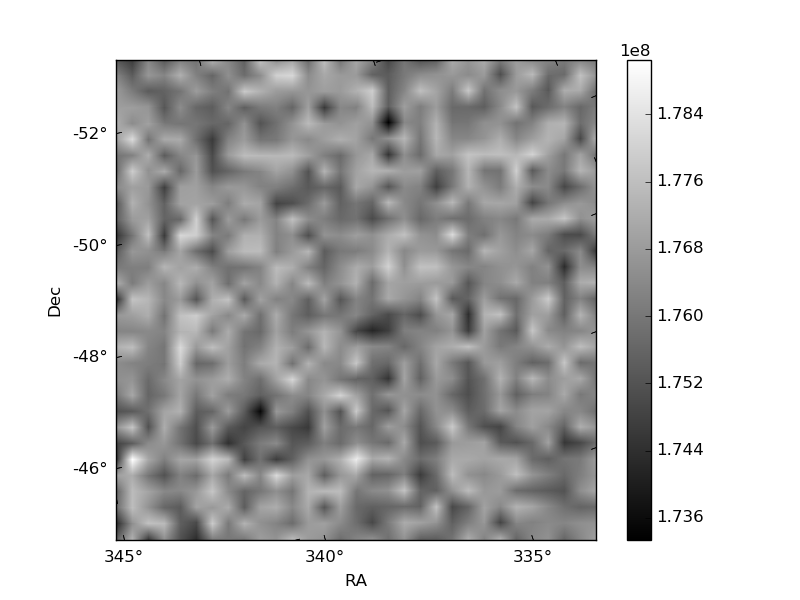
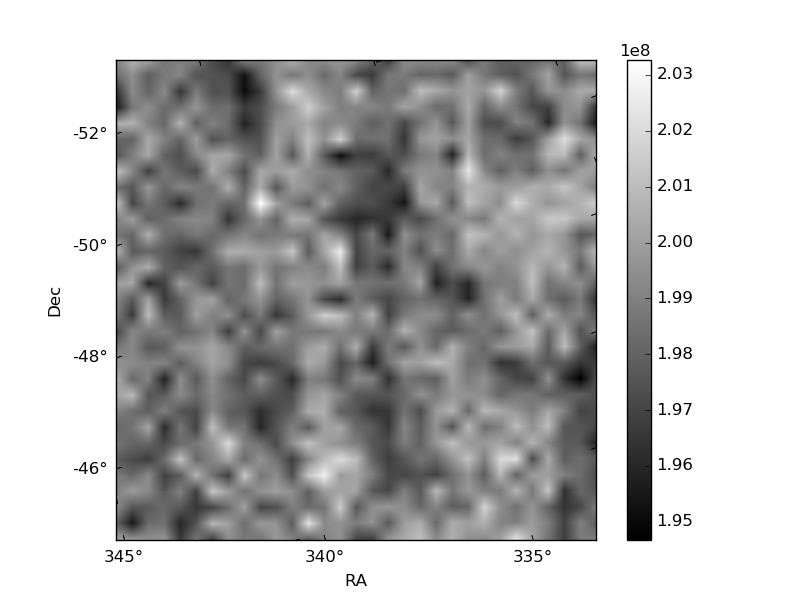
Histogram calculated using DETX and DETY for each event in the final _common_clean file
| Quadrant A | 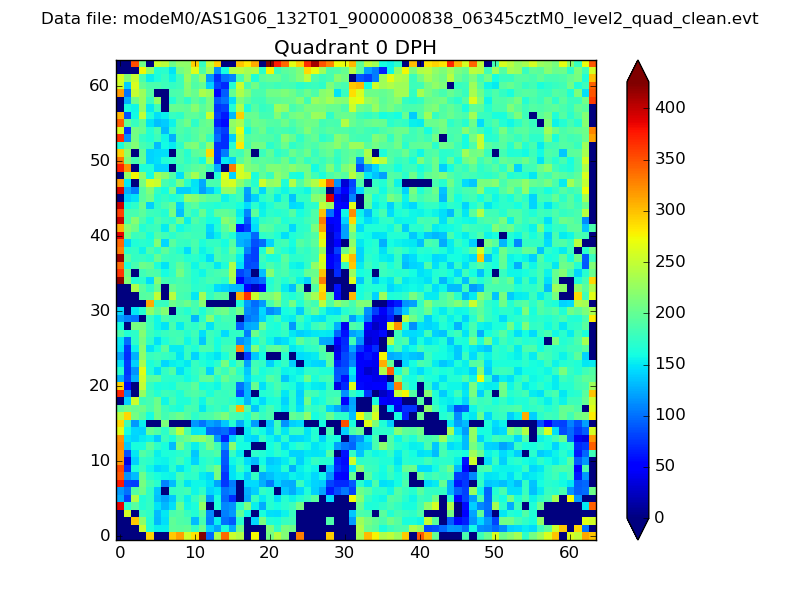 |
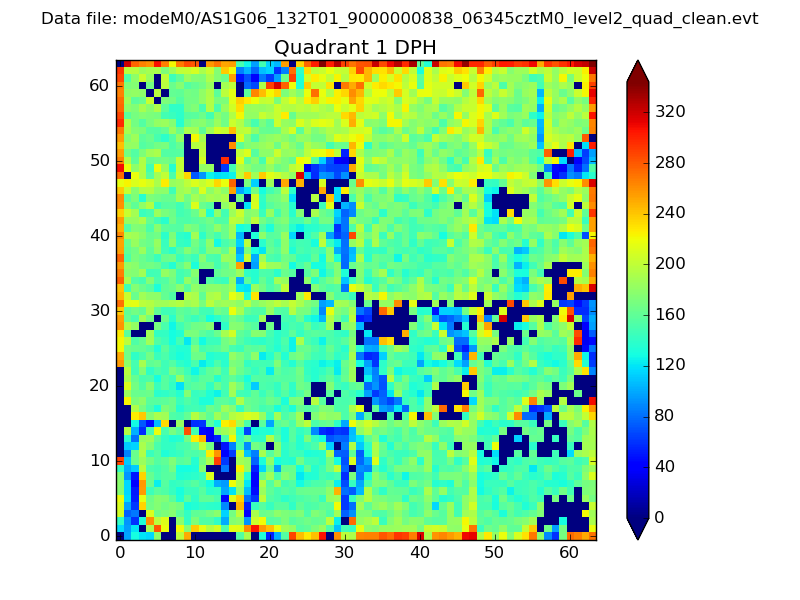 |
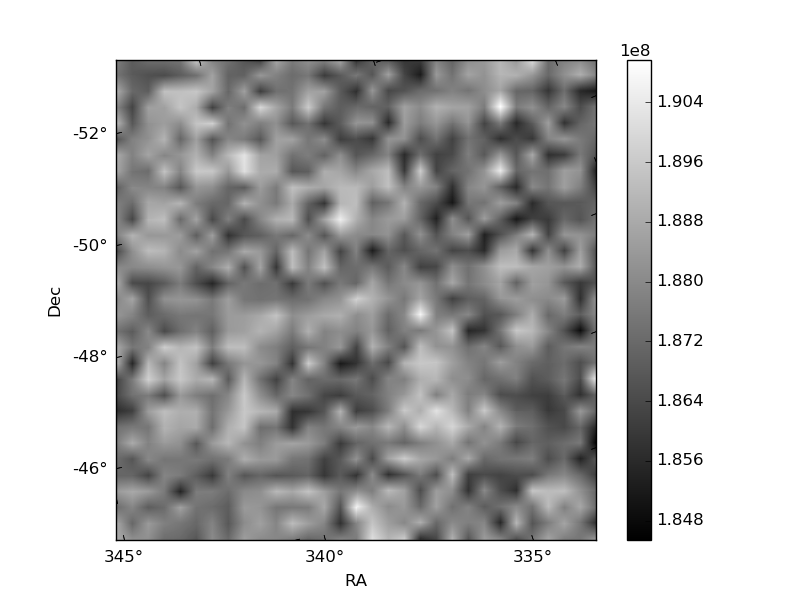
Quadrant B |
|---|---|---|---|
| Quadrant D | 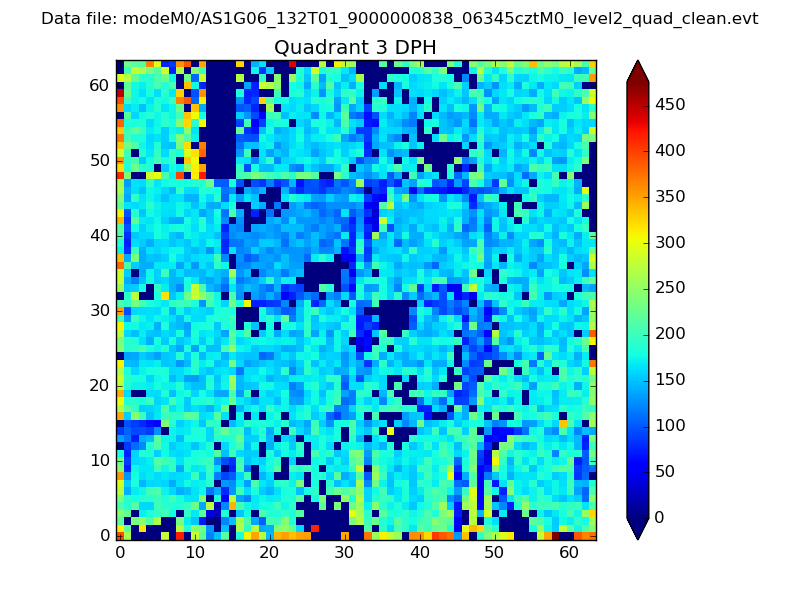 |
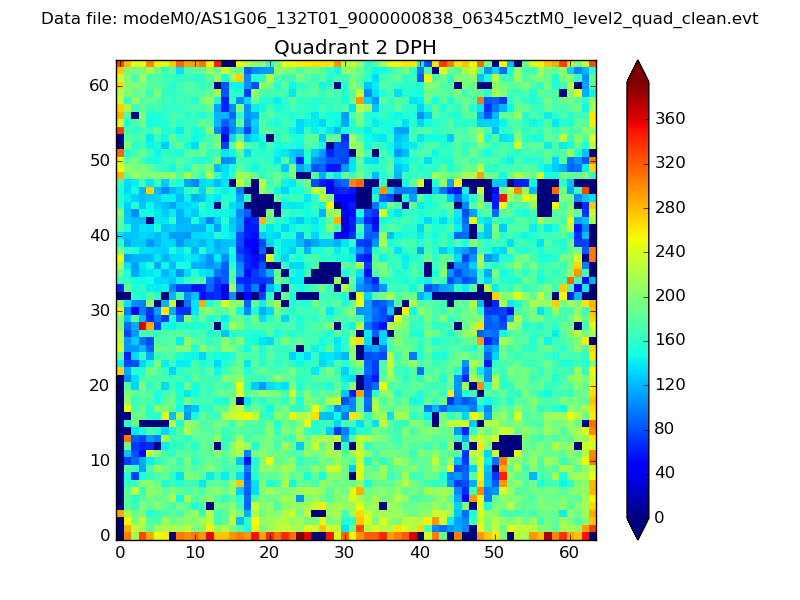 |
Quadrant C |
| Plot type | Count rate plots | Images |
|---|---|---|
| Comparison with Poisson distribution Blue bars denote a histogram of data divided into 1 sec bins. Red curve is a Poisson curve with rate = median count rate of data. |
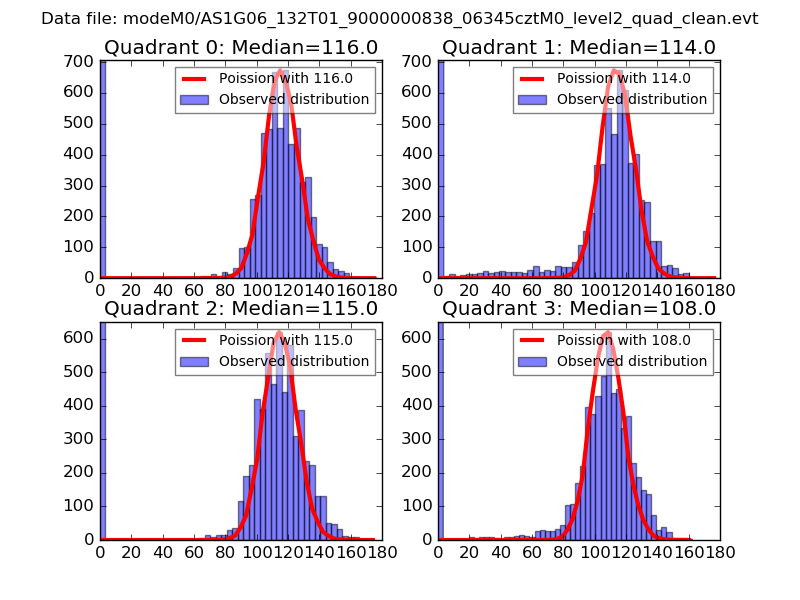 |
 |
| Quadrant-wise count rates Data is divided into 100 sec bins |
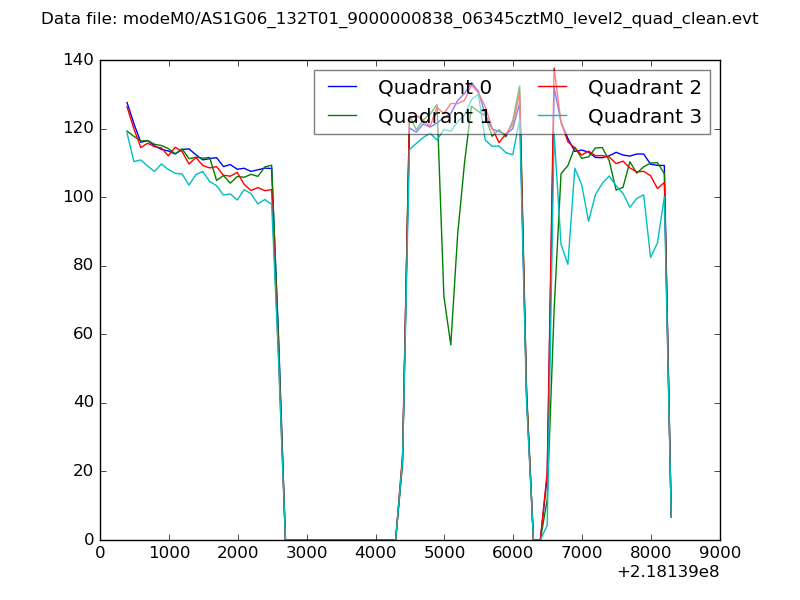 |
|
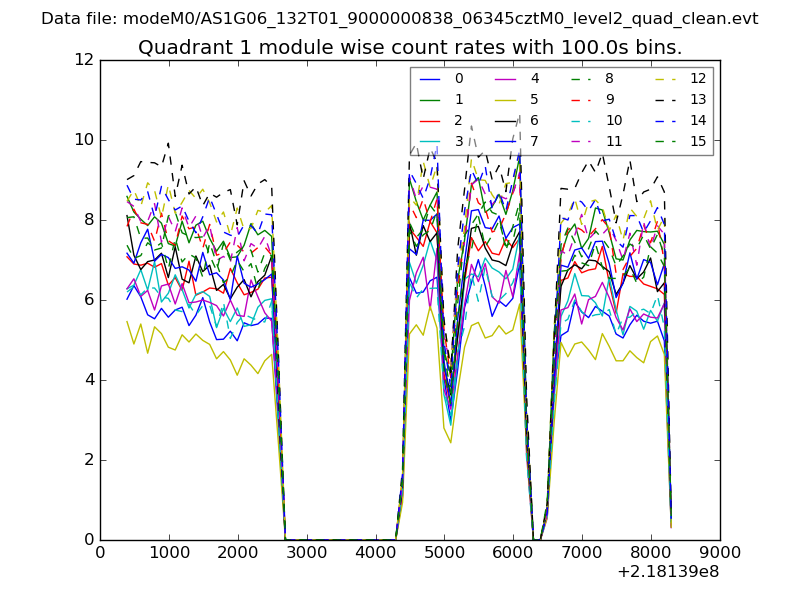
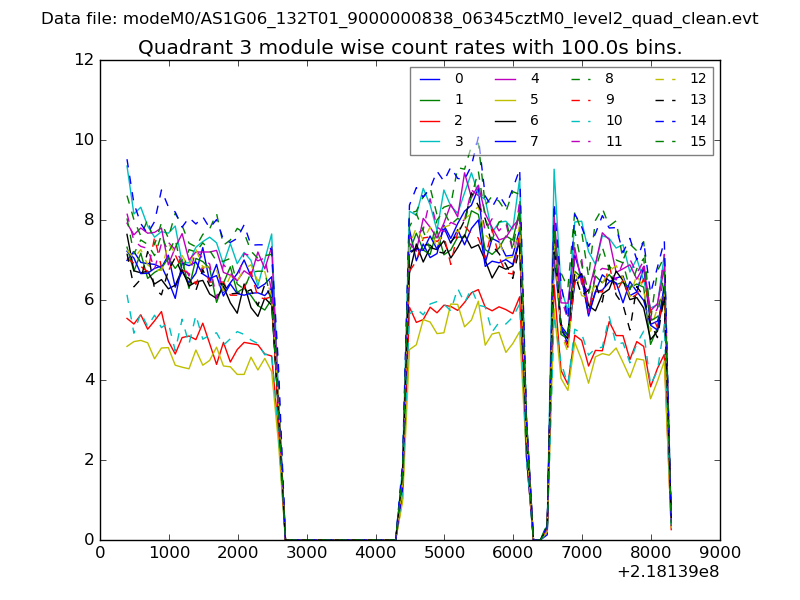
| Module-wise count rates for Quadrant A Data is divided into 100 sec bins |
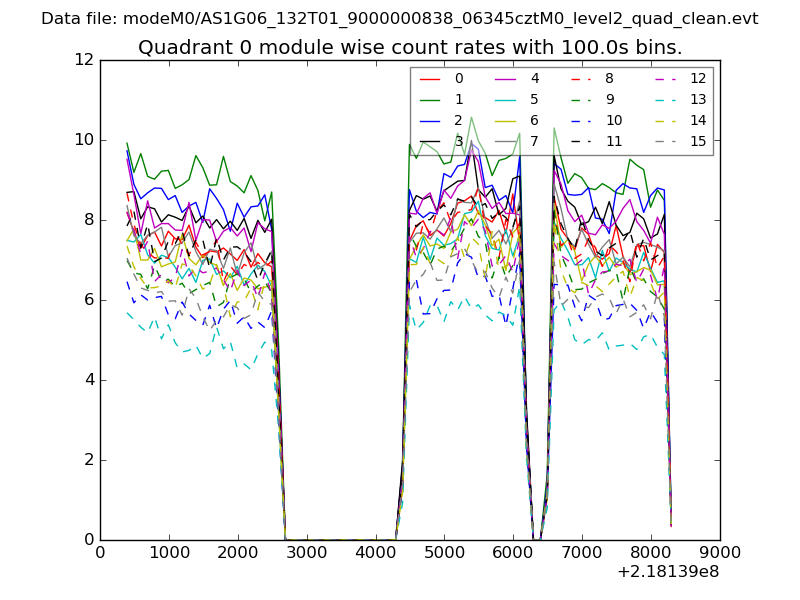 |
 |
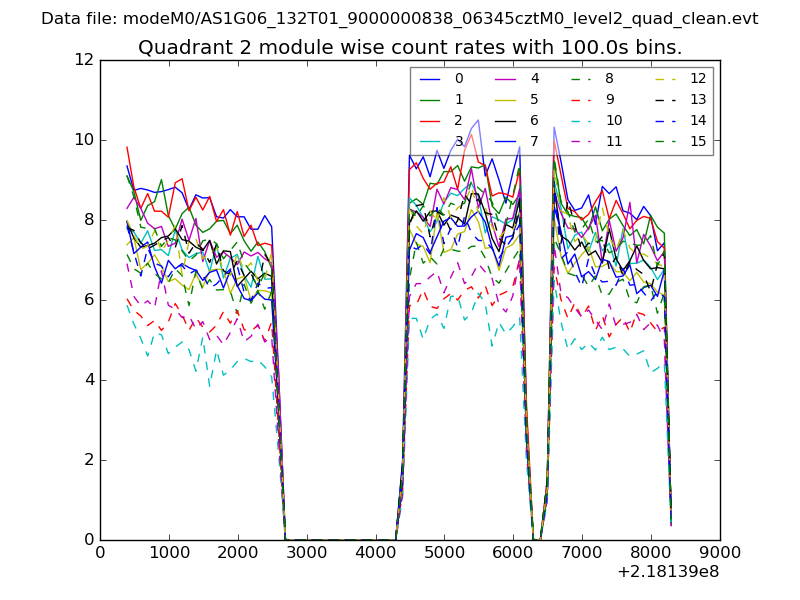
| Module-wise count rates for Quadrant B Data is divided into 100 sec bins |
 |
 |
| Module-wise count rates for Quadrant C Data is divided into 100 sec bins |
 |
 |
| Module-wise count rates for Quadrant D Data is divided into 100 sec bins |
 |
 |
| Parameter | Plot |
|---|---|
| CZT HV Monitor | 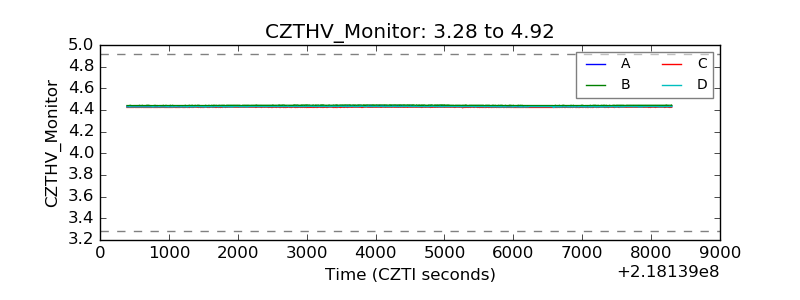 |
| D_VDD | 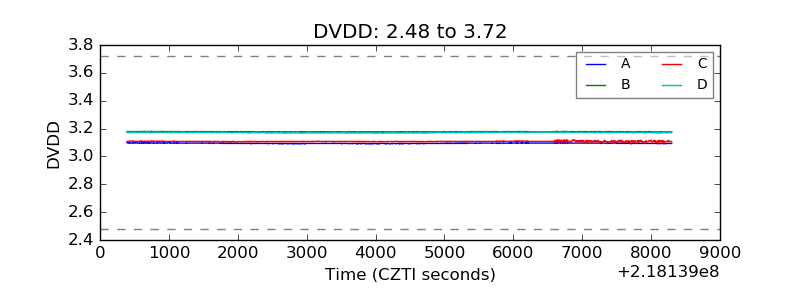 |
| Temperature 1 | 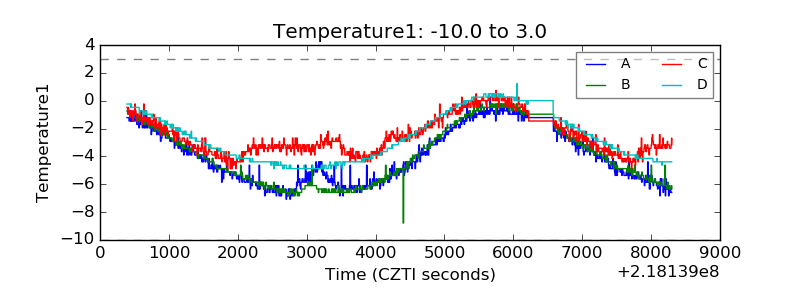 |
| Veto HV Monitor | 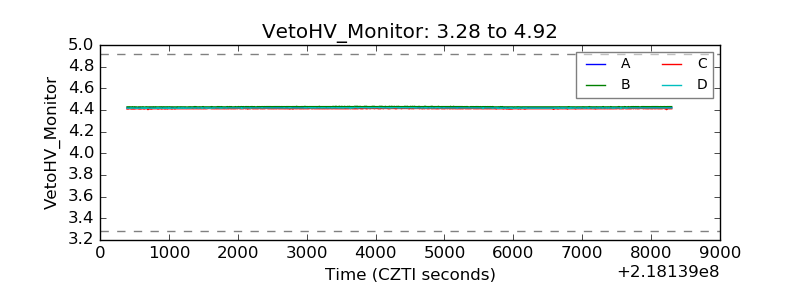 |
| Veto LLD | 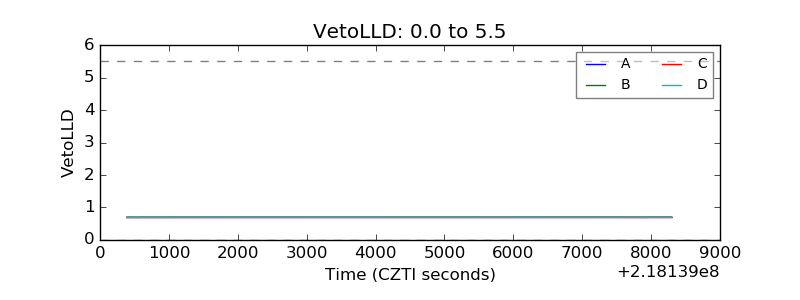 |
| Alpha Counter | 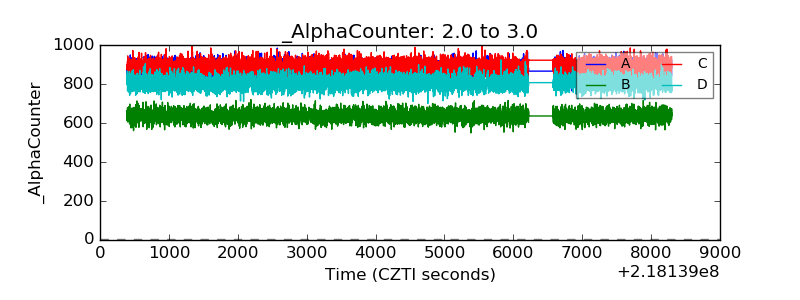 |
| _CPM_Rate | 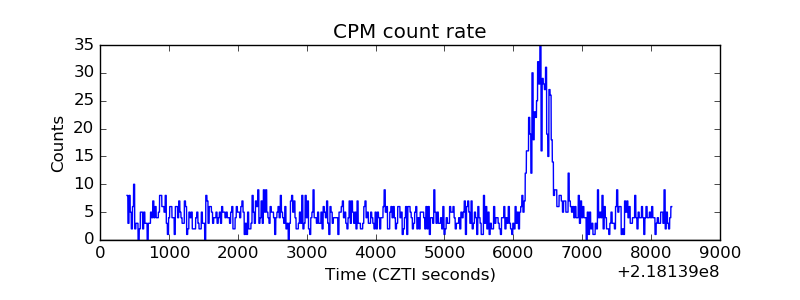 |
| CZT Counter |  |
| +2.5 Volts monitor |  |
| +5 Volts monitor |  |
| _ROLL_ROT | 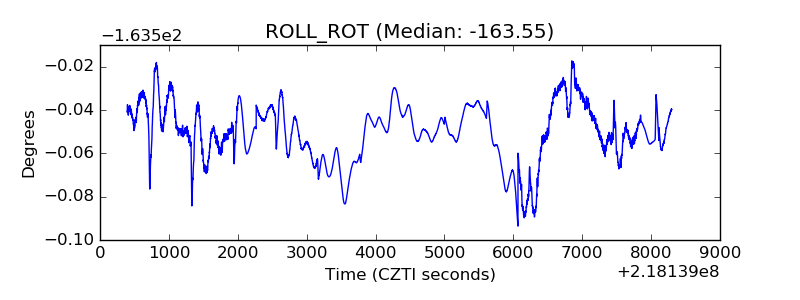 |
| _Roll_DEC | 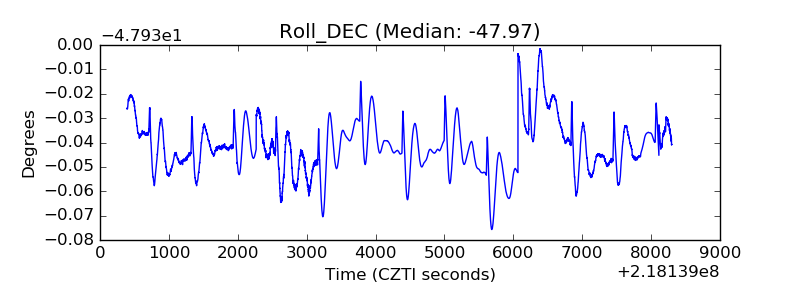 |
| _Roll_RA | 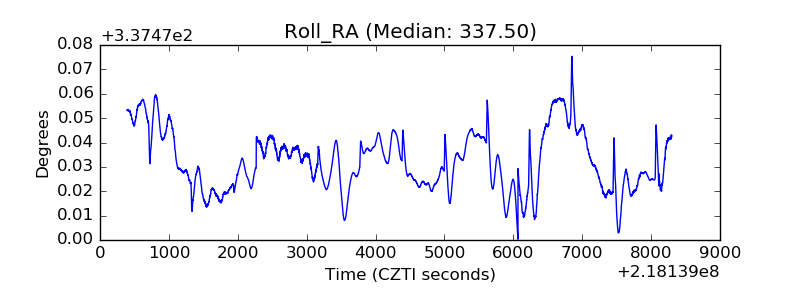 |
| Veto Counter | 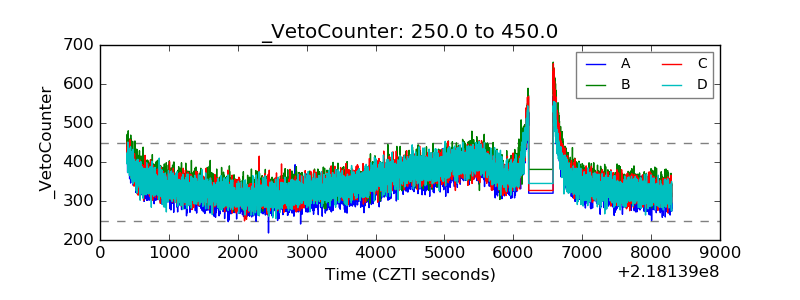 |