| Param | Original file | Final file |
|---|---|---|
| Filename | modeM0/AS1G06_132T01_9000000838_06348cztM0_level2.evt | modeM0/AS1G06_132T01_9000000838_06348cztM0_level2_quad_clean.evt |
| Size (bytes) | 501,871,680 | 81,126,720 |
| Size | 478.6 MB | 77.4 MB |
| Events in quadrant A | 2,925,906 | 518,958 |
| Events in quadrant B | 4,057,040 | 509,046 |
| Events in quadrant C | 2,739,494 | 517,568 |
| Events in quadrant D | 5,053,305 | 475,320 |
| Mode M9 | |||
|---|---|---|---|
| Quadrant | BADHDUFLAG | Total packets | Discarded packets |
| A | 0 | 5 | 0 |
| B | 0 | 5 | 0 |
| C | 0 | 5 | 0 |
| D | 0 | 5 | 0 |
| Mode M0 | |||
|---|---|---|---|
| Quadrant | BADHDUFLAG | Total packets | Discarded packets |
| A | 0 | 13026 | 1 |
| B | 0 | 16331 | 1 |
| C | 0 | 12711 | 1 |
| D | 0 | 19288 | 1 |
| Mode SS | |||
|---|---|---|---|
| Quadrant | BADHDUFLAG | Total packets | Discarded packets |
| A | 0 | 126 | 0 |
| B | 0 | 126 | 0 |
| C | 0 | 126 | 0 |
| D | 0 | 126 | 0 |
| Quadrant | Total seconds | Saturated seconds | Saturation percentage |
|---|---|---|---|
| A | 6242 | 30 | 0.480615% |
| B | 6242 | 264 | 4.229414% |
| C | 6242 | 13 | 0.208267% |
| D | 6242 | 439 | 7.033002% |
Noise dominated data is calculated using 1-second bins in cleaned event files. If a bin has >2000 counts, and if more than 50% of those come from <1% of pixels, then it is considered to be noise-dominated and hence unusable.
| Quadrant | # 1 sec bins | Bins with >0 counts | Bins with >2000 counts | High rate bins dominated by noise | Noise dominated (total time) | Noise dominated (detector-on time) | Marked lightcurve |
|---|---|---|---|---|---|---|---|
| A | 6762 | 6243 | 8 | 8 | 0.12% | 0.13% |  |
| B | 6762 | 6243 | 143 | 143 | 2.11% | 2.29% |  |
| C | 6762 | 6243 | 0 | 0 | 0.00% | 0.00% |  |
| D | 6762 | 6243 | 429 | 429 | 6.34% | 6.87% |  |
Top three noisy pixels from each quadrant. If the there are fewer than three noisy pixels in the level2.evt file, extra rows are filled as -1
| Pixel properties | Quadrant properties | ||||||
|---|---|---|---|---|---|---|---|
| Quadrant | DetID | PixID | Counts | Sigma | Mean | Median | Sigma |
| A | 15 | 236 | 59103 | 403.44 | 707 | 690 | 144.8 |
| A | 15 | 174 | 53030 | 361.5 | 707 | 690 | 144.8 |
| A | 13 | 251 | 40877 | 277.56 | 707 | 690 | 144.8 |
| B | 3 | 64 | 923117 | 6718.72 | 704 | 686 | 137.3 |
| B | 15 | 204 | 123111 | 891.7 | 704 | 686 | 137.3 |
| B | 0 | 229 | 103295 | 747.37 | 704 | 686 | 137.3 |
| C | 4 | 254 | 42091 | 260.2 | 683 | 685 | 159.1 |
| C | 9 | 54 | 11893 | 70.43 | 683 | 685 | 159.1 |
| C | 1 | 16 | 8078 | 46.46 | 683 | 685 | 159.1 |
| D | 12 | 220 | 1392494 | 8377.32 | 669 | 646 | 166.1 |
| D | 12 | 221 | 295008 | 1771.72 | 669 | 646 | 166.1 |
| D | 2 | 152 | 190622 | 1143.44 | 669 | 646 | 166.1 |
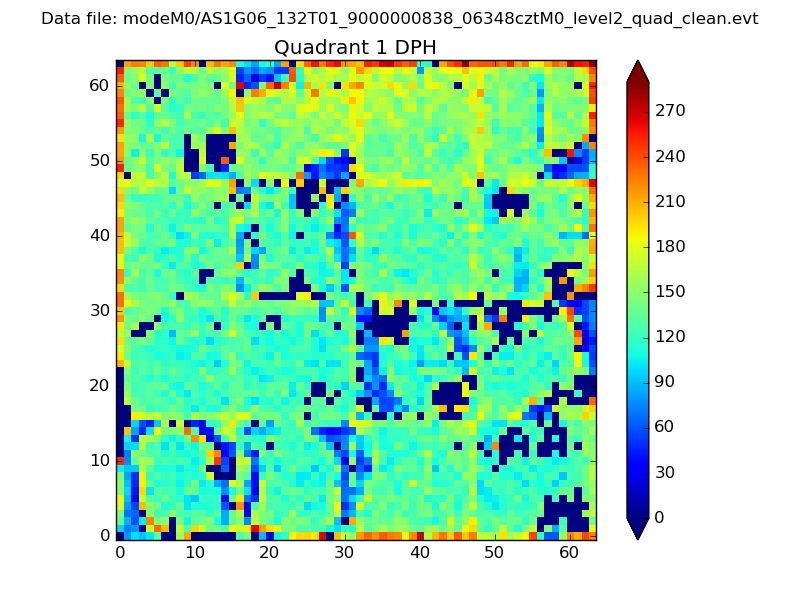
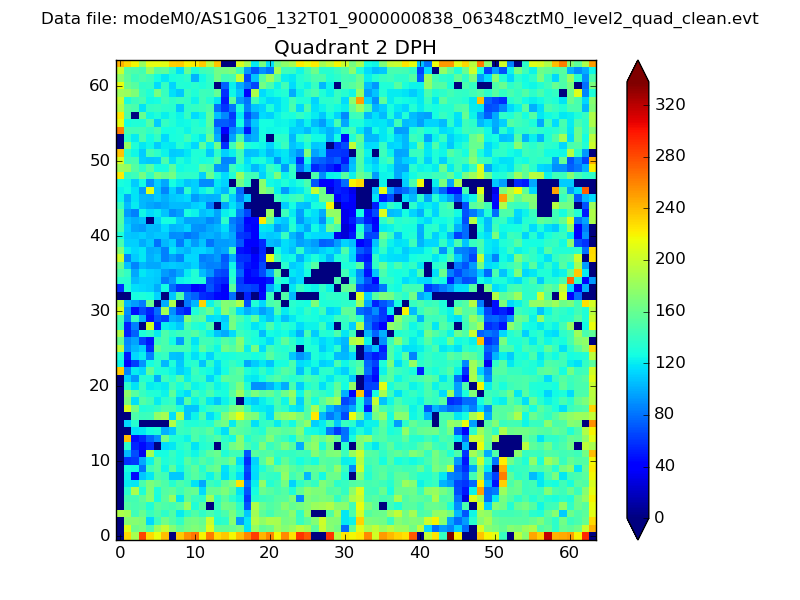
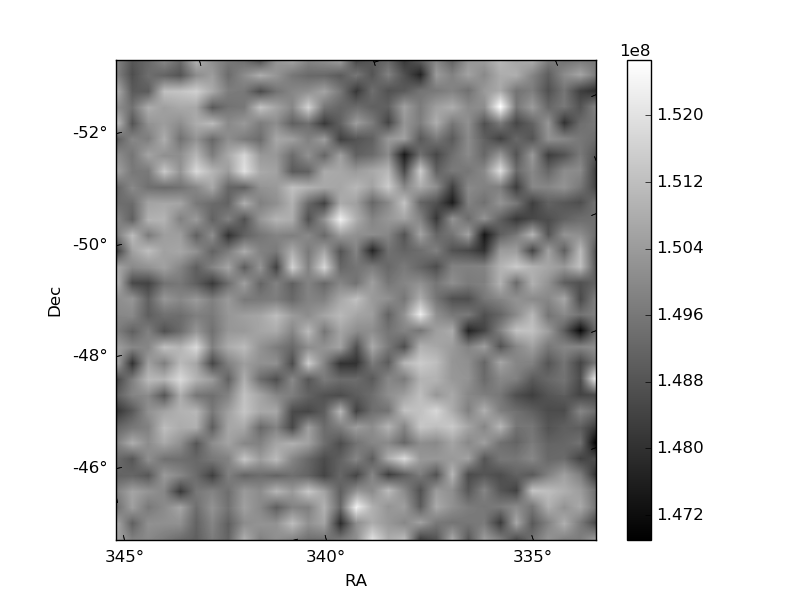
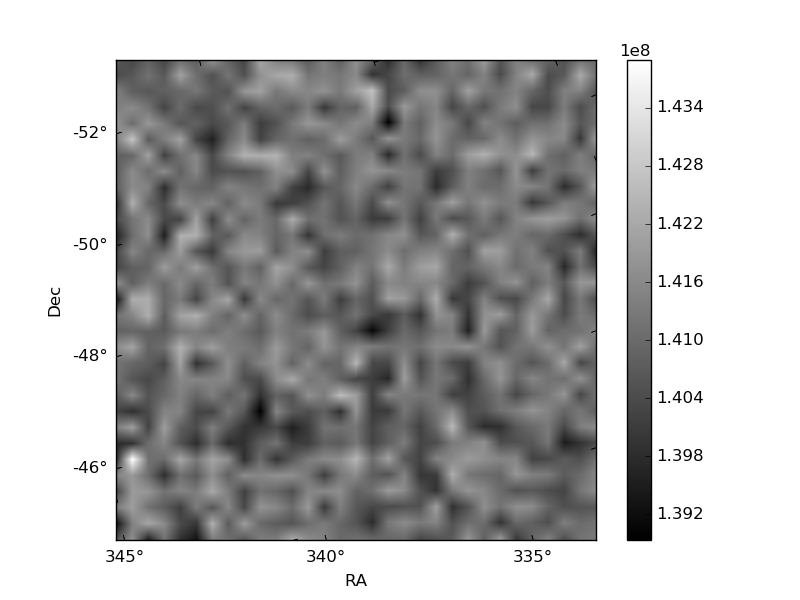
Histogram calculated using DETX and DETY for each event in the final _common_clean file
| Quadrant A |  |
 |
Quadrant B |
|---|---|---|---|
| Quadrant D |  |
 |
Quadrant C |
| Plot type | Count rate plots | Images |
|---|---|---|
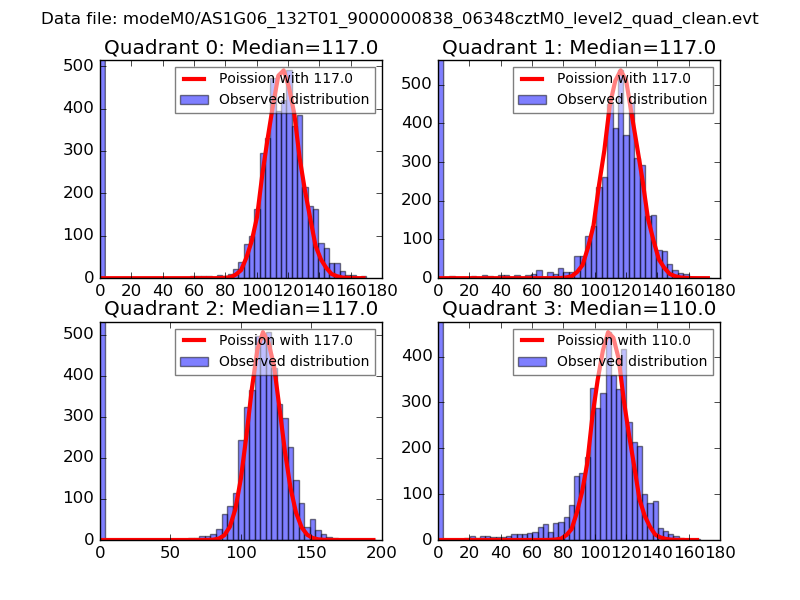
| Comparison with Poisson distribution Blue bars denote a histogram of data divided into 1 sec bins. Red curve is a Poisson curve with rate = median count rate of data. |
 |
 |
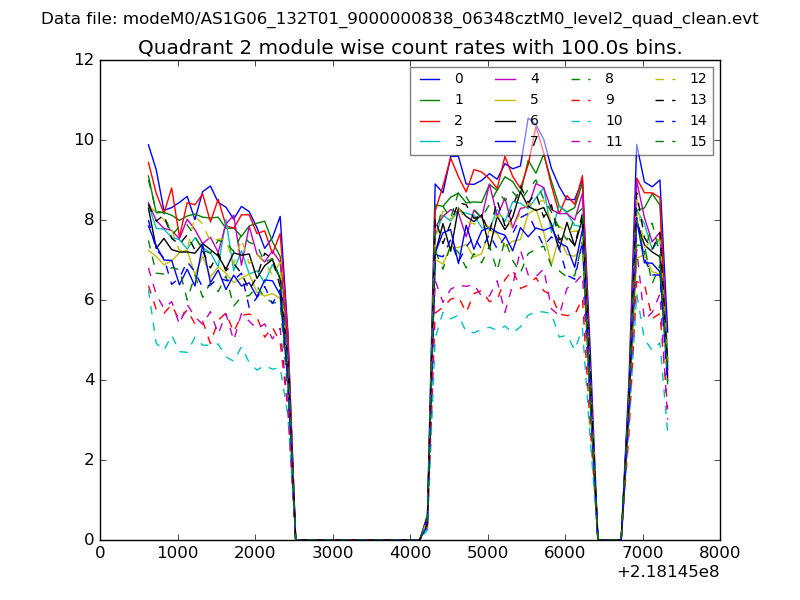
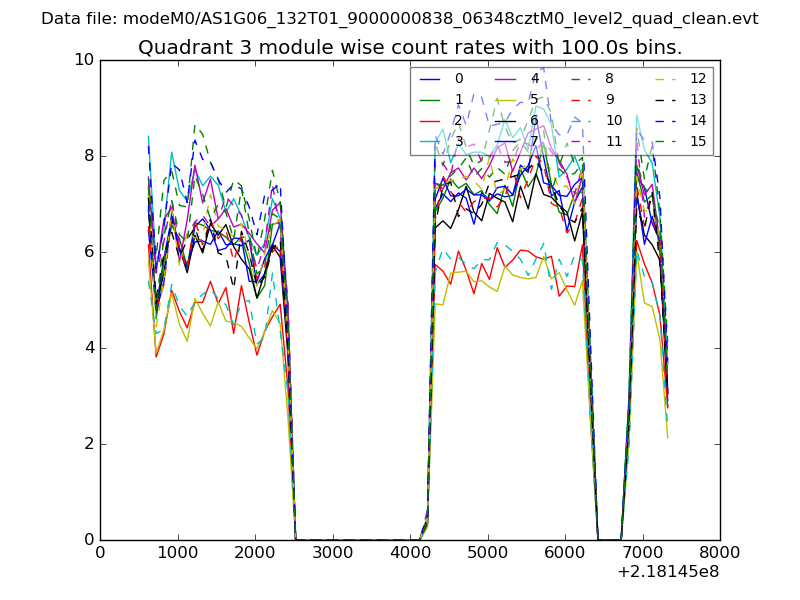
| Quadrant-wise count rates Data is divided into 100 sec bins |
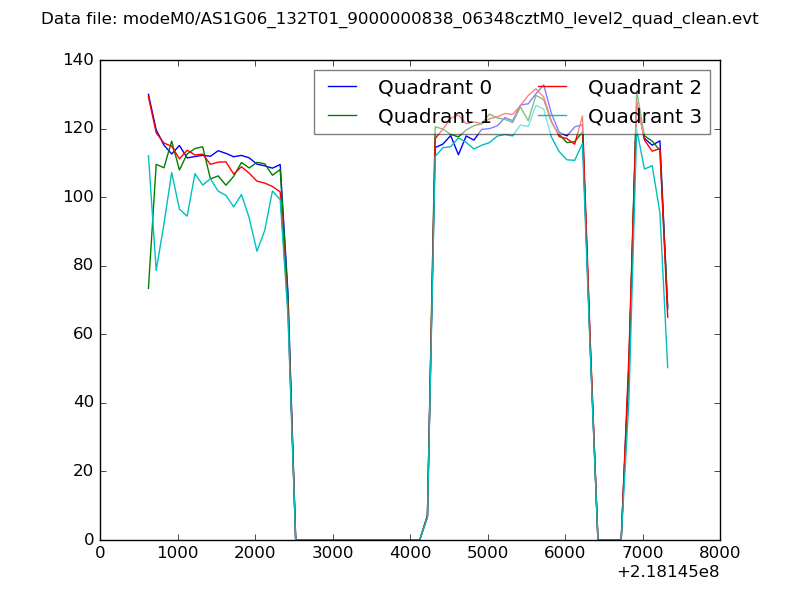 |
|
| Module-wise count rates for Quadrant A Data is divided into 100 sec bins |
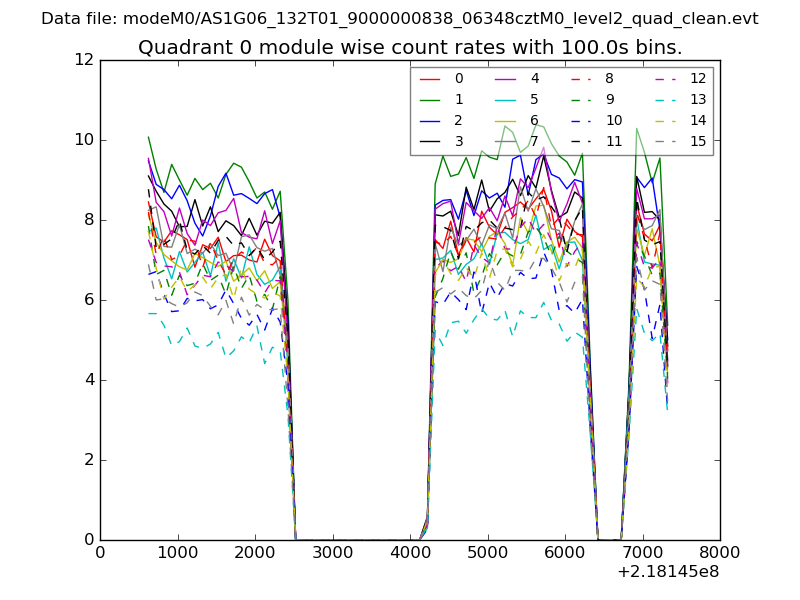 |
 |
| Module-wise count rates for Quadrant B Data is divided into 100 sec bins |
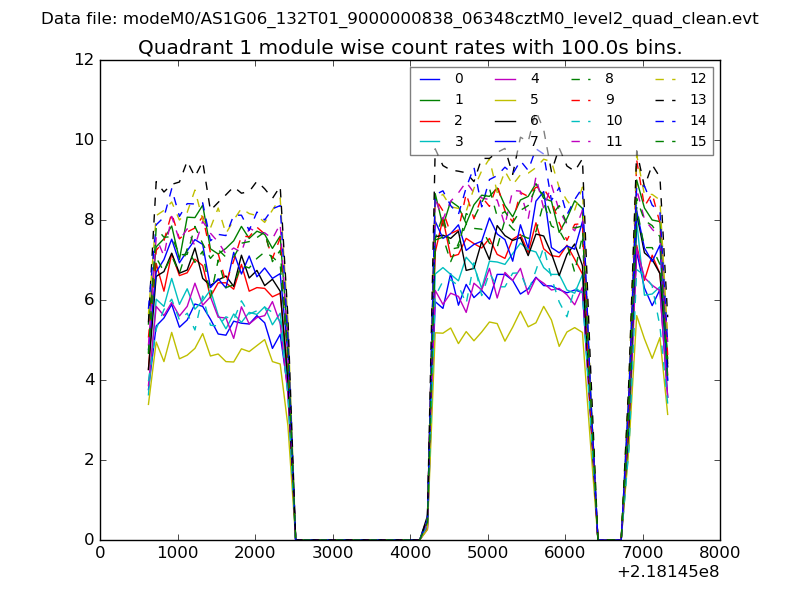 |
 |
| Module-wise count rates for Quadrant C Data is divided into 100 sec bins |
 |
 |
| Module-wise count rates for Quadrant D Data is divided into 100 sec bins |
 |
 |
| Parameter | Plot |
|---|---|
| CZT HV Monitor | 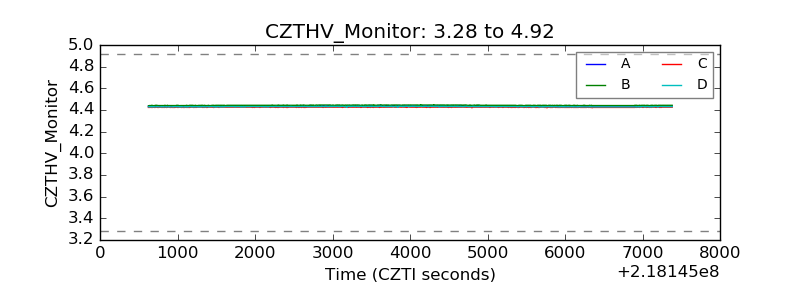 |
| D_VDD | 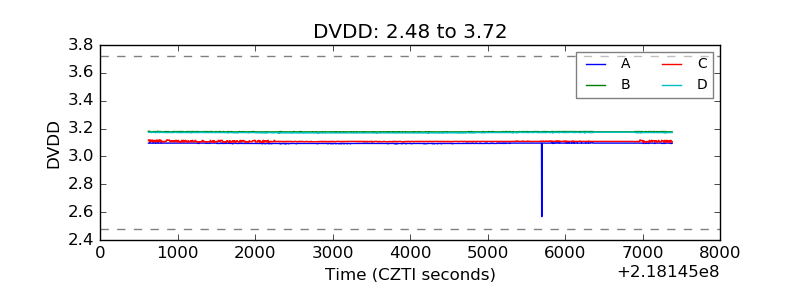 |
| Temperature 1 | 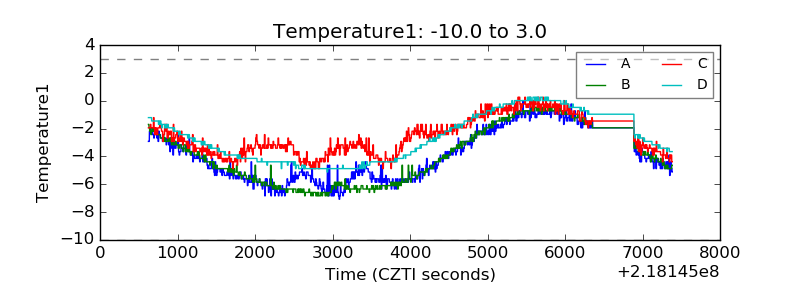 |
| Veto HV Monitor | 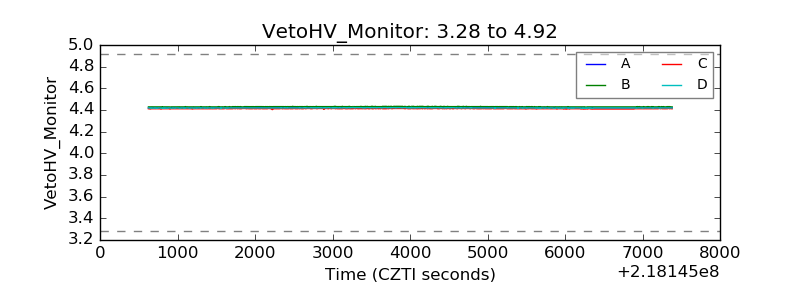 |
| Veto LLD | 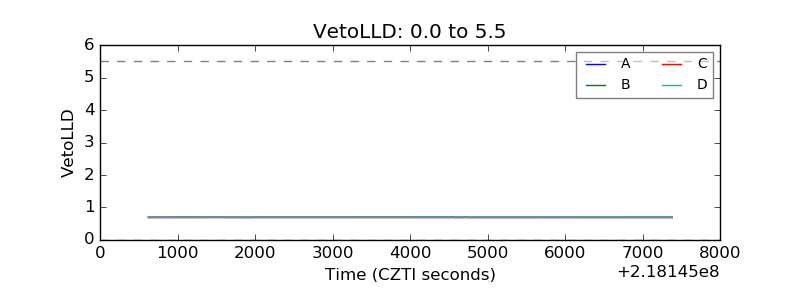 |
| Alpha Counter | 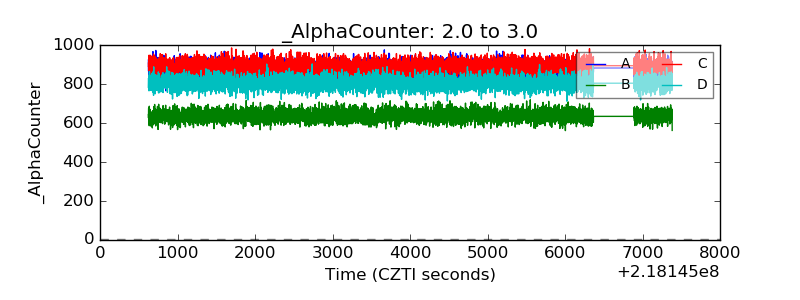 |
| _CPM_Rate | 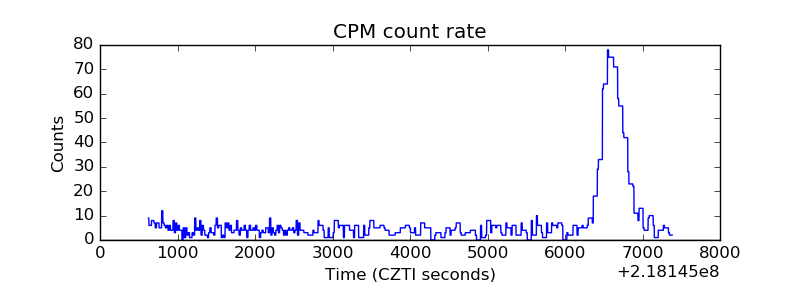 |
| CZT Counter | 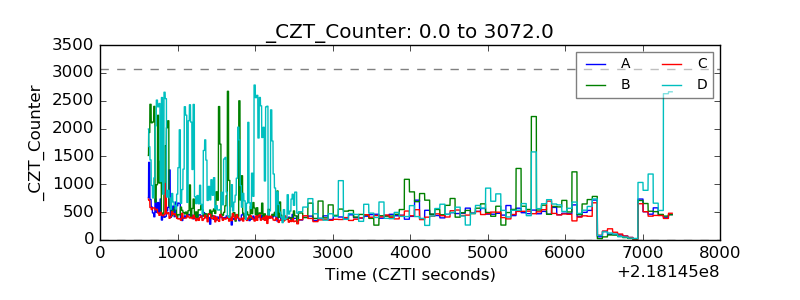 |
| +2.5 Volts monitor |  |
| +5 Volts monitor |  |
| _ROLL_ROT | 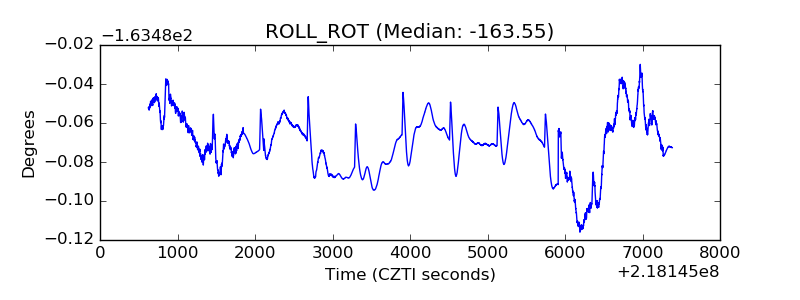 |
| _Roll_DEC | 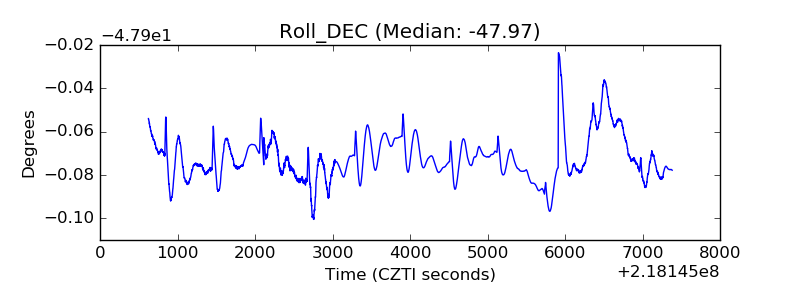 |
| _Roll_RA | 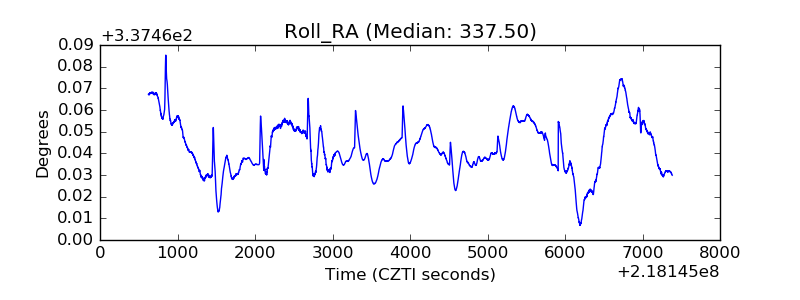 |
| Veto Counter | 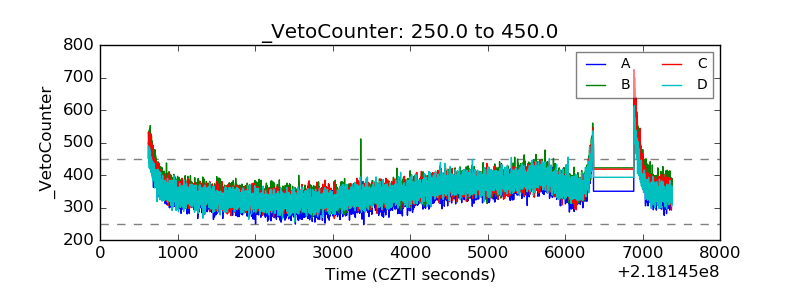 |