| Param | Original file | Final file |
|---|---|---|
| Filename | modeM0/AS1A02_124T01_9000000842cztM0_level2.fits | modeM0/AS1A02_124T01_9000000842cztM0_level2_quad_clean.evt |
| Size (bytes) | 1,322,328,960 | 1,322,424,000 |
| Size | 1.2 GB | 1.2 GB |
| Events in quadrant A | 7,945,006 | 7,961,718 |
| Events in quadrant B | 7,616,838 | 7,650,442 |
| Events in quadrant C | 7,871,052 | 7,598,699 |
| Events in quadrant D | 6,760,030 | 6,991,024 |
| Mode M9 | |||
|---|---|---|---|
| Quadrant | BADHDUFLAG | Total packets | Discarded packets |
| A | 0 | 231 | 0 |
| B | 0 | 229 | 0 |
| C | 0 | 230 | 0 |
| D | 0 | 231 | 0 |
| Mode M0 | |||
|---|---|---|---|
| Quadrant | BADHDUFLAG | Total packets | Discarded packets |
| A | 0 | 308828 | 0 |
| B | 0 | 337504 | 0 |
| C | 0 | 302585 | 0 |
| D | 0 | 336524 | 0 |
| Mode SS | |||
|---|---|---|---|
| Quadrant | BADHDUFLAG | Total packets | Discarded packets |
| A | 0 | 2936 | 0 |
| B | 0 | 2948 | 0 |
| C | 0 | 2944 | 0 |
| D | 0 | 2938 | 0 |
| Quadrant | Total seconds | Saturated seconds | Saturation percentage |
|---|---|---|---|
| A | 143722 | 1610 | 1.120218% |
| B | 143991 | 5772 | 4.008584% |
| C | 143671 | 1555 | 1.082334% |
| D | 143531 | 3263 | 2.273376% |
Noise dominated data is calculated using 1-second bins in cleaned event files. If a bin has >2000 counts, and if more than 50% of those come from <1% of pixels, then it is considered to be noise-dominated and hence unusable.
| Quadrant | # 1 sec bins | Bins with >0 counts | Bins with >2000 counts | High rate bins dominated by noise | Noise dominated (total time) | Noise dominated (detector-on time) | Marked lightcurve |
|---|---|---|---|---|---|---|---|
| A | 174904 | 144480 | 0 | 0 | 0.00% | 0.00% |  |
| B | 174904 | 144774 | 0 | 0 | 0.00% | 0.00% |  |
| C | 174904 | 144413 | 0 | 0 | 0.00% | 0.00% |  |
| D | 174904 | 144212 | 0 | 0 | 0.00% | 0.00% |  |
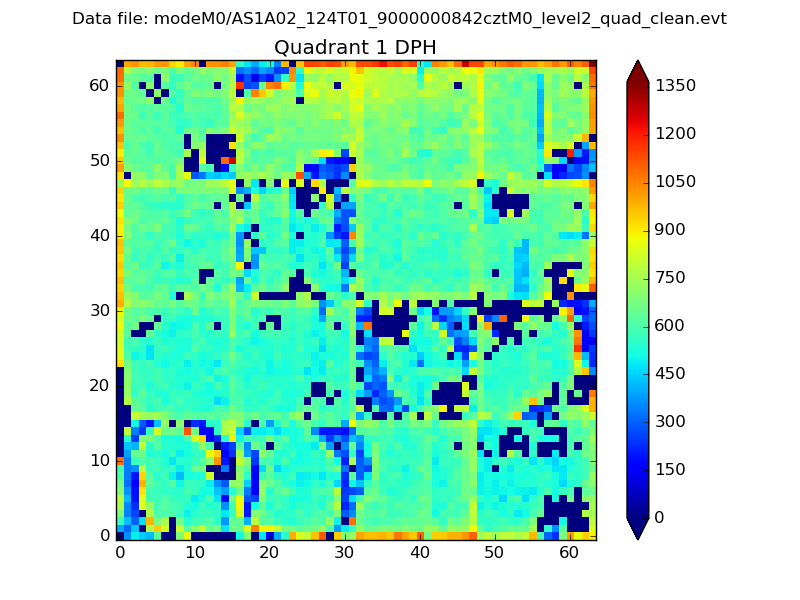
Top three noisy pixels from each quadrant. If the there are fewer than three noisy pixels in the level2.evt file, extra rows are filled as -1
| Pixel properties | Quadrant properties | ||||||
|---|---|---|---|---|---|---|---|
| Quadrant | DetID | PixID | Counts | Sigma | Mean | Median | Sigma |
| A | 0 | 29 | 7768 | 11.24 | 2066 | 1933 | 519.3 |
| A | 7 | 110 | 6680 | 9.14 | 2066 | 1933 | 519.3 |
| A | 0 | 30 | 6241 | 8.3 | 2066 | 1933 | 519.3 |
| B | 2 | 9 | 6588 | 11.78 | 2010 | 1912 | 396.8 |
| B | 14 | 254 | 5181 | 8.24 | 2010 | 1912 | 396.8 |
| B | 12 | 226 | 5162 | 8.19 | 2010 | 1912 | 396.8 |
| C | 1 | 80 | 5787 | 7.07 | 2080 | 1931 | 545.0 |
| C | 1 | 81 | 5684 | 6.89 | 2080 | 1931 | 545.0 |
| C | 12 | 241 | 5425 | 6.41 | 2080 | 1931 | 545.0 |
| D | 3 | 14 | 5077 | 6.52 | 1928 | 1754 | 509.9 |
| D | 6 | 231 | 4941 | 6.25 | 1928 | 1754 | 509.9 |
| D | 11 | 82 | 4923 | 6.22 | 1928 | 1754 | 509.9 |
Histogram calculated using DETX and DETY for each event in the final _common_clean file
| Quadrant A |  |
 |
Quadrant B |
|---|---|---|---|
| Quadrant D |  |
 |
Quadrant C |
| Plot type | Count rate plots | Images |
|---|---|---|
| Comparison with Poisson distribution Blue bars denote a histogram of data divided into 1 sec bins. Red curve is a Poisson curve with rate = median count rate of data. |
 |
 |
| Quadrant-wise count rates Data is divided into 100 sec bins |
 |
|
| Module-wise count rates for Quadrant A Data is divided into 100 sec bins |
 |
 |
| Module-wise count rates for Quadrant B Data is divided into 100 sec bins |
 |
 |
| Module-wise count rates for Quadrant C Data is divided into 100 sec bins |
 |
 |
| Module-wise count rates for Quadrant D Data is divided into 100 sec bins |
 |
 |
| Parameter | Plot |
|---|---|
| CZT HV Monitor |  |
| D_VDD |  |
| Temperature 1 |  |
| Veto HV Monitor |  |
| Veto LLD |  |
| Alpha Counter |  |
| _CPM_Rate |  |
| CZT Counter |  |
| +2.5 Volts monitor |  |
| +5 Volts monitor |  |
| _ROLL_ROT |  |
| _Roll_DEC |  |
| _Roll_RA |  |
| Veto Counter |  |