| Param | Original file | Final file |
|---|---|---|
| Filename | modeM0/AS1A02_124T01_9000000842_06351cztM0_level2.evt | modeM0/AS1A02_124T01_9000000842_06351cztM0_level2_quad_clean.evt |
| Size (bytes) | 407,952,000 | 77,152,320 |
| Size | 389.1 MB | 73.6 MB |
| Events in quadrant A | 2,841,785 | 481,720 |
| Events in quadrant B | 2,924,088 | 491,841 |
| Events in quadrant C | 2,875,444 | 483,385 |
| Events in quadrant D | 3,306,493 | 461,396 |
| Mode M9 | |||
|---|---|---|---|
| Quadrant | BADHDUFLAG | Total packets | Discarded packets |
| A | 0 | 11 | 0 |
| B | 0 | 11 | 0 |
| C | 0 | 11 | 0 |
| D | 0 | 11 | 0 |
| Mode M0 | |||
|---|---|---|---|
| Quadrant | BADHDUFLAG | Total packets | Discarded packets |
| A | 0 | 12295 | 2 |
| B | 0 | 12633 | 1 |
| C | 0 | 12436 | 1 |
| D | 0 | 13813 | 1 |
| Mode SS | |||
|---|---|---|---|
| Quadrant | BADHDUFLAG | Total packets | Discarded packets |
| A | 0 | 122 | 0 |
| B | 0 | 122 | 0 |
| C | 0 | 122 | 0 |
| D | 0 | 122 | 0 |
| Quadrant | Total seconds | Saturated seconds | Saturation percentage |
|---|---|---|---|
| A | 5982 | 38 | 0.635239% |
| B | 5982 | 62 | 1.036443% |
| C | 5982 | 36 | 0.601805% |
| D | 5982 | 86 | 1.437646% |
Noise dominated data is calculated using 1-second bins in cleaned event files. If a bin has >2000 counts, and if more than 50% of those come from <1% of pixels, then it is considered to be noise-dominated and hence unusable.
| Quadrant | # 1 sec bins | Bins with >0 counts | Bins with >2000 counts | High rate bins dominated by noise | Noise dominated (total time) | Noise dominated (detector-on time) | Marked lightcurve |
|---|---|---|---|---|---|---|---|
| A | 7087 | 5983 | 0 | 0 | 0.00% | 0.00% | 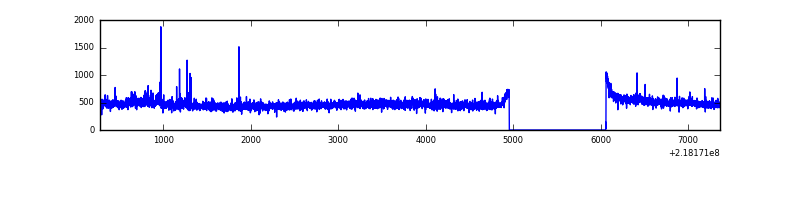 |
| B | 7087 | 5983 | 17 | 17 | 0.24% | 0.28% | 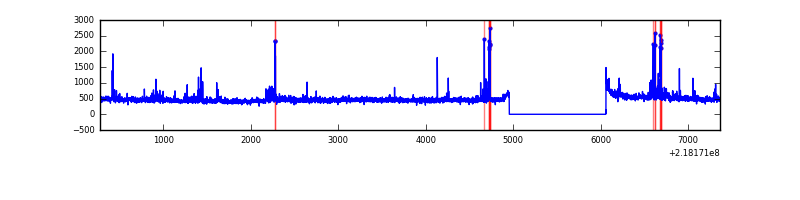 |
| C | 7087 | 5983 | 2 | 2 | 0.03% | 0.03% | 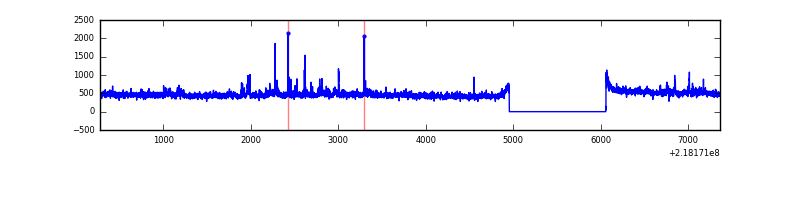 |
| D | 7087 | 5983 | 43 | 43 | 0.61% | 0.72% | 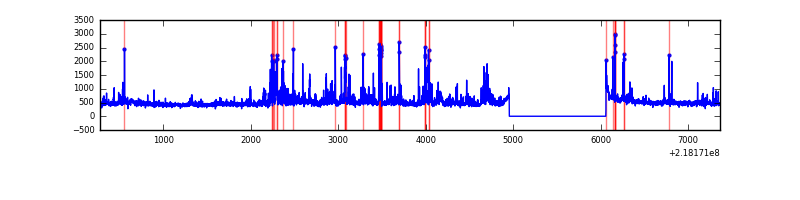 |
Top three noisy pixels from each quadrant. If the there are fewer than three noisy pixels in the level2.evt file, extra rows are filled as -1
| Pixel properties | Quadrant properties | ||||||
|---|---|---|---|---|---|---|---|
| Quadrant | DetID | PixID | Counts | Sigma | Mean | Median | Sigma |
| A | 15 | 236 | 91083 | 640.51 | 697 | 681 | 141.1 |
| A | 8 | 15 | 59987 | 420.19 | 697 | 681 | 141.1 |
| A | 12 | 194 | 6792 | 43.3 | 697 | 681 | 141.1 |
| B | 4 | 80 | 80752 | 595.47 | 706 | 688 | 134.5 |
| B | 0 | 219 | 51924 | 381.07 | 706 | 688 | 134.5 |
| B | 0 | 228 | 29558 | 214.72 | 706 | 688 | 134.5 |
| C | 4 | 254 | 178975 | 1123.82 | 689 | 693 | 158.6 |
| C | 13 | 61 | 5254 | 28.75 | 689 | 693 | 158.6 |
| C | 8 | 222 | 2685 | 12.56 | 689 | 693 | 158.6 |
| D | 12 | 220 | 444684 | 2649.24 | 683 | 662 | 167.6 |
| D | 10 | 15 | 60836 | 359.03 | 683 | 662 | 167.6 |
| D | 2 | 14 | 35650 | 208.75 | 683 | 662 | 167.6 |
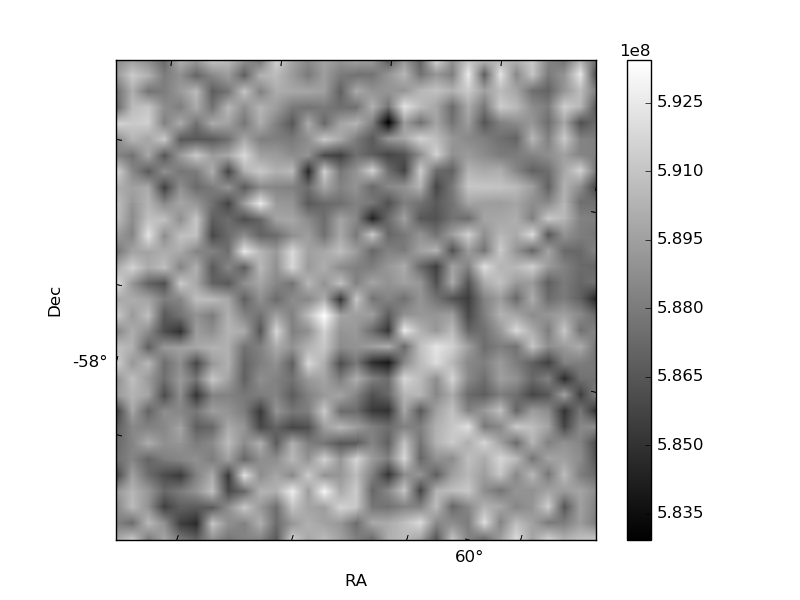
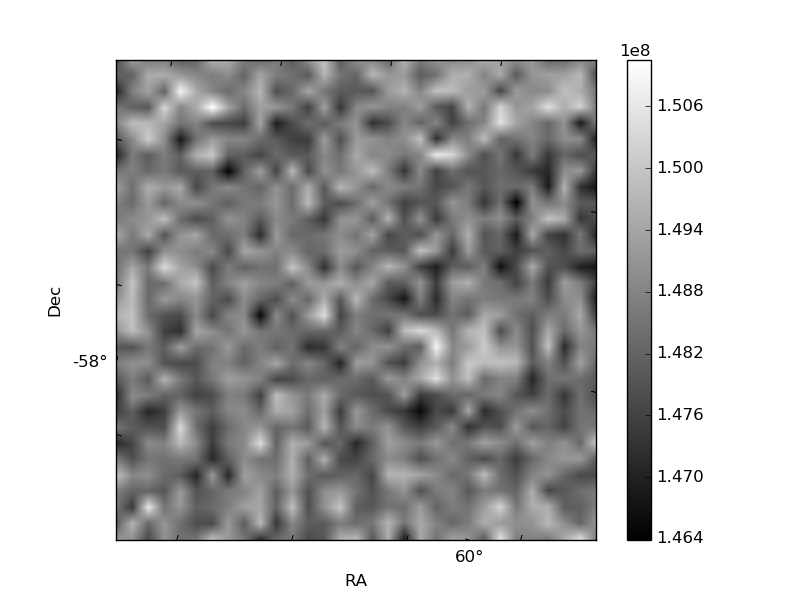
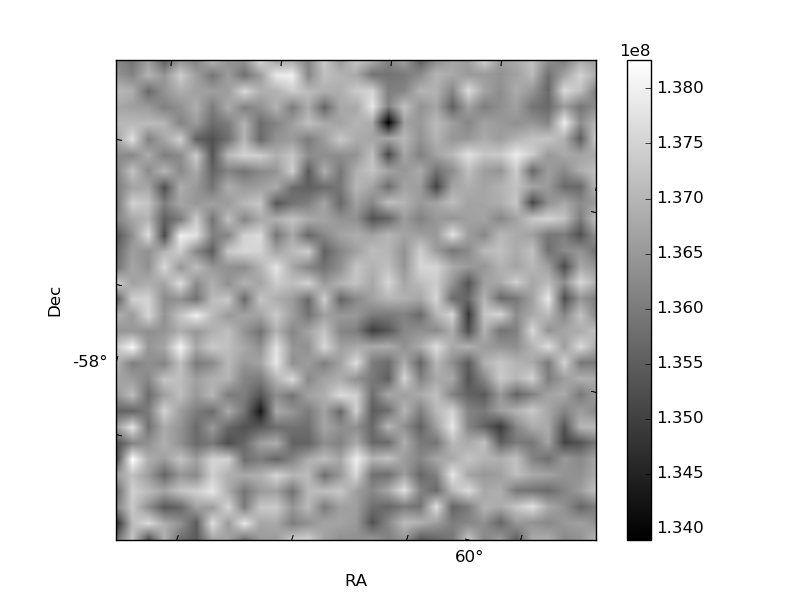
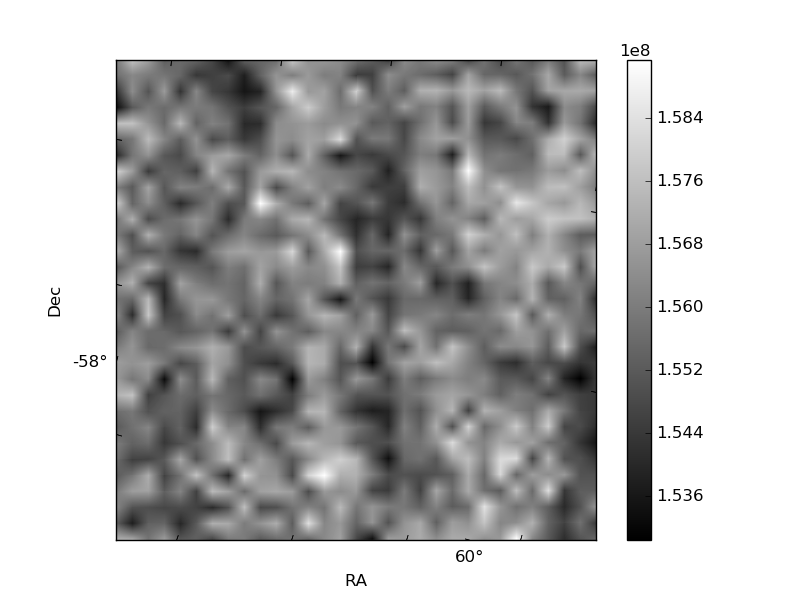
Histogram calculated using DETX and DETY for each event in the final _common_clean file
| Quadrant A | 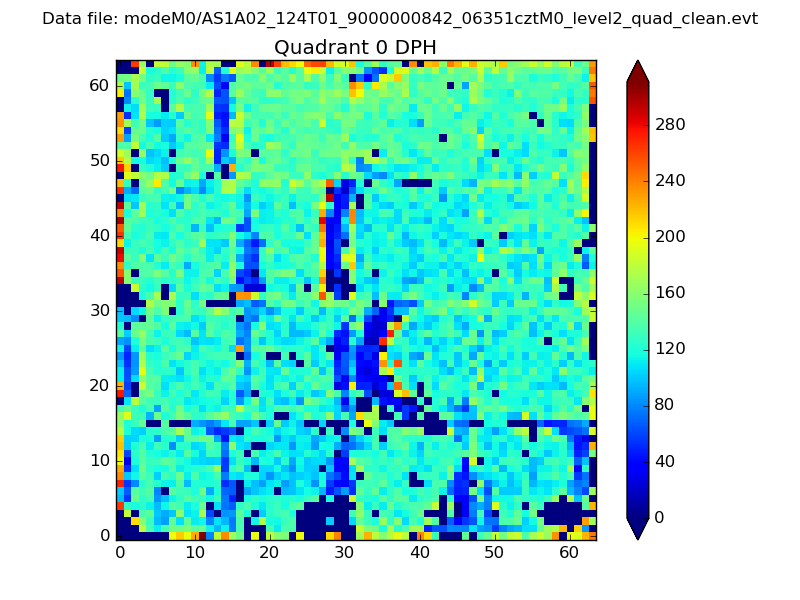 |
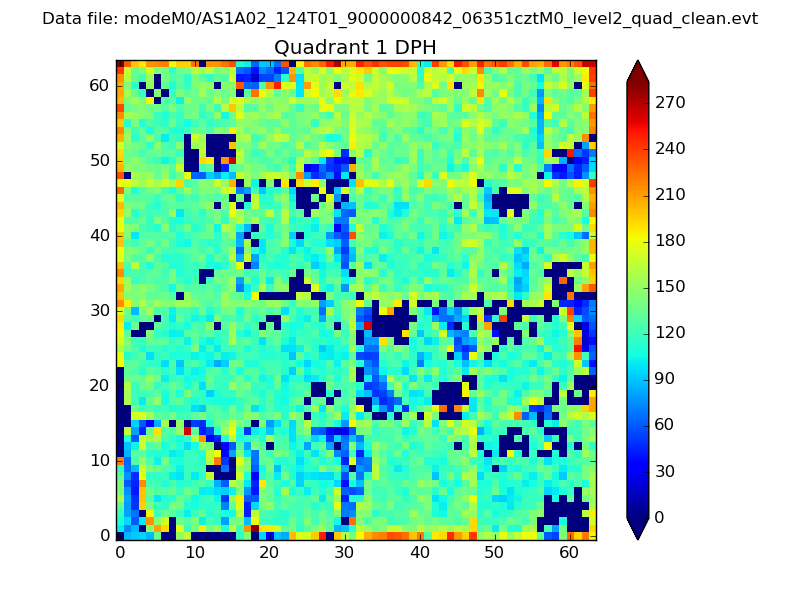 |
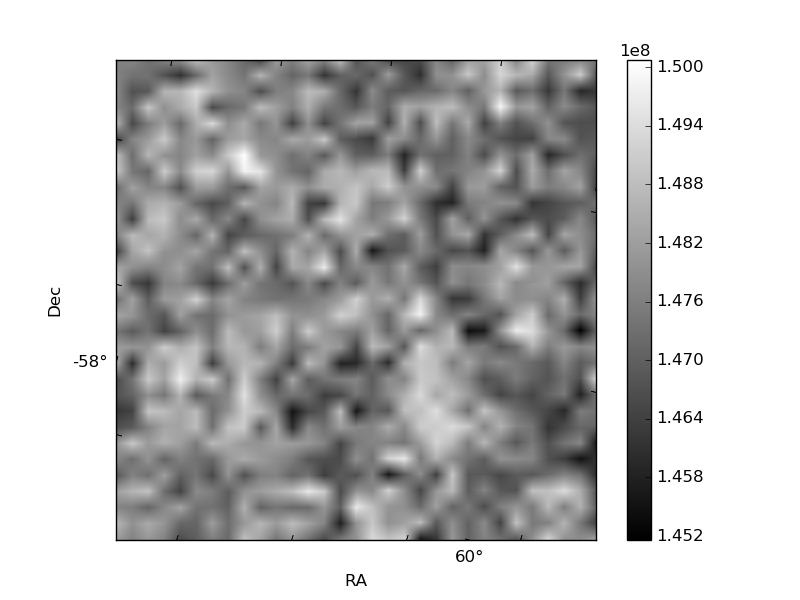
Quadrant B |
|---|---|---|---|
| Quadrant D | 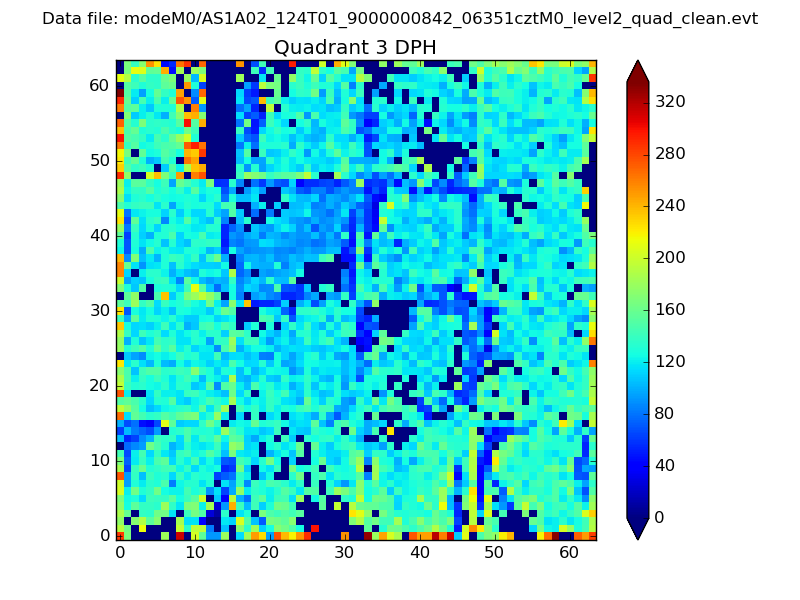 |
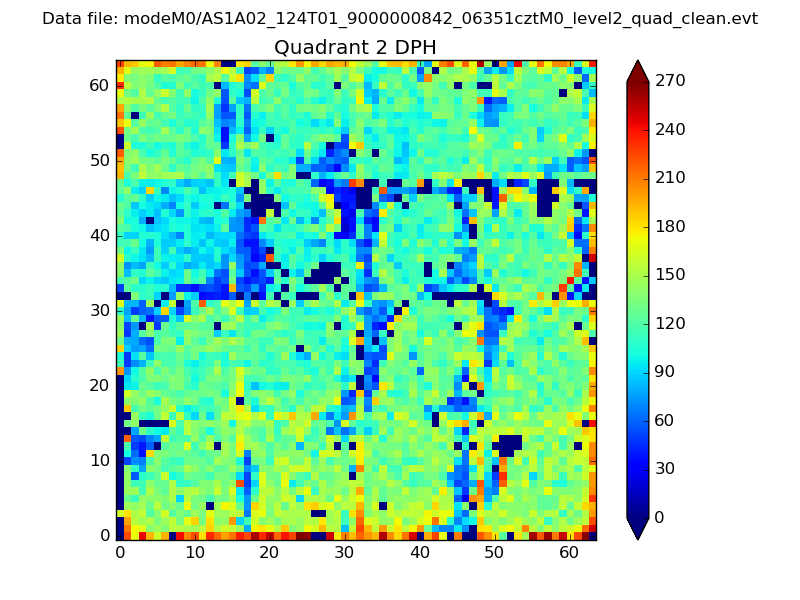 |
Quadrant C |
| Plot type | Count rate plots | Images |
|---|---|---|
| Comparison with Poisson distribution Blue bars denote a histogram of data divided into 1 sec bins. Red curve is a Poisson curve with rate = median count rate of data. |
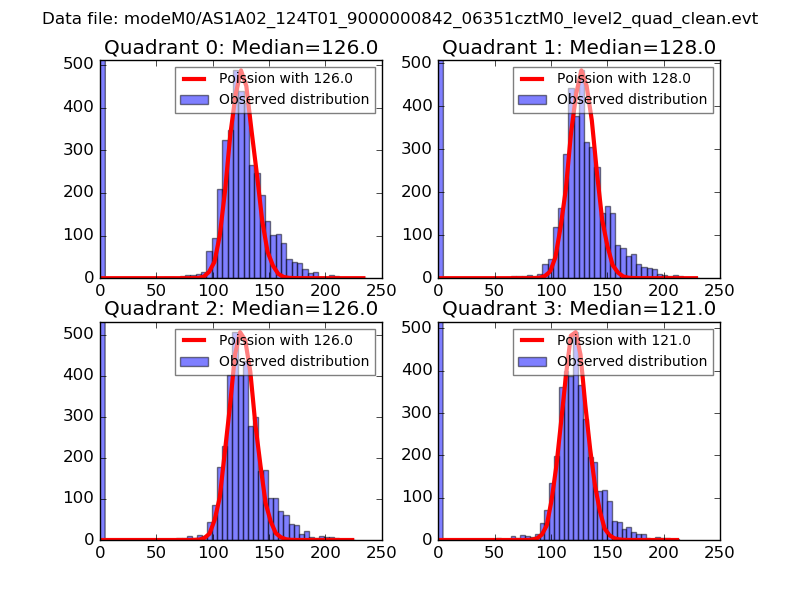 |
 |
| Quadrant-wise count rates Data is divided into 100 sec bins |
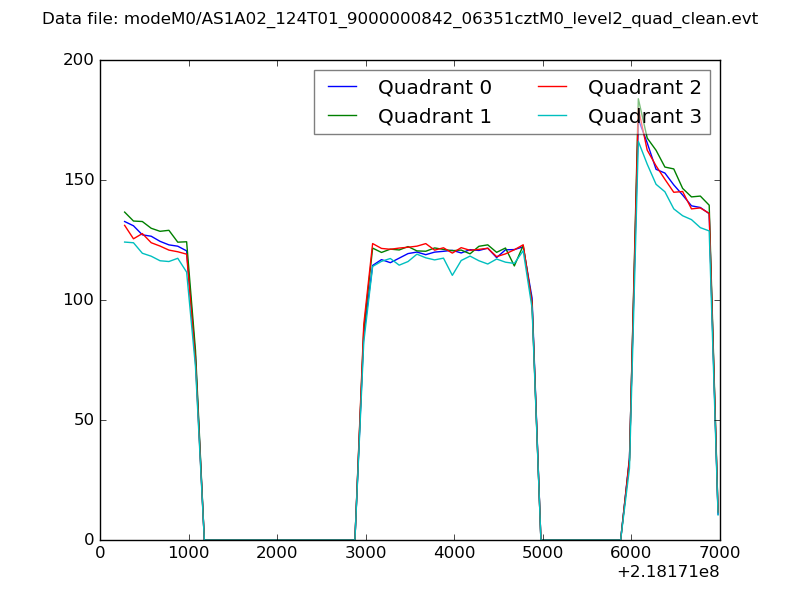 |
|
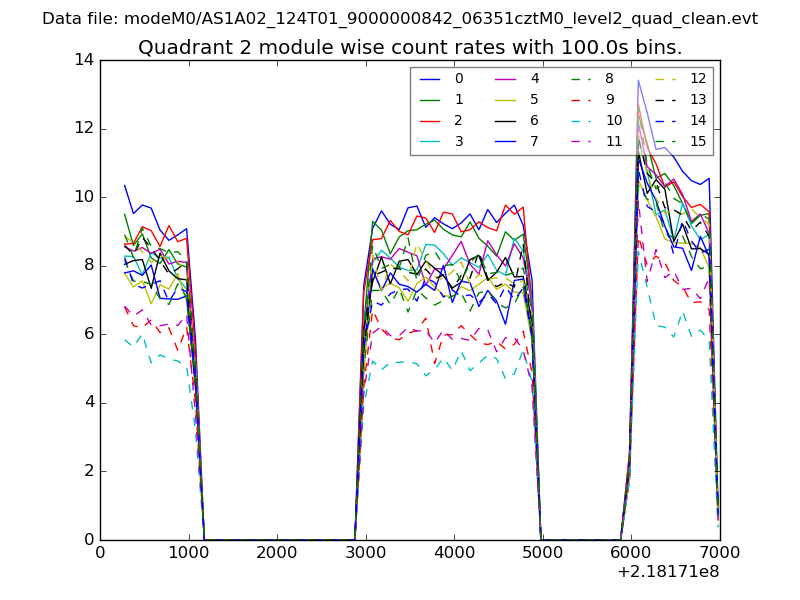
| Module-wise count rates for Quadrant A Data is divided into 100 sec bins |
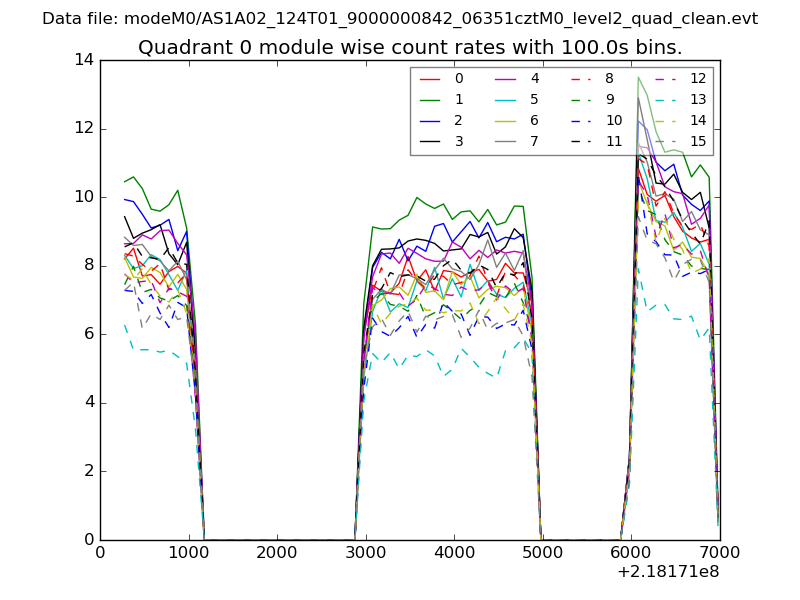 |
 |
| Module-wise count rates for Quadrant B Data is divided into 100 sec bins |
 |
 |
| Module-wise count rates for Quadrant C Data is divided into 100 sec bins |
 |
 |
| Module-wise count rates for Quadrant D Data is divided into 100 sec bins |
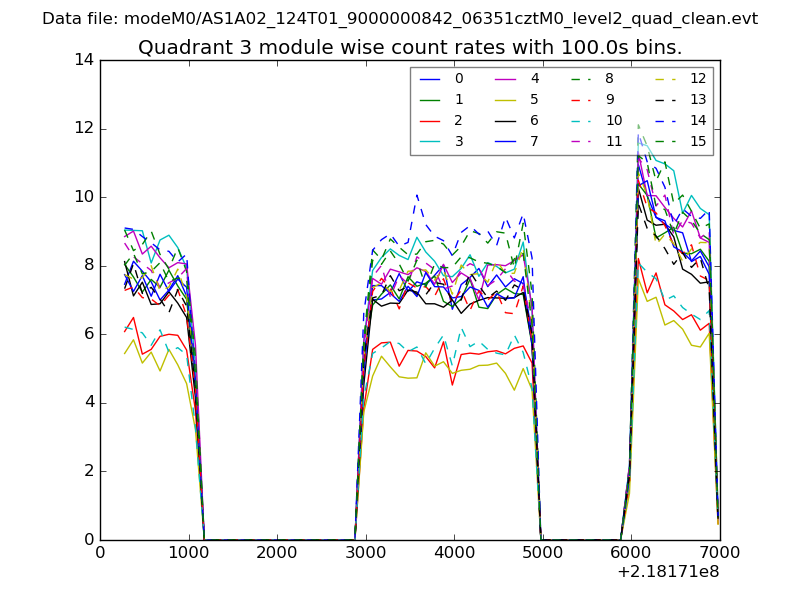 |
 |
| Parameter | Plot |
|---|---|
| CZT HV Monitor | 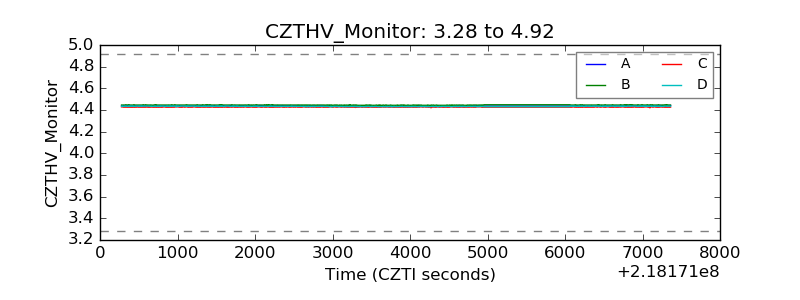 |
| D_VDD | 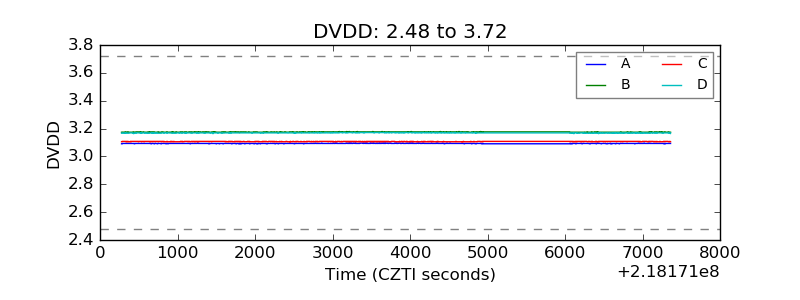 |
| Temperature 1 | 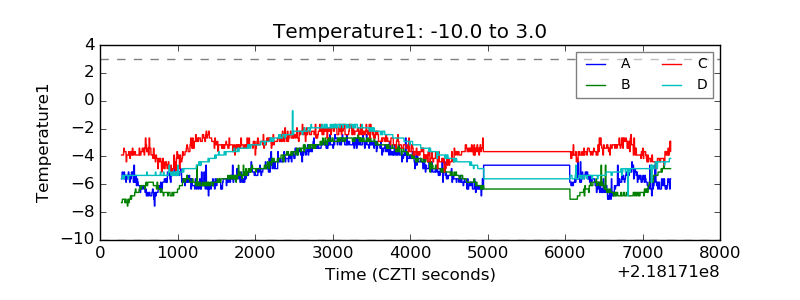 |
| Veto HV Monitor | 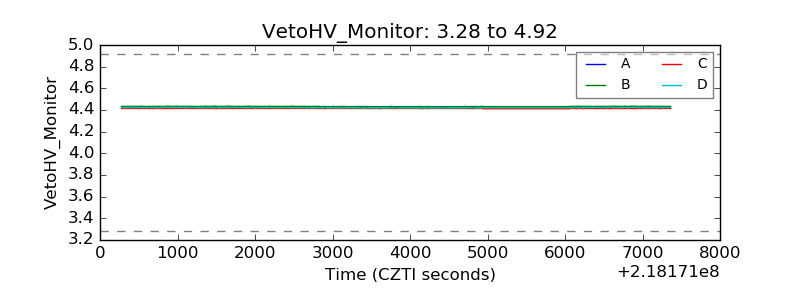 |
| Veto LLD | 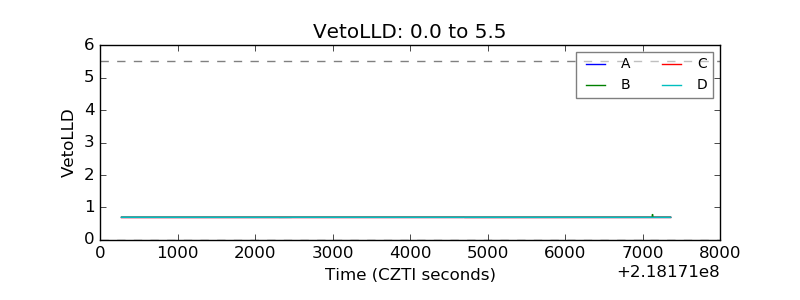 |
| Alpha Counter | 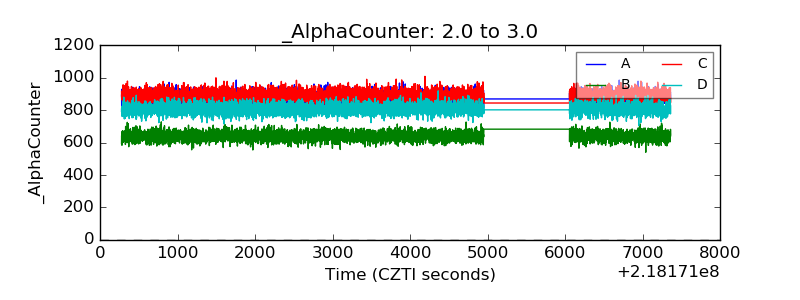 |
| _CPM_Rate | 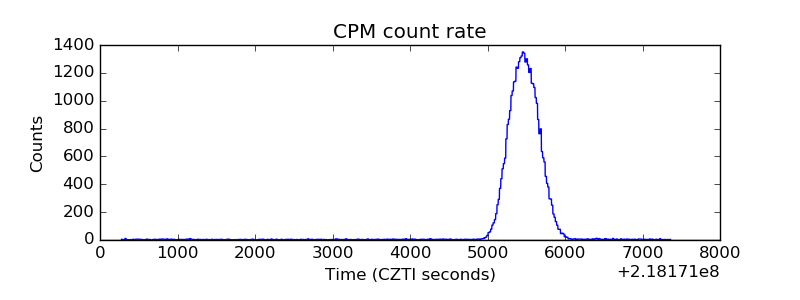 |
| CZT Counter | 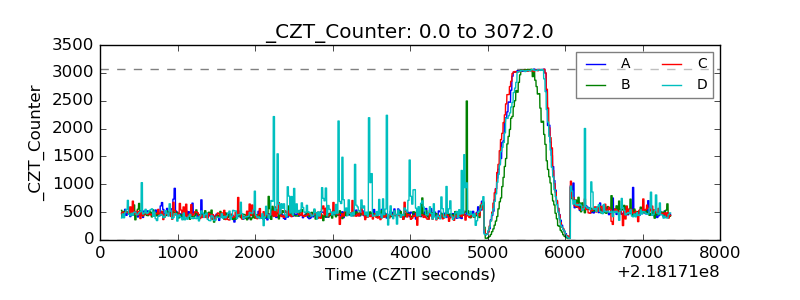 |
| +2.5 Volts monitor |  |
| +5 Volts monitor |  |
| _ROLL_ROT | 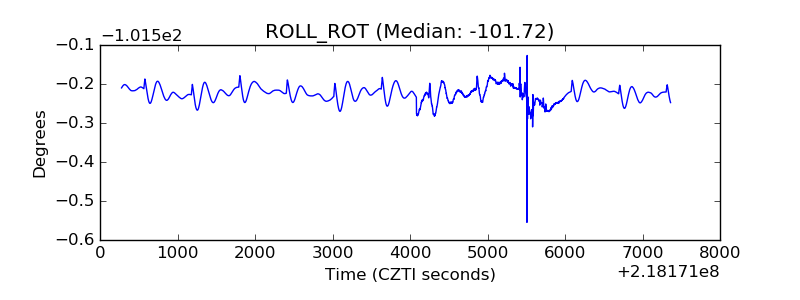 |
| _Roll_DEC | 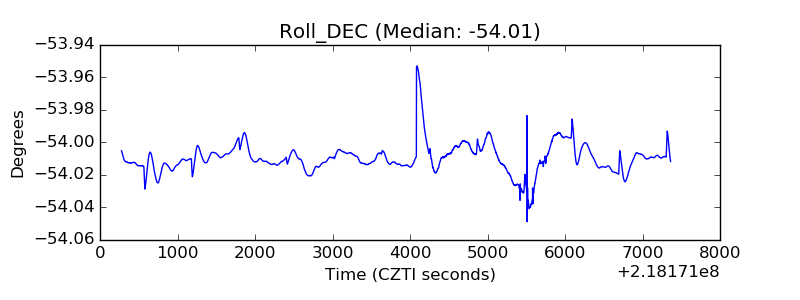 |
| _Roll_RA | 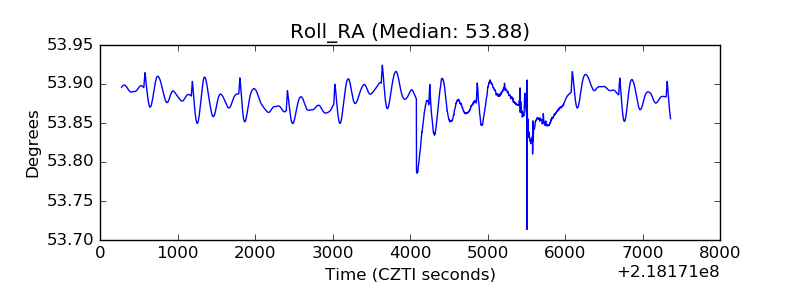 |
| Veto Counter | 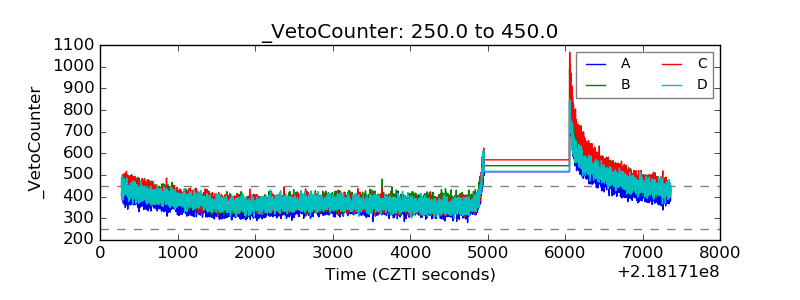 |