| Param | Original file | Final file |
|---|---|---|
| Filename | modeM0/AS1A02_124T01_9000000842_06352cztM0_level2.evt | modeM0/AS1A02_124T01_9000000842_06352cztM0_level2_quad_clean.evt |
| Size (bytes) | 614,419,200 | 77,388,480 |
| Size | 586.0 MB | 73.8 MB |
| Events in quadrant A | 3,191,488 | 511,190 |
| Events in quadrant B | 7,976,588 | 379,344 |
| Events in quadrant C | 3,222,982 | 513,517 |
| Events in quadrant D | 3,778,806 | 487,978 |
| Mode M9 | |||
|---|---|---|---|
| Quadrant | BADHDUFLAG | Total packets | Discarded packets |
| A | 0 | 19 | 0 |
| B | 0 | 19 | 0 |
| C | 0 | 19 | 0 |
| D | 0 | 20 | 0 |
| Mode M0 | |||
|---|---|---|---|
| Quadrant | BADHDUFLAG | Total packets | Discarded packets |
| A | 0 | 13549 | 3 |
| B | 0 | 27951 | 2 |
| C | 0 | 13661 | 2 |
| D | 0 | 15466 | 2 |
| Mode SS | |||
|---|---|---|---|
| Quadrant | BADHDUFLAG | Total packets | Discarded packets |
| A | 0 | 130 | 0 |
| B | 0 | 130 | 0 |
| C | 0 | 130 | 0 |
| D | 0 | 130 | 0 |
| Quadrant | Total seconds | Saturated seconds | Saturation percentage |
|---|---|---|---|
| A | 6457 | 98 | 1.517733% |
| B | 6457 | 2223 | 34.427753% |
| C | 6457 | 96 | 1.486759% |
| D | 6457 | 164 | 2.539879% |
Noise dominated data is calculated using 1-second bins in cleaned event files. If a bin has >2000 counts, and if more than 50% of those come from <1% of pixels, then it is considered to be noise-dominated and hence unusable.
| Quadrant | # 1 sec bins | Bins with >0 counts | Bins with >2000 counts | High rate bins dominated by noise | Noise dominated (total time) | Noise dominated (detector-on time) | Marked lightcurve |
|---|---|---|---|---|---|---|---|
| A | 7612 | 6458 | 0 | 0 | 0.00% | 0.00% | 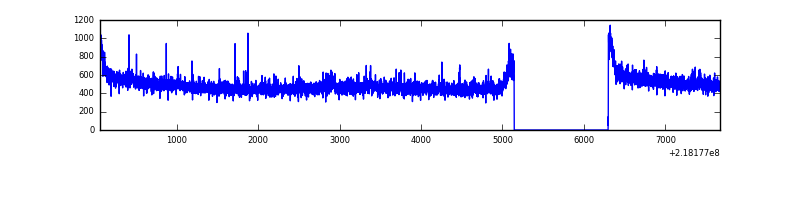 |
| B | 7612 | 6458 | 2064 | 2064 | 27.12% | 31.96% | 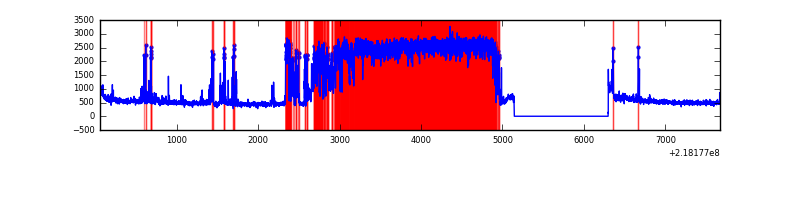 |
| C | 7612 | 6458 | 0 | 0 | 0.00% | 0.00% |  |
| D | 7612 | 6458 | 67 | 67 | 0.88% | 1.04% | 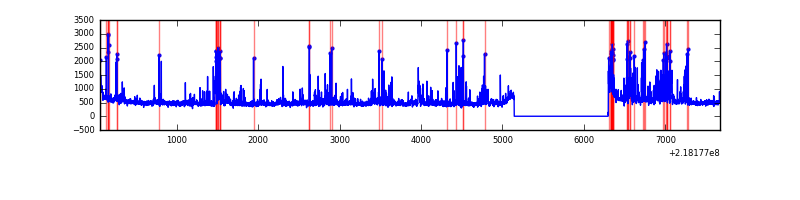 |
Top three noisy pixels from each quadrant. If the there are fewer than three noisy pixels in the level2.evt file, extra rows are filled as -1
| Pixel properties | Quadrant properties | ||||||
|---|---|---|---|---|---|---|---|
| Quadrant | DetID | PixID | Counts | Sigma | Mean | Median | Sigma |
| A | 15 | 236 | 102660 | 638.45 | 795 | 777 | 159.6 |
| A | 8 | 15 | 14035 | 83.08 | 795 | 777 | 159.6 |
| A | 12 | 194 | 8240 | 46.77 | 795 | 777 | 159.6 |
| B | 0 | 228 | 5171791 | 40629.69 | 688 | 672 | 127.3 |
| B | 4 | 80 | 67121 | 522.09 | 688 | 672 | 127.3 |
| B | 0 | 219 | 63045 | 490.06 | 688 | 672 | 127.3 |
| C | 4 | 254 | 144669 | 800.45 | 786 | 790 | 179.7 |
| C | 13 | 61 | 6118 | 29.64 | 786 | 790 | 179.7 |
| C | 8 | 222 | 5226 | 24.68 | 786 | 790 | 179.7 |
| D | 12 | 220 | 380734 | 2009.39 | 777 | 754 | 189.1 |
| D | 4 | 95 | 163569 | 860.99 | 777 | 754 | 189.1 |
| D | 2 | 152 | 62657 | 327.35 | 777 | 754 | 189.1 |
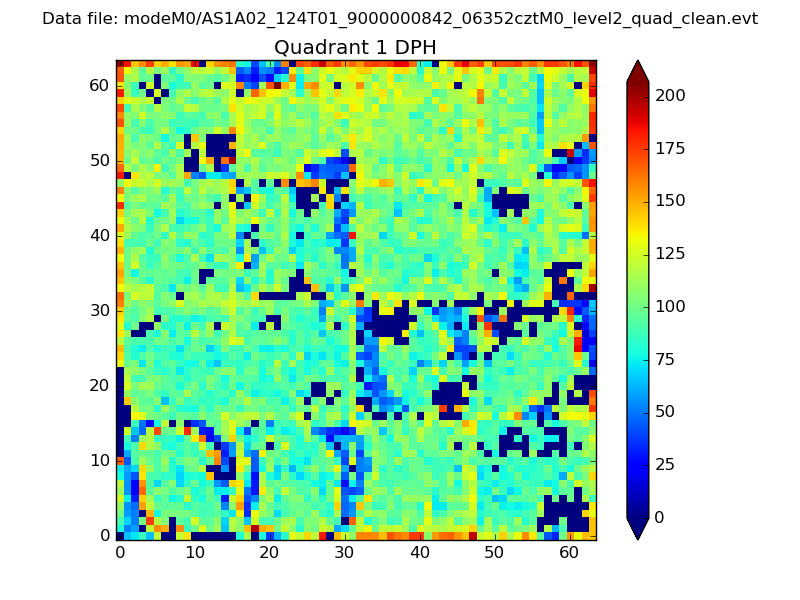
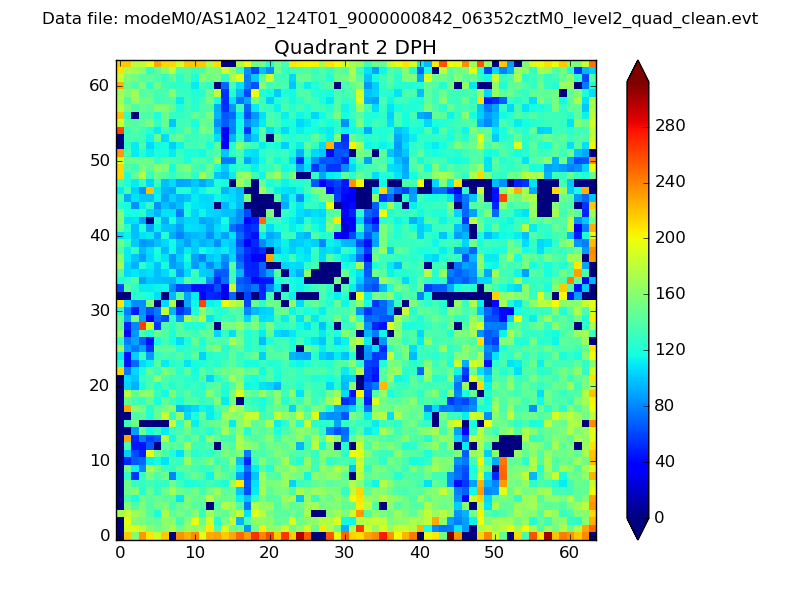
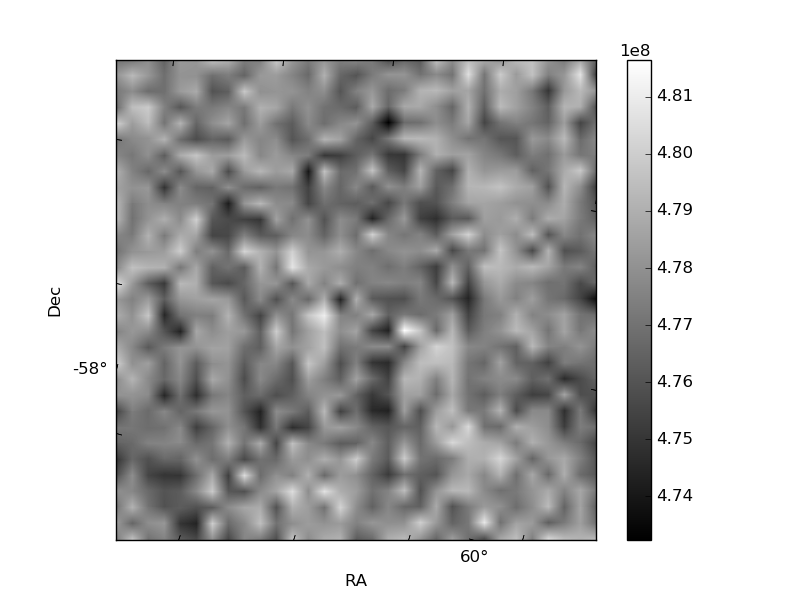
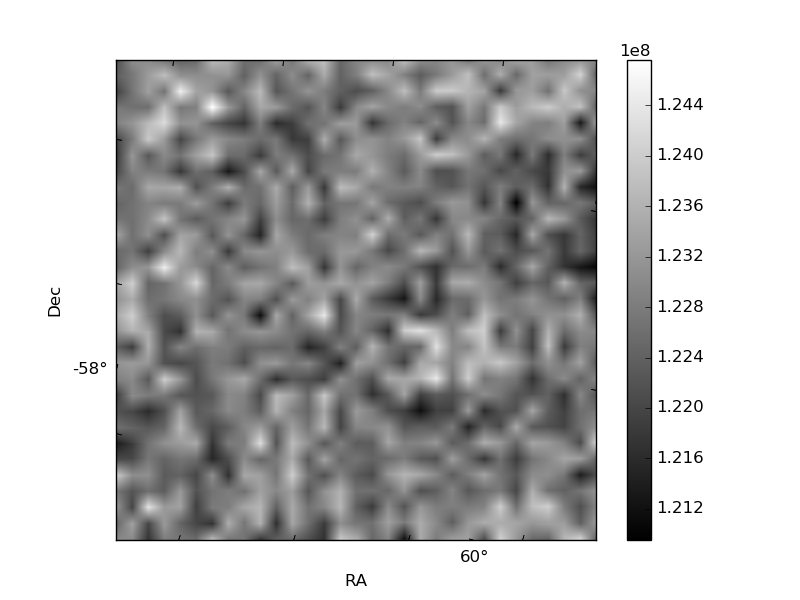
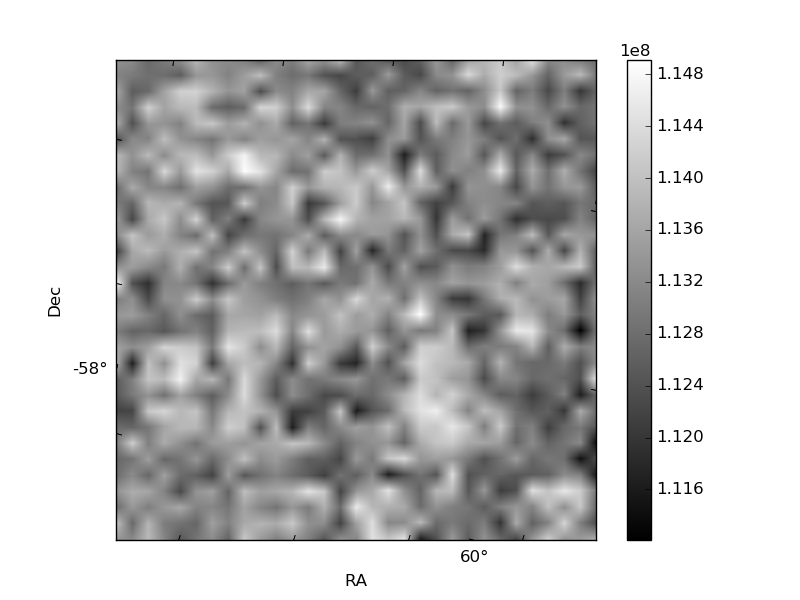
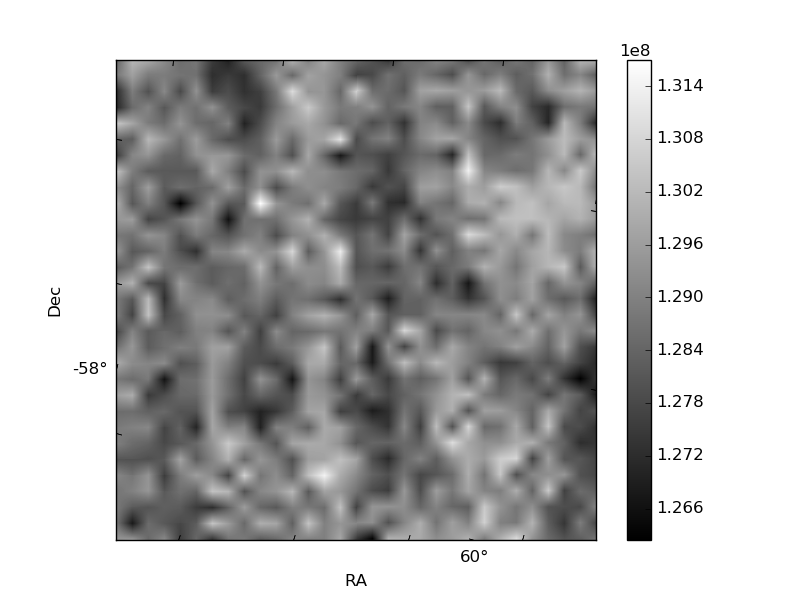
Histogram calculated using DETX and DETY for each event in the final _common_clean file
| Quadrant A | 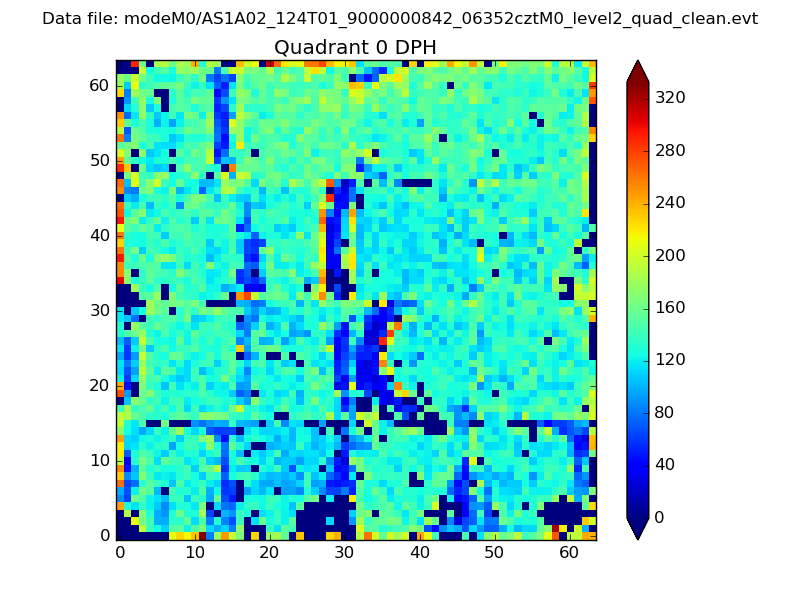 |
 |
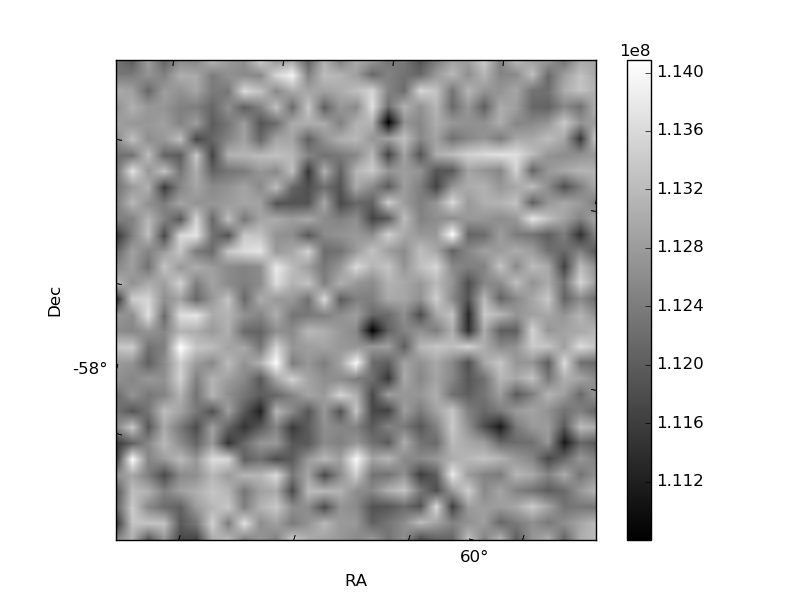
Quadrant B |
|---|---|---|---|
| Quadrant D | 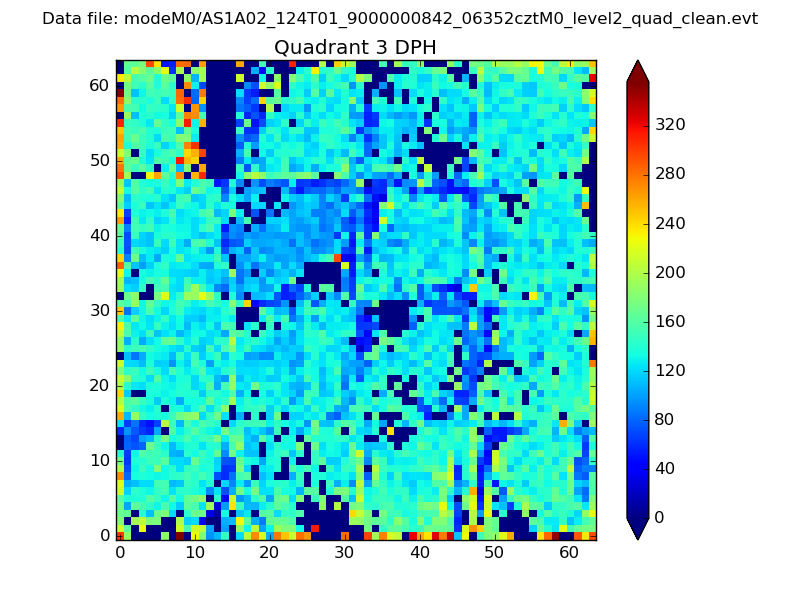 |
 |
Quadrant C |
| Plot type | Count rate plots | Images |
|---|---|---|
| Comparison with Poisson distribution Blue bars denote a histogram of data divided into 1 sec bins. Red curve is a Poisson curve with rate = median count rate of data. |
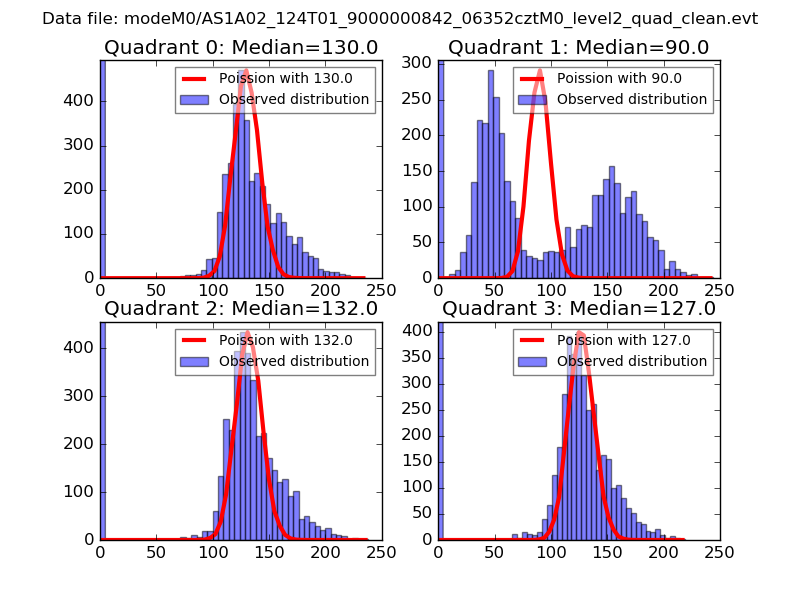 |
 |
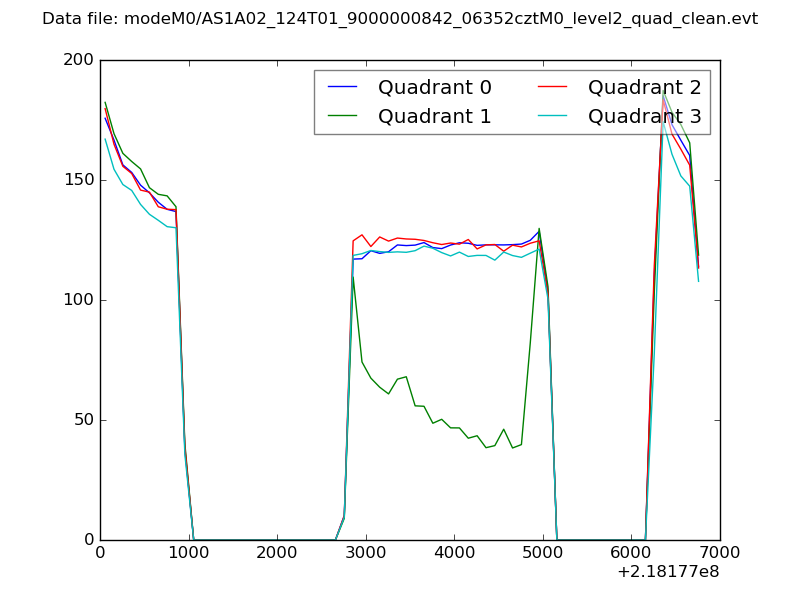
| Quadrant-wise count rates Data is divided into 100 sec bins |
 |
|
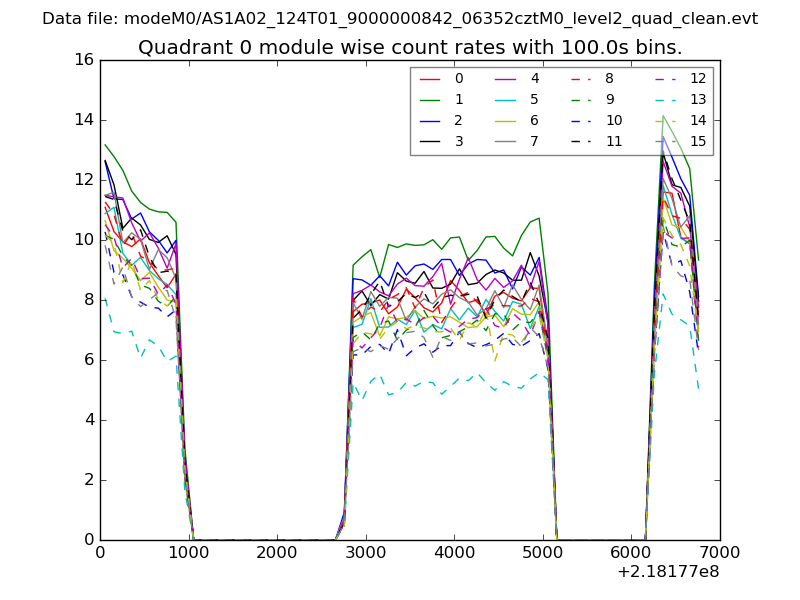
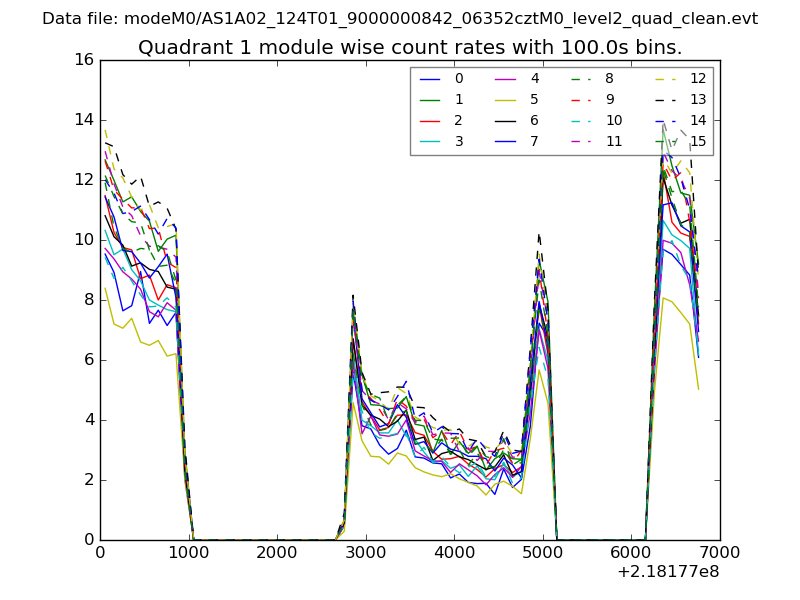
| Module-wise count rates for Quadrant A Data is divided into 100 sec bins |
 |
 |
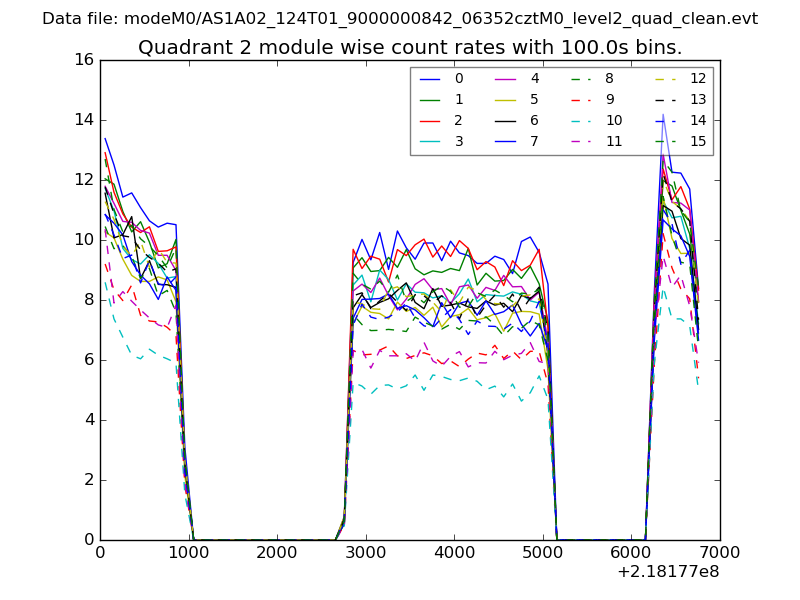
| Module-wise count rates for Quadrant B Data is divided into 100 sec bins |
 |
 |
| Module-wise count rates for Quadrant C Data is divided into 100 sec bins |
 |
 |
| Module-wise count rates for Quadrant D Data is divided into 100 sec bins |
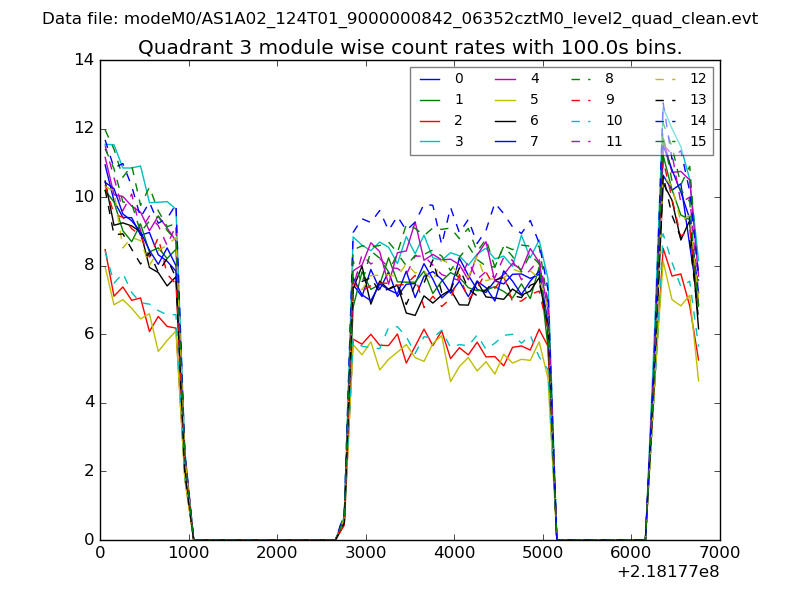 |
 |
| Parameter | Plot |
|---|---|
| CZT HV Monitor | 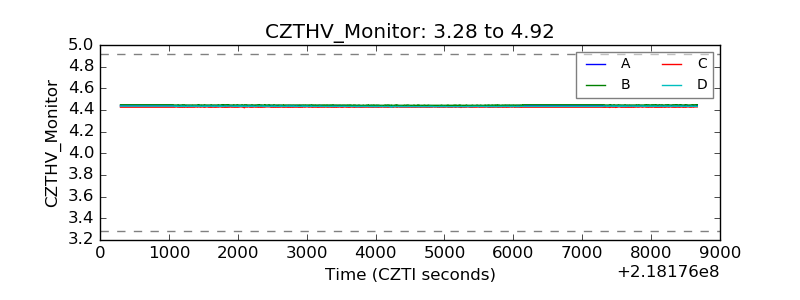 |
| D_VDD | 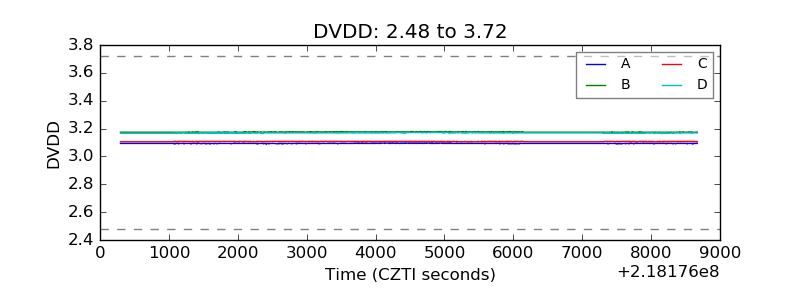 |
| Temperature 1 | 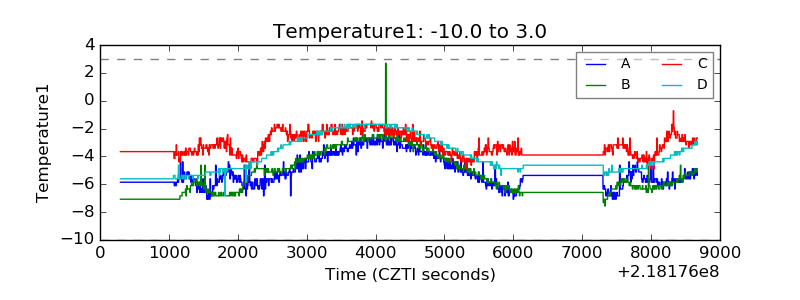 |
| Veto HV Monitor | 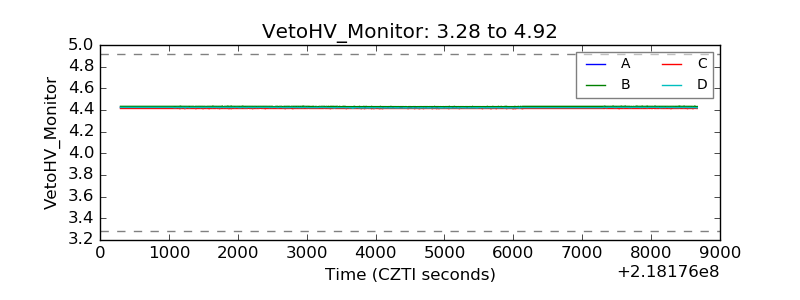 |
| Veto LLD | 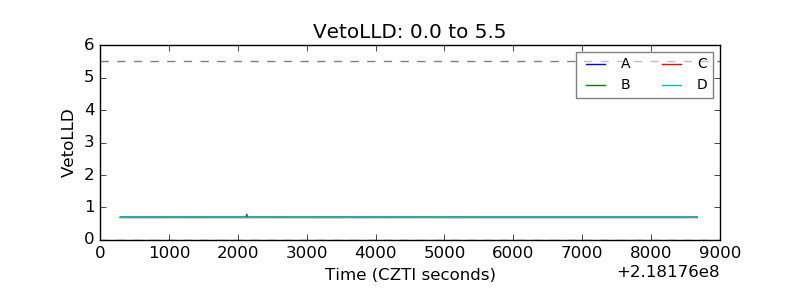 |
| Alpha Counter | 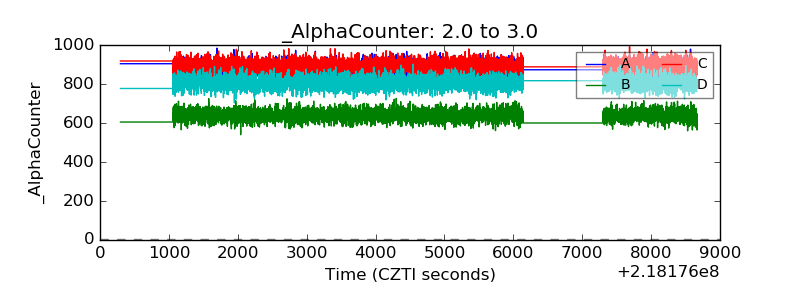 |
| _CPM_Rate | 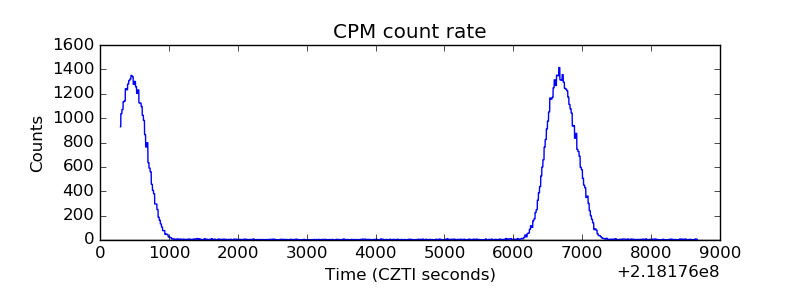 |
| CZT Counter | 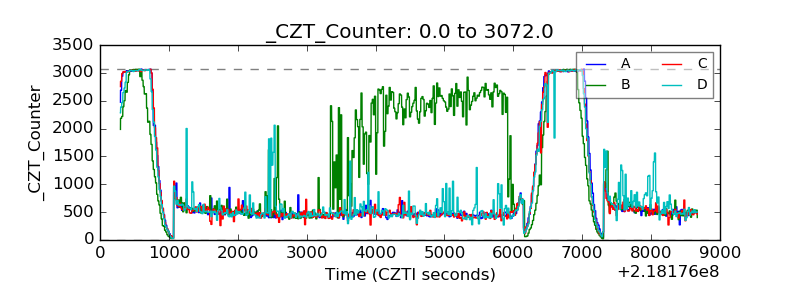 |
| +2.5 Volts monitor | 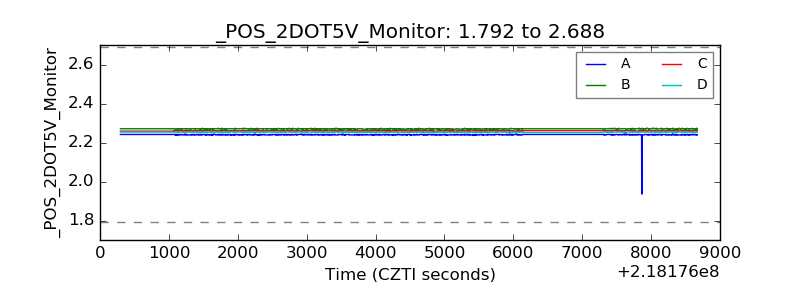 |
| +5 Volts monitor |  |
| _ROLL_ROT | 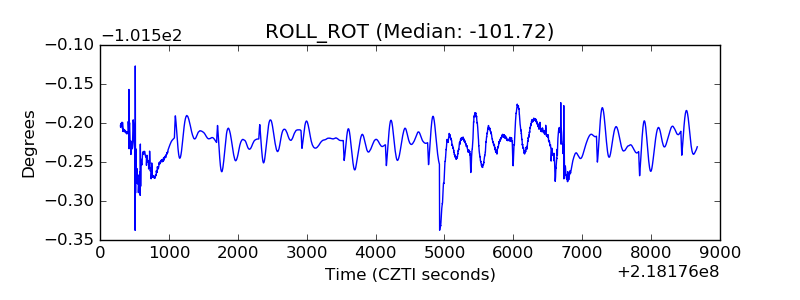 |
| _Roll_DEC | 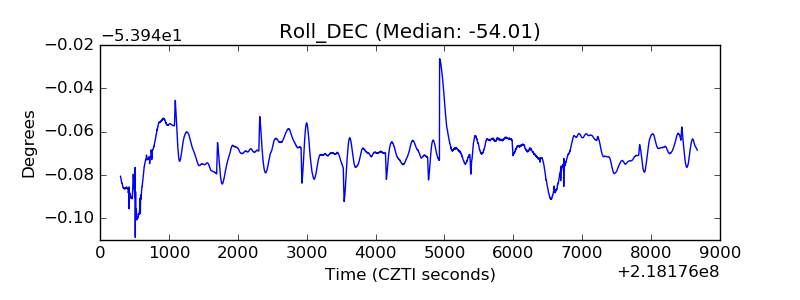 |
| _Roll_RA | 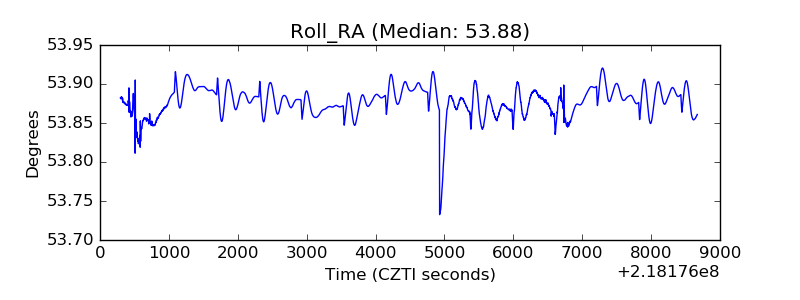 |
| Veto Counter | 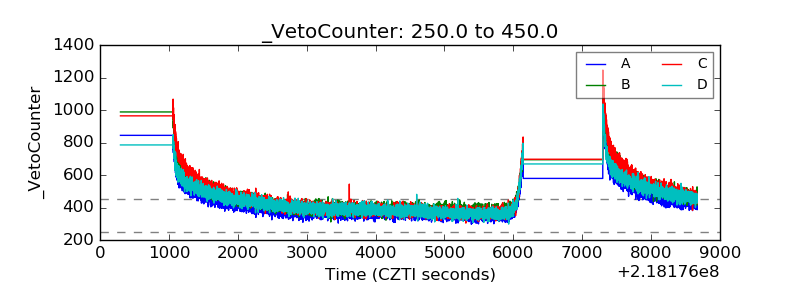 |