| Param | Original file | Final file |
|---|---|---|
| Filename | modeM0/AS1A02_124T01_9000000842_06354cztM0_level2.evt | modeM0/AS1A02_124T01_9000000842_06354cztM0_level2_quad_clean.evt |
| Size (bytes) | 546,433,920 | 67,587,840 |
| Size | 521.1 MB | 64.5 MB |
| Events in quadrant A | 4,695,022 | 400,091 |
| Events in quadrant B | 4,248,065 | 398,667 |
| Events in quadrant C | 3,140,287 | 411,712 |
| Events in quadrant D | 4,032,751 | 389,949 |
| Mode M9 | |||
|---|---|---|---|
| Quadrant | BADHDUFLAG | Total packets | Discarded packets |
| A | 0 | 13 | 0 |
| B | 0 | 13 | 0 |
| C | 0 | 13 | 0 |
| D | 0 | 14 | 0 |
| Mode M0 | |||
|---|---|---|---|
| Quadrant | BADHDUFLAG | Total packets | Discarded packets |
| A | 0 | 18525 | 3 |
| B | 0 | 16512 | 2 |
| C | 0 | 13436 | 2 |
| D | 0 | 16026 | 2 |
| Mode SS | |||
|---|---|---|---|
| Quadrant | BADHDUFLAG | Total packets | Discarded packets |
| A | 0 | 128 | 0 |
| B | 0 | 128 | 0 |
| C | 0 | 128 | 0 |
| D | 0 | 128 | 0 |
| Quadrant | Total seconds | Saturated seconds | Saturation percentage |
|---|---|---|---|
| A | 6391 | 205 | 3.207636% |
| B | 6391 | 466 | 7.291504% |
| C | 6391 | 106 | 1.658582% |
| D | 6391 | 190 | 2.972931% |
Noise dominated data is calculated using 1-second bins in cleaned event files. If a bin has >2000 counts, and if more than 50% of those come from <1% of pixels, then it is considered to be noise-dominated and hence unusable.
| Quadrant | # 1 sec bins | Bins with >0 counts | Bins with >2000 counts | High rate bins dominated by noise | Noise dominated (total time) | Noise dominated (detector-on time) | Marked lightcurve |
|---|---|---|---|---|---|---|---|
| A | 7636 | 6392 | 12 | 12 | 0.16% | 0.19% | 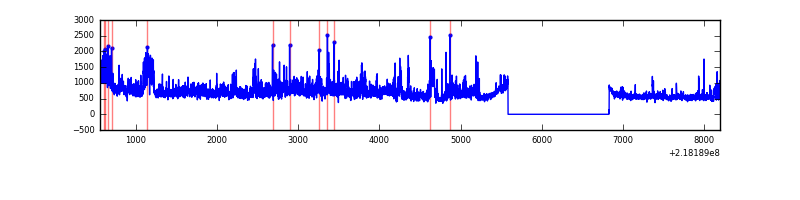 |
| B | 7636 | 6392 | 338 | 338 | 4.43% | 5.29% | 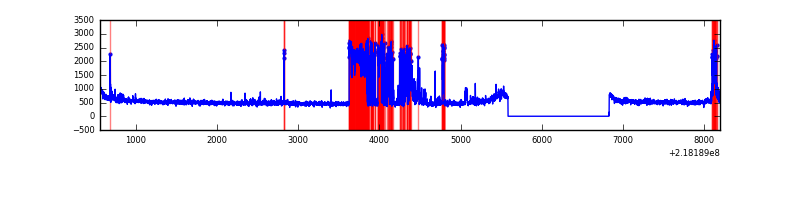 |
| C | 7636 | 6392 | 0 | 0 | 0.00% | 0.00% | 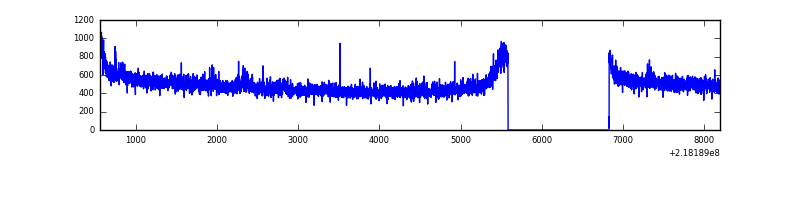 |
| D | 7636 | 6392 | 68 | 68 | 0.89% | 1.06% | 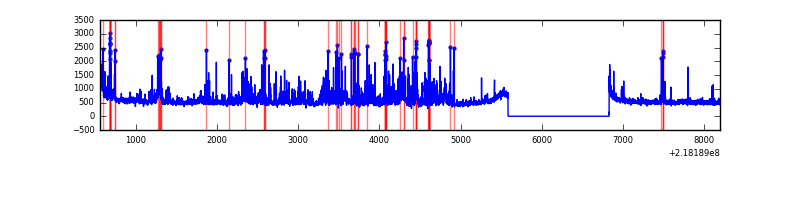 |
Top three noisy pixels from each quadrant. If the there are fewer than three noisy pixels in the level2.evt file, extra rows are filled as -1
| Pixel properties | Quadrant properties | ||||||
|---|---|---|---|---|---|---|---|
| Quadrant | DetID | PixID | Counts | Sigma | Mean | Median | Sigma |
| A | 8 | 15 | 1152500 | 7235.7 | 801 | 785 | 159.2 |
| A | 15 | 236 | 433529 | 2718.73 | 801 | 785 | 159.2 |
| A | 15 | 174 | 11318 | 66.17 | 801 | 785 | 159.2 |
| B | 0 | 228 | 1048297 | 7040.38 | 799 | 782 | 148.8 |
| B | 0 | 219 | 48737 | 322.31 | 799 | 782 | 148.8 |
| B | 15 | 204 | 43709 | 288.51 | 799 | 782 | 148.8 |
| C | 4 | 254 | 46128 | 253.73 | 789 | 794 | 178.7 |
| C | 1 | 16 | 8059 | 40.66 | 789 | 794 | 178.7 |
| C | 13 | 61 | 6192 | 30.21 | 789 | 794 | 178.7 |
| D | 12 | 220 | 509307 | 2670.62 | 786 | 761 | 190.4 |
| D | 4 | 95 | 248048 | 1298.62 | 786 | 761 | 190.4 |
| D | 11 | 241 | 79206 | 411.95 | 786 | 761 | 190.4 |
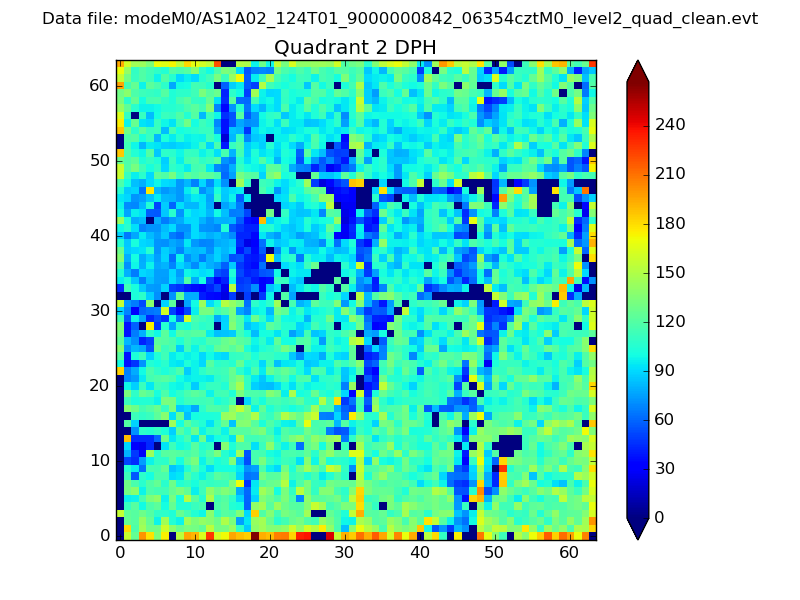
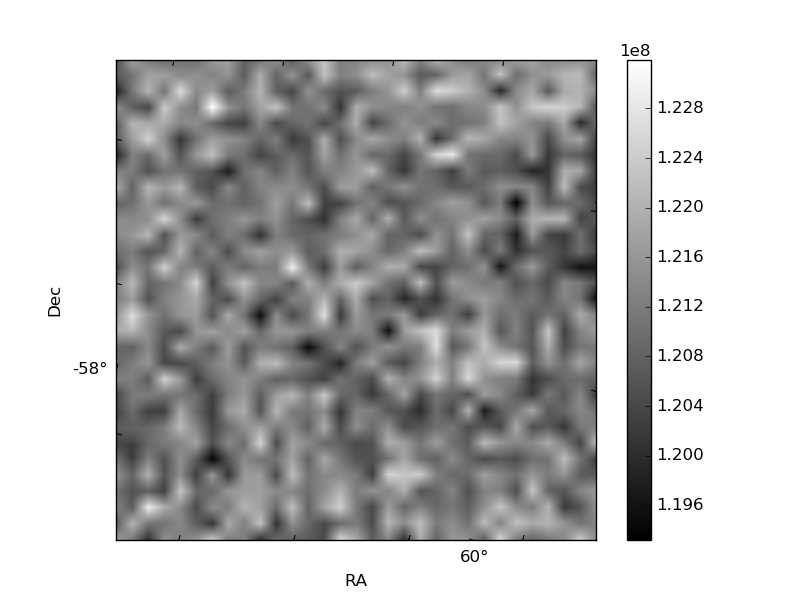
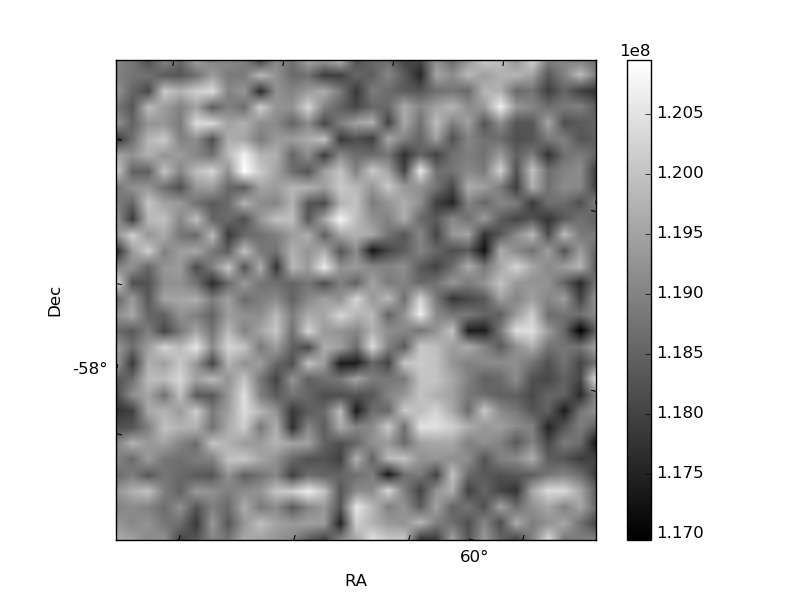
Histogram calculated using DETX and DETY for each event in the final _common_clean file
| Quadrant A | 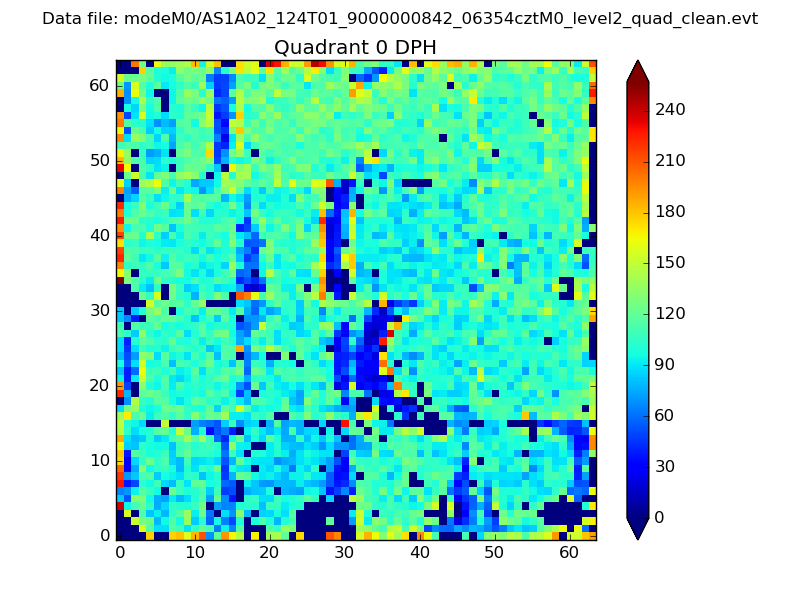 |
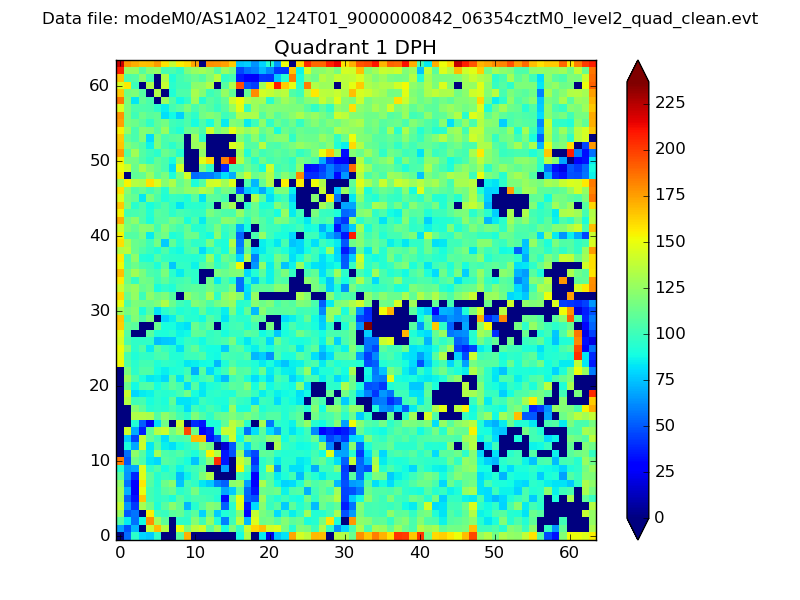 |
Quadrant B |
|---|---|---|---|
| Quadrant D | 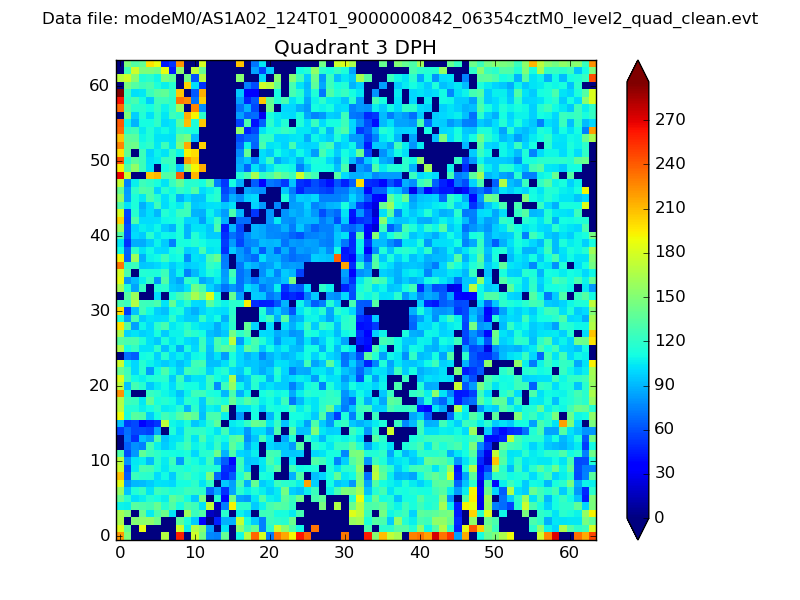 |
 |
Quadrant C |
| Plot type | Count rate plots | Images |
|---|---|---|
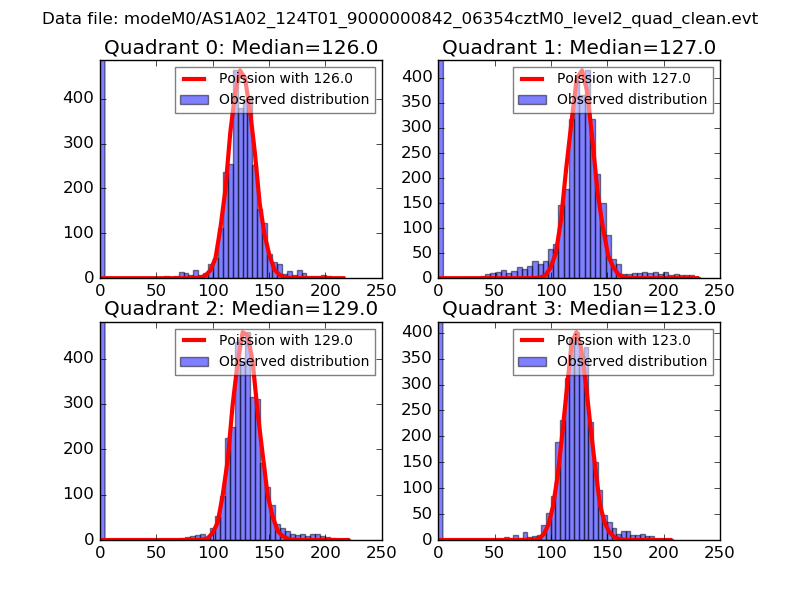
| Comparison with Poisson distribution Blue bars denote a histogram of data divided into 1 sec bins. Red curve is a Poisson curve with rate = median count rate of data. |
 |
 |
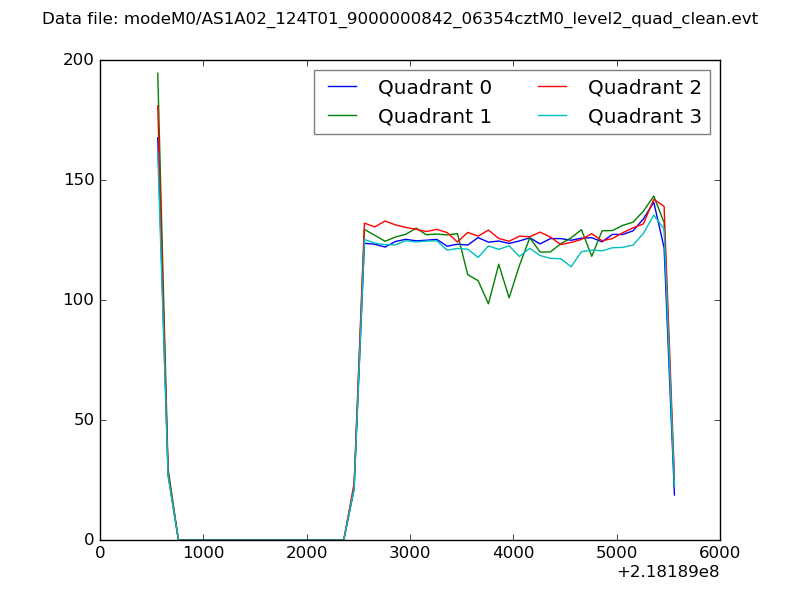
| Quadrant-wise count rates Data is divided into 100 sec bins |
 |
|
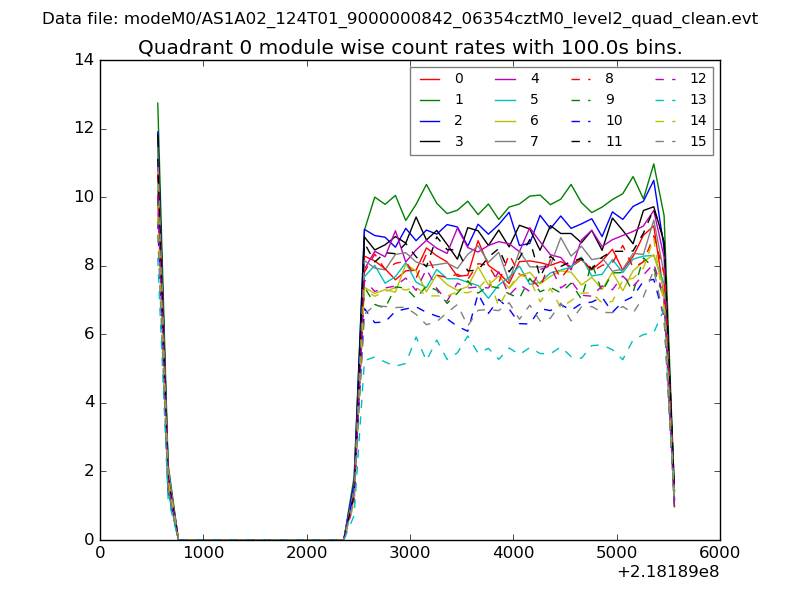
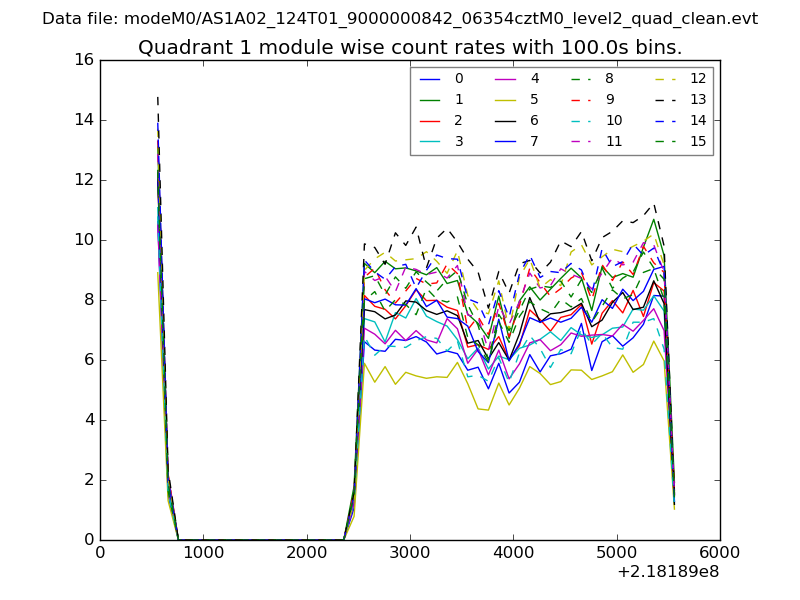
| Module-wise count rates for Quadrant A Data is divided into 100 sec bins |
 |
 |
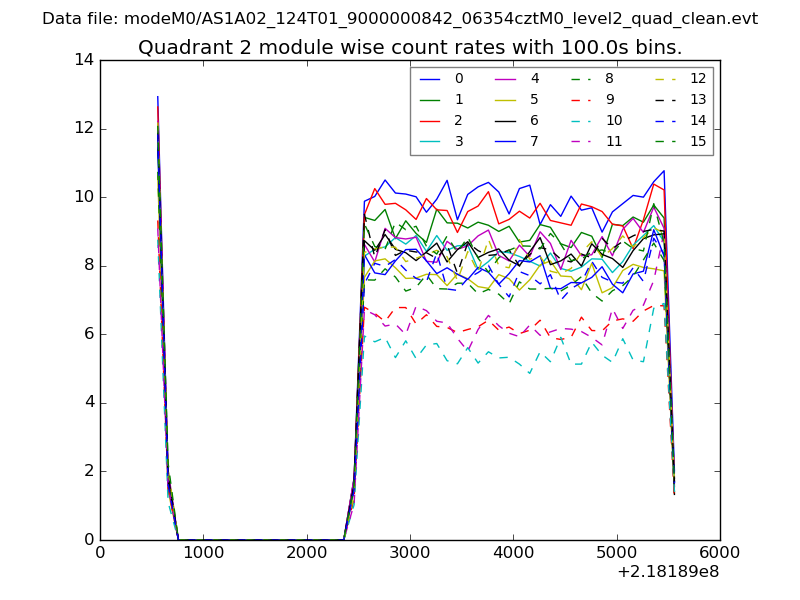
| Module-wise count rates for Quadrant B Data is divided into 100 sec bins |
 |
 |
| Module-wise count rates for Quadrant C Data is divided into 100 sec bins |
 |
 |
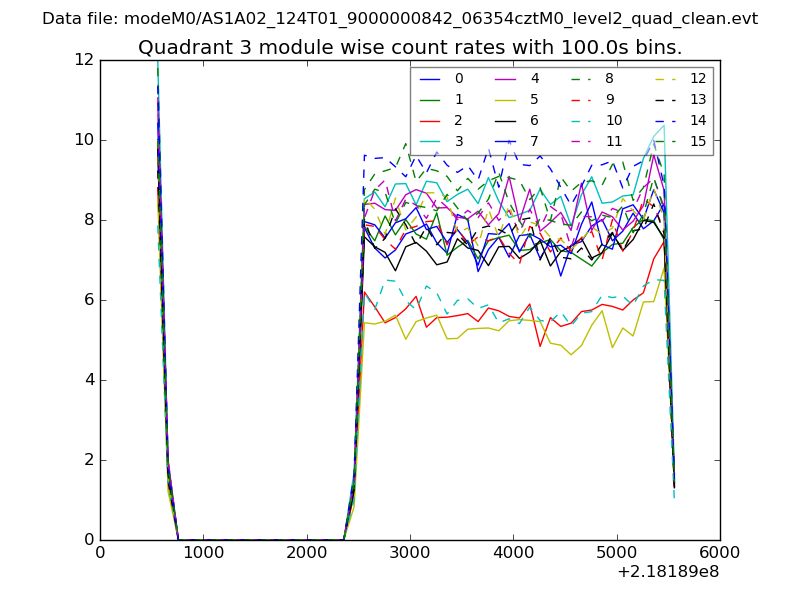
| Module-wise count rates for Quadrant D Data is divided into 100 sec bins |
 |
 |
| Parameter | Plot |
|---|---|
| CZT HV Monitor | 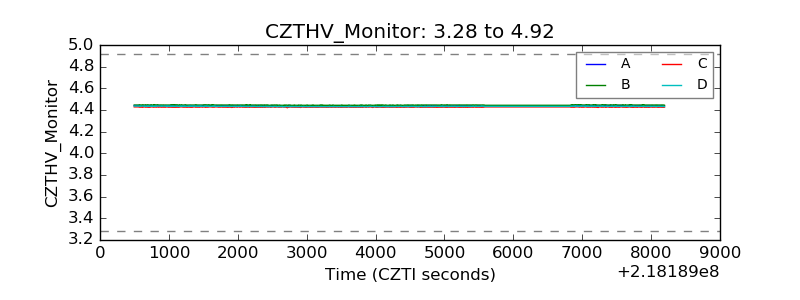 |
| D_VDD | 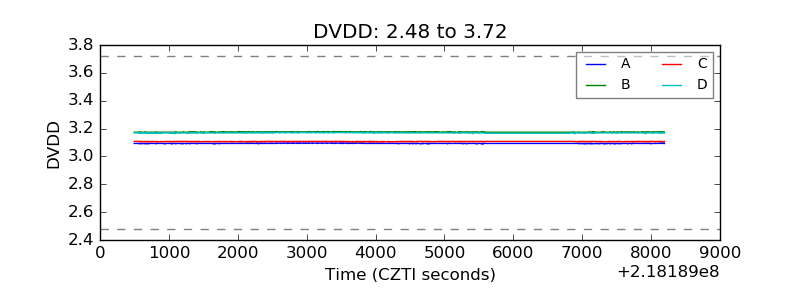 |
| Temperature 1 | 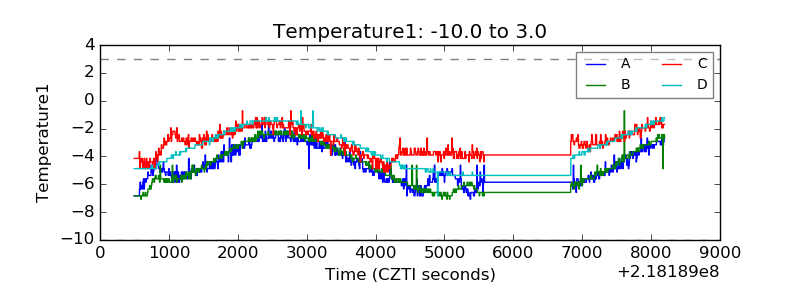 |
| Veto HV Monitor | 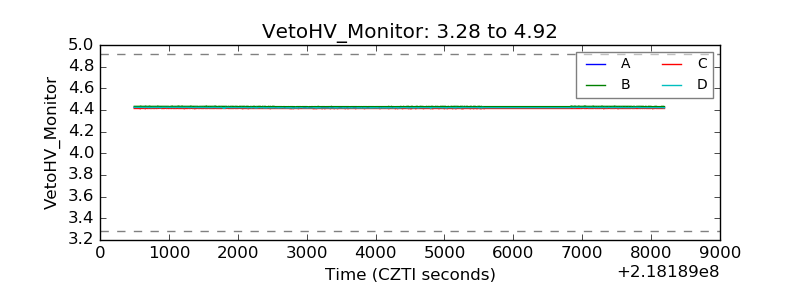 |
| Veto LLD | 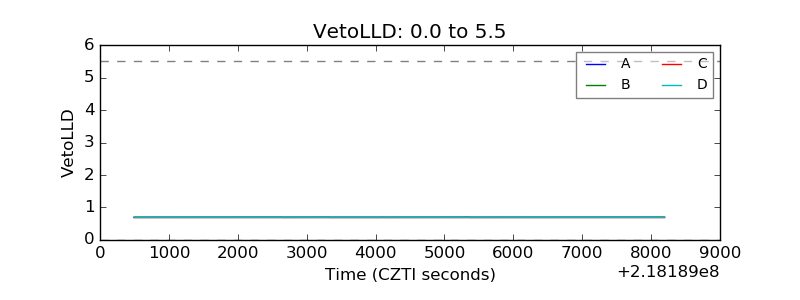 |
| Alpha Counter | 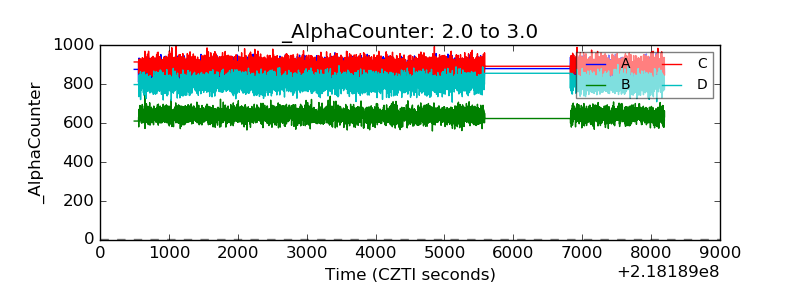 |
| _CPM_Rate | 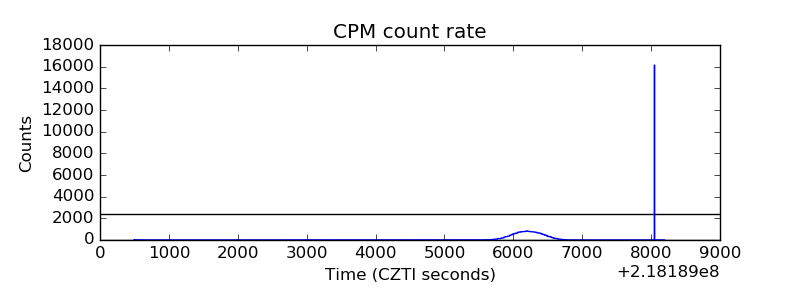 |
| CZT Counter | 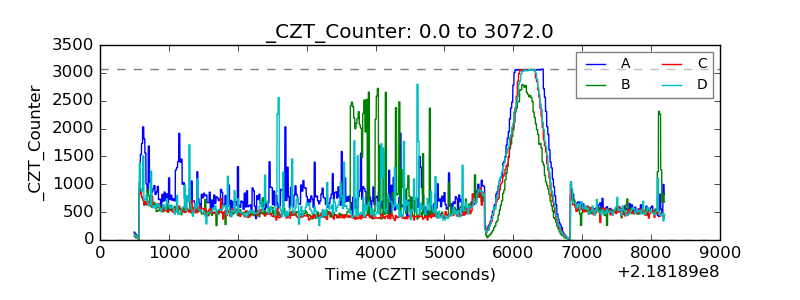 |
| +2.5 Volts monitor | 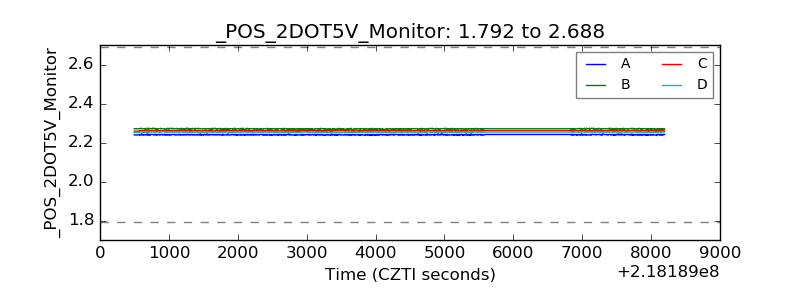 |
| +5 Volts monitor |  |
| _ROLL_ROT | 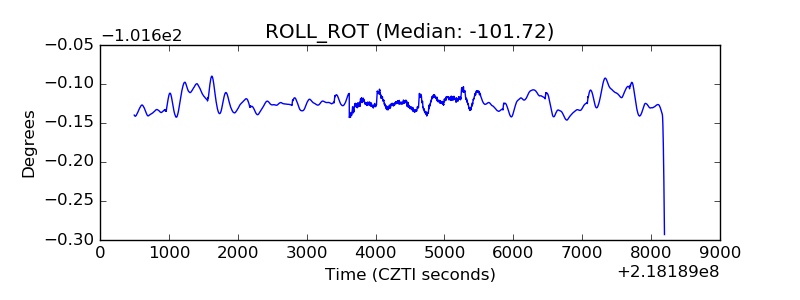 |
| _Roll_DEC | 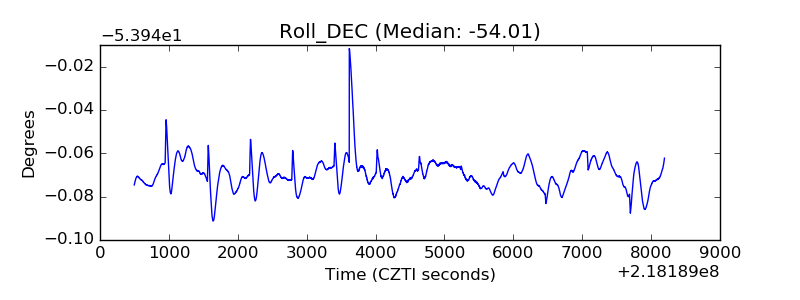 |
| _Roll_RA | 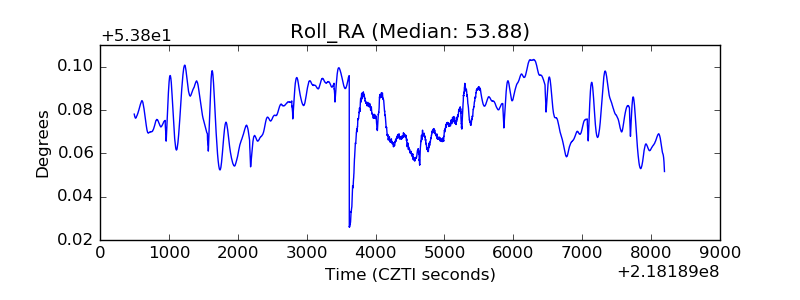 |
| Veto Counter | 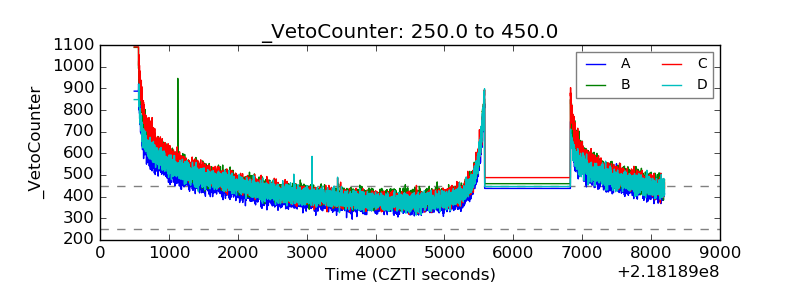 |