| Param | Original file | Final file |
|---|---|---|
| Filename | modeM0/AS1A02_124T01_9000000842_06356cztM0_level2.evt | modeM0/AS1A02_124T01_9000000842_06356cztM0_level2_quad_clean.evt |
| Size (bytes) | 530,196,480 | 93,666,240 |
| Size | 505.6 MB | 89.3 MB |
| Events in quadrant A | 3,965,566 | 585,738 |
| Events in quadrant B | 3,564,623 | 599,622 |
| Events in quadrant C | 3,257,639 | 592,195 |
| Events in quadrant D | 4,790,347 | 567,637 |
| Mode M9 | |||
|---|---|---|---|
| Quadrant | BADHDUFLAG | Total packets | Discarded packets |
| A | 0 | 19 | 0 |
| B | 0 | 19 | 0 |
| C | 0 | 19 | 0 |
| D | 0 | 20 | 0 |
| Mode M0 | |||
|---|---|---|---|
| Quadrant | BADHDUFLAG | Total packets | Discarded packets |
| A | 0 | 16178 | 3 |
| B | 0 | 15234 | 2 |
| C | 0 | 14585 | 2 |
| D | 0 | 19018 | 2 |
| Mode SS | |||
|---|---|---|---|
| Quadrant | BADHDUFLAG | Total packets | Discarded packets |
| A | 0 | 144 | 0 |
| B | 0 | 144 | 0 |
| C | 0 | 144 | 0 |
| D | 0 | 144 | 0 |
| Quadrant | Total seconds | Saturated seconds | Saturation percentage |
|---|---|---|---|
| A | 7052 | 209 | 2.963698% |
| B | 7052 | 191 | 2.708452% |
| C | 7052 | 112 | 1.588202% |
| D | 7052 | 294 | 4.169030% |
Noise dominated data is calculated using 1-second bins in cleaned event files. If a bin has >2000 counts, and if more than 50% of those come from <1% of pixels, then it is considered to be noise-dominated and hence unusable.
| Quadrant | # 1 sec bins | Bins with >0 counts | Bins with >2000 counts | High rate bins dominated by noise | Noise dominated (total time) | Noise dominated (detector-on time) | Marked lightcurve |
|---|---|---|---|---|---|---|---|
| A | 7947 | 7053 | 64 | 64 | 0.81% | 0.91% | 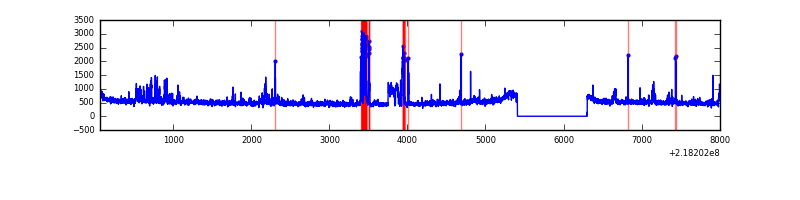 |
| B | 7947 | 7053 | 40 | 40 | 0.50% | 0.57% | 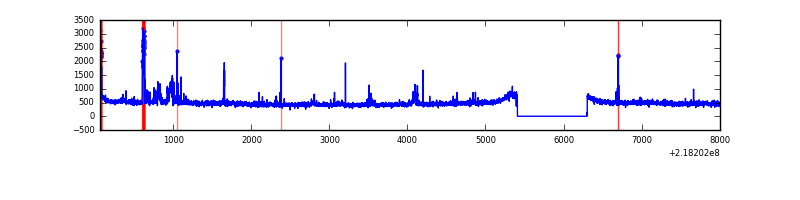 |
| C | 7947 | 7053 | 0 | 0 | 0.00% | 0.00% | 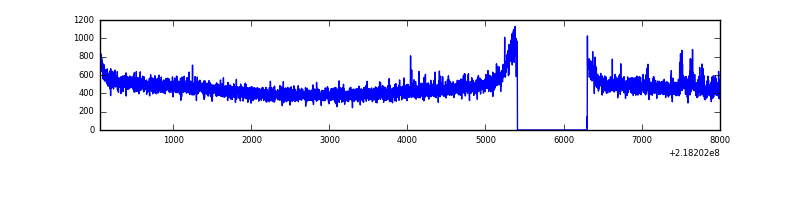 |
| D | 7947 | 7053 | 120 | 120 | 1.51% | 1.70% | 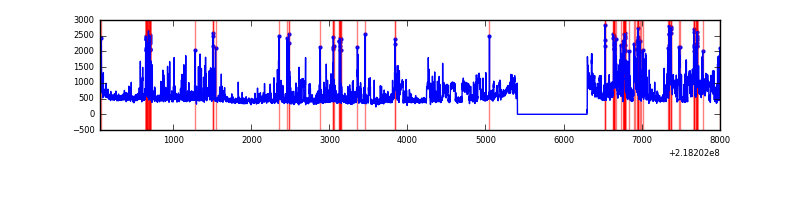 |
Top three noisy pixels from each quadrant. If the there are fewer than three noisy pixels in the level2.evt file, extra rows are filled as -1
| Pixel properties | Quadrant properties | ||||||
|---|---|---|---|---|---|---|---|
| Quadrant | DetID | PixID | Counts | Sigma | Mean | Median | Sigma |
| A | 15 | 174 | 273488 | 1612.45 | 833 | 813 | 169.1 |
| A | 15 | 236 | 245279 | 1445.64 | 833 | 813 | 169.1 |
| A | 8 | 15 | 206965 | 1219.07 | 833 | 813 | 169.1 |
| B | 0 | 228 | 138603 | 861.98 | 838 | 817 | 159.8 |
| B | 4 | 81 | 80185 | 496.52 | 838 | 817 | 159.8 |
| B | 0 | 219 | 53845 | 331.74 | 838 | 817 | 159.8 |
| C | 4 | 254 | 72696 | 383.95 | 814 | 816 | 187.2 |
| C | 13 | 61 | 6541 | 30.58 | 814 | 816 | 187.2 |
| C | 1 | 16 | 5755 | 26.38 | 814 | 816 | 187.2 |
| D | 11 | 241 | 627298 | 3184.14 | 811 | 787 | 196.8 |
| D | 12 | 220 | 613704 | 3115.05 | 811 | 787 | 196.8 |
| D | 10 | 15 | 121583 | 613.93 | 811 | 787 | 196.8 |
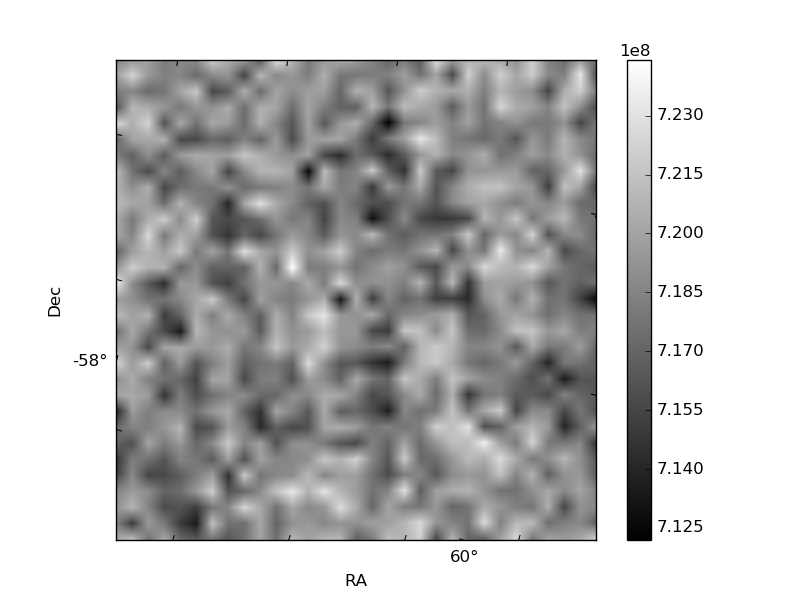
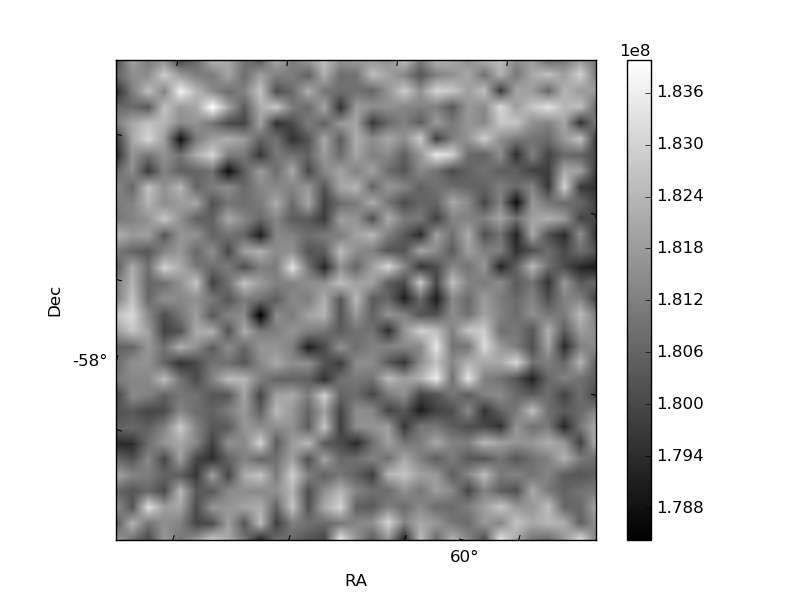
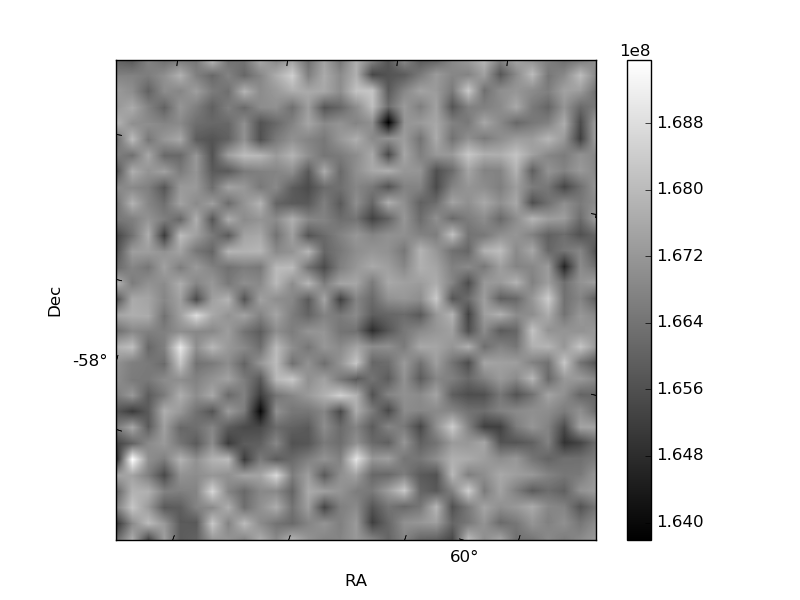
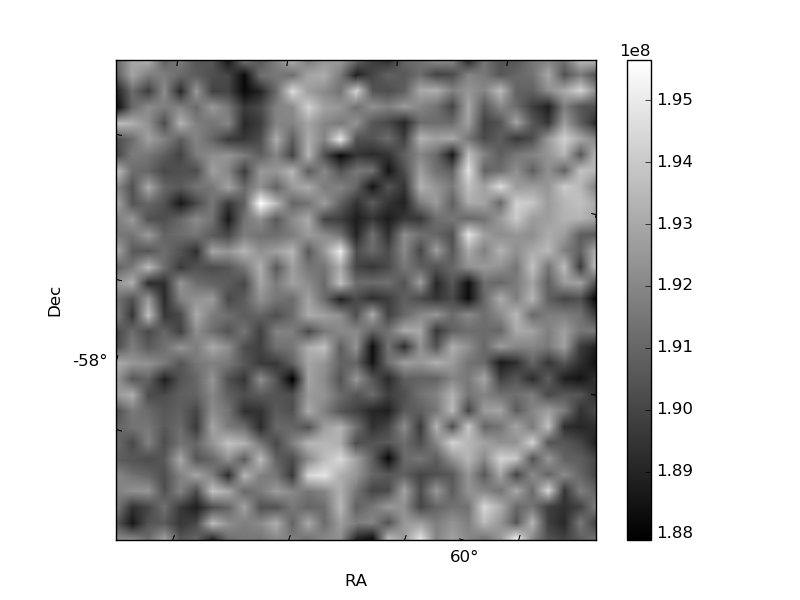
Histogram calculated using DETX and DETY for each event in the final _common_clean file
| Quadrant A | 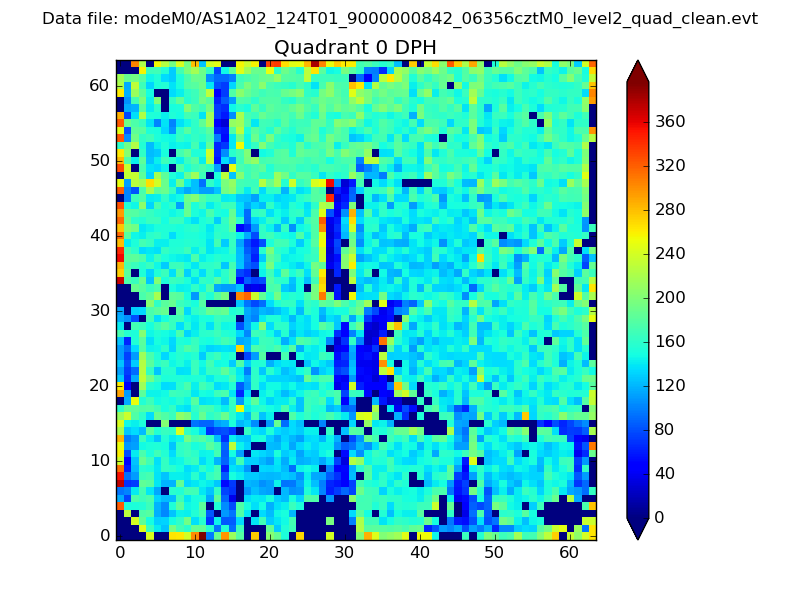 |
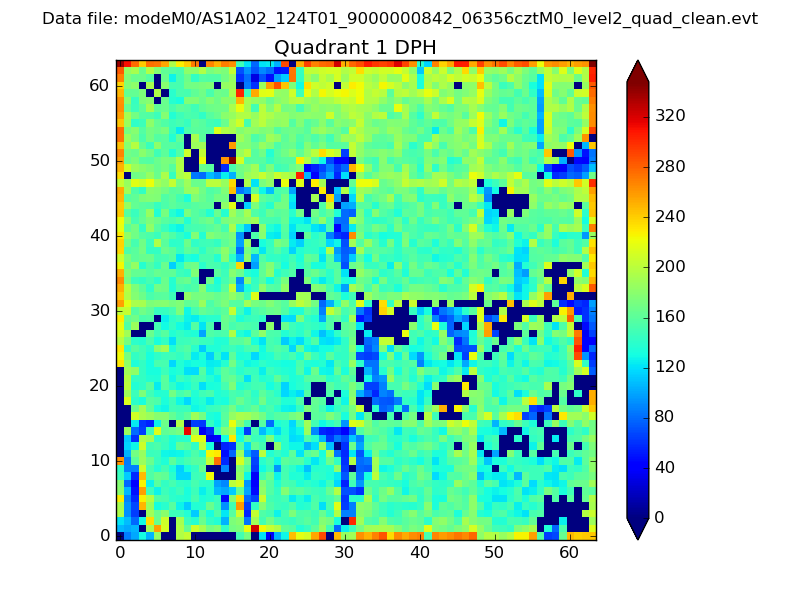 |
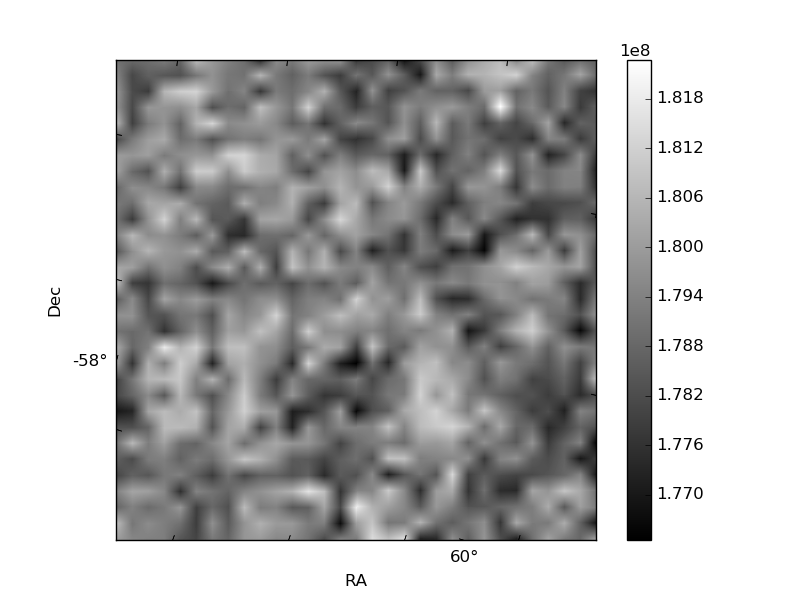
Quadrant B |
|---|---|---|---|
| Quadrant D | 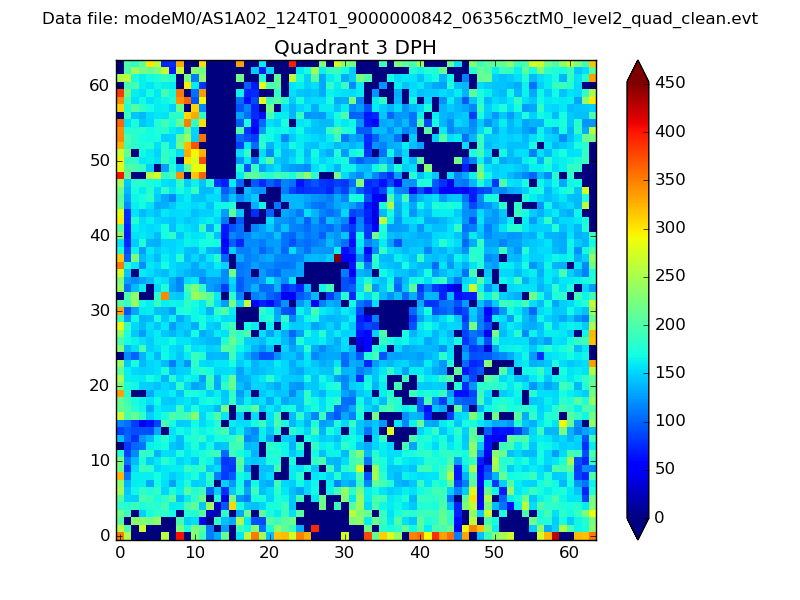 |
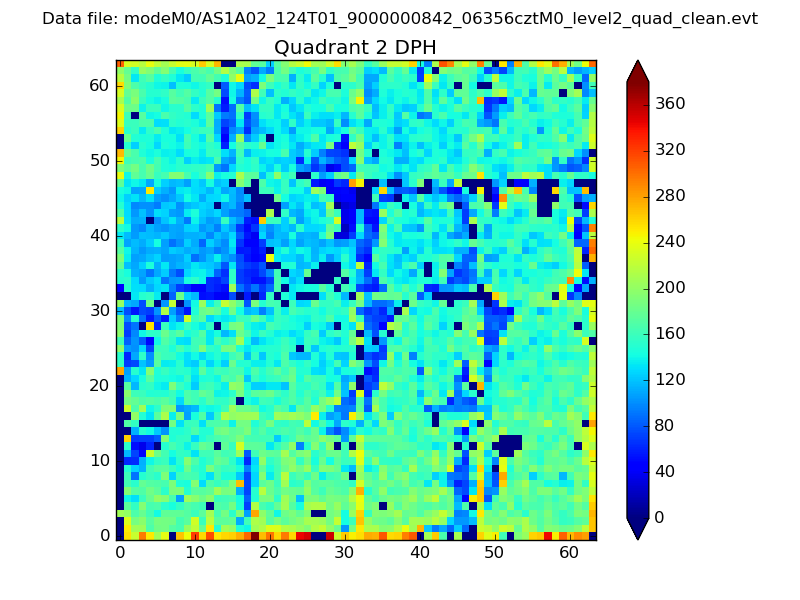 |
Quadrant C |
| Plot type | Count rate plots | Images |
|---|---|---|
| Comparison with Poisson distribution Blue bars denote a histogram of data divided into 1 sec bins. Red curve is a Poisson curve with rate = median count rate of data. |
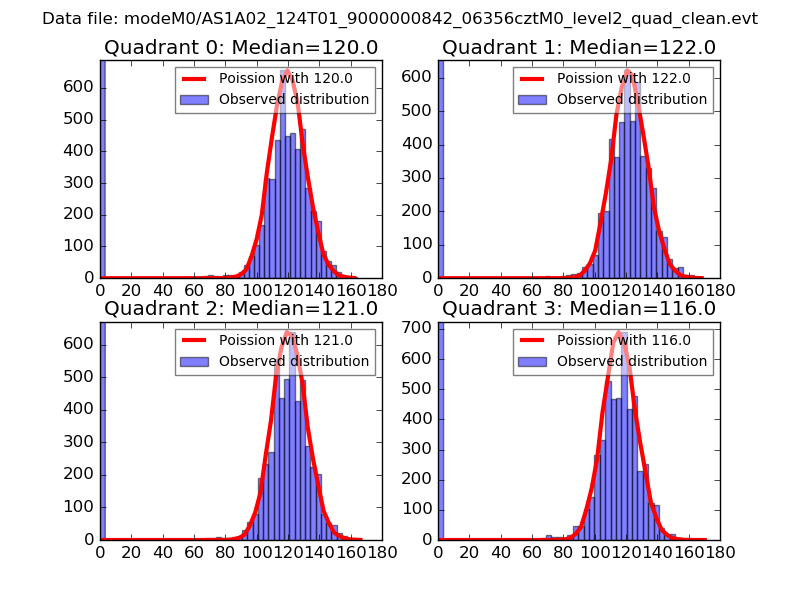 |
 |
| Quadrant-wise count rates Data is divided into 100 sec bins |
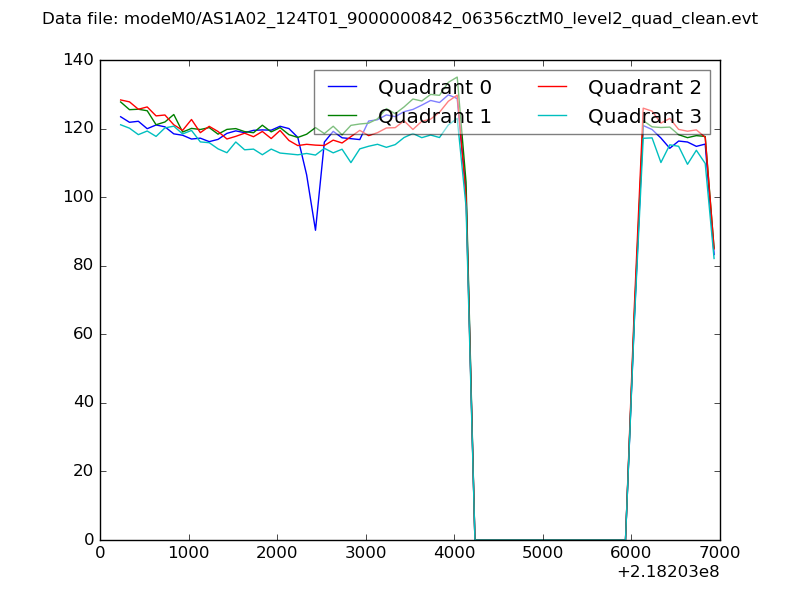 |
|
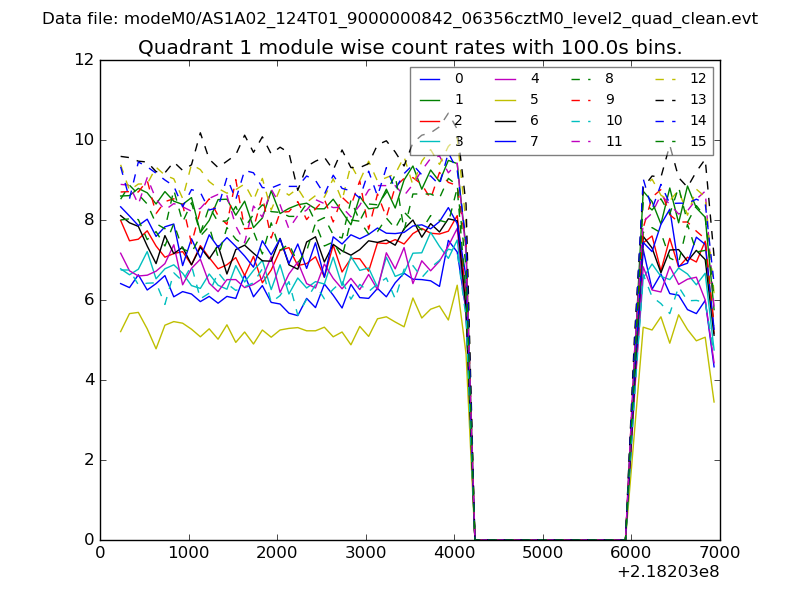
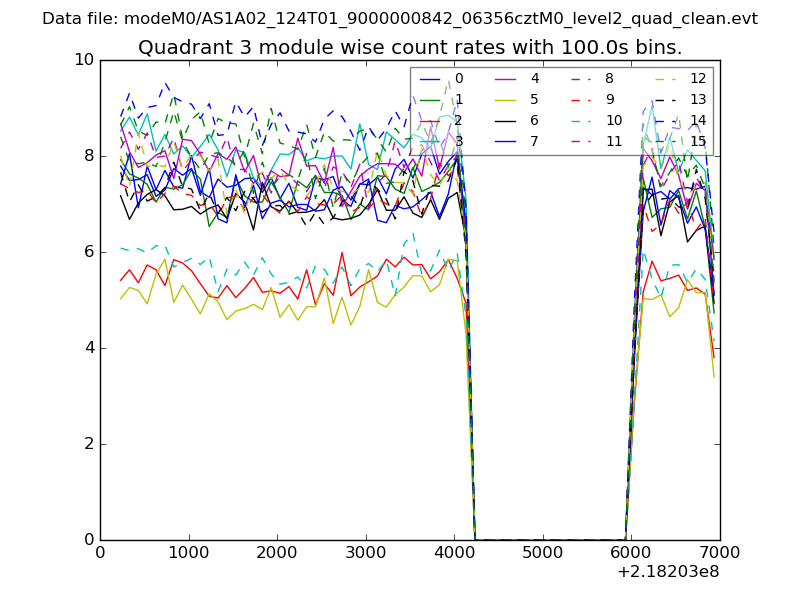
| Module-wise count rates for Quadrant A Data is divided into 100 sec bins |
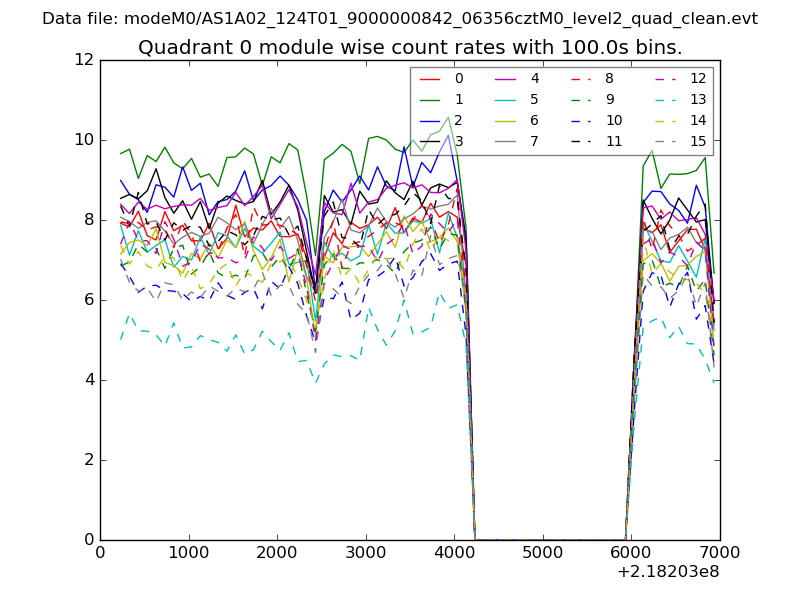 |
 |
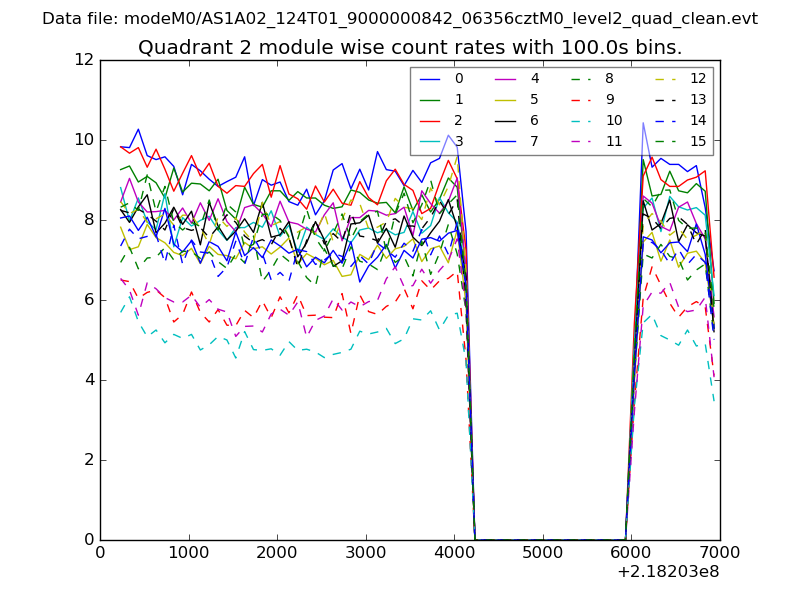
| Module-wise count rates for Quadrant B Data is divided into 100 sec bins |
 |
 |
| Module-wise count rates for Quadrant C Data is divided into 100 sec bins |
 |
 |
| Module-wise count rates for Quadrant D Data is divided into 100 sec bins |
 |
 |
| Parameter | Plot |
|---|---|
| CZT HV Monitor | 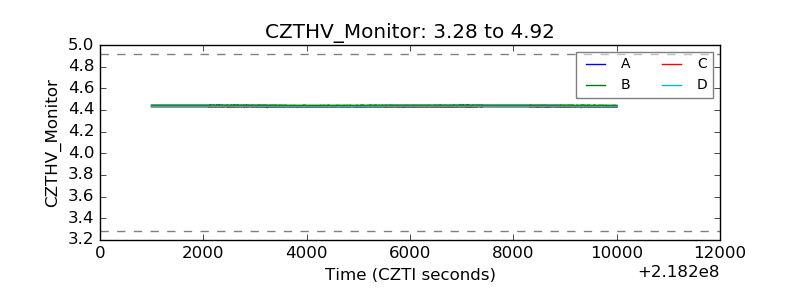 |
| D_VDD | 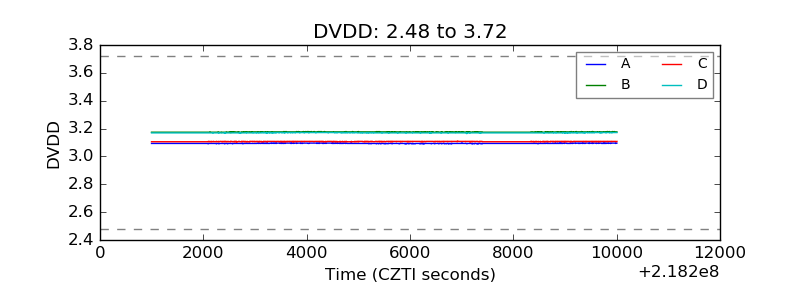 |
| Temperature 1 | 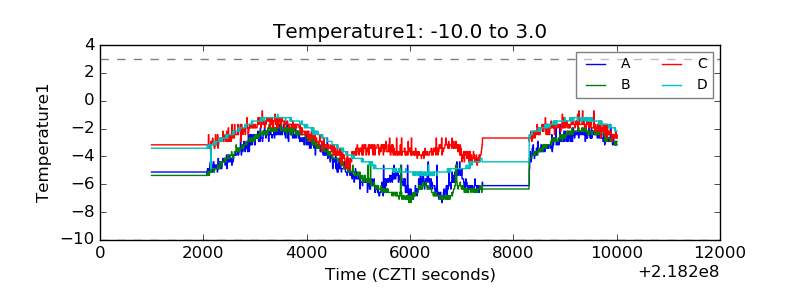 |
| Veto HV Monitor | 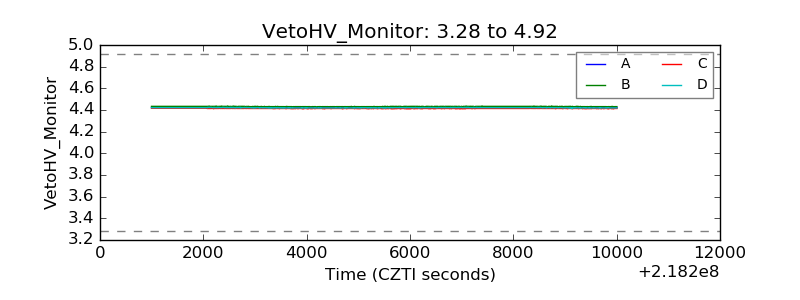 |
| Veto LLD | 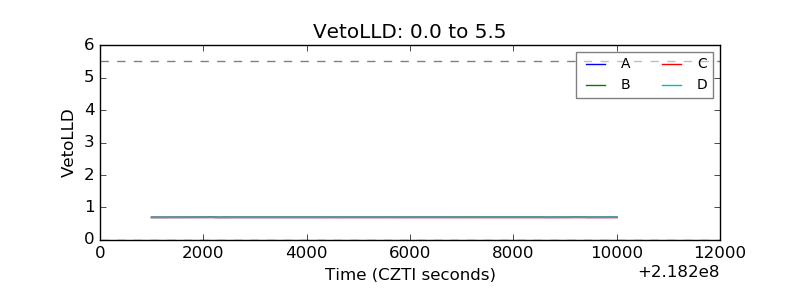 |
| Alpha Counter |  |
| _CPM_Rate | 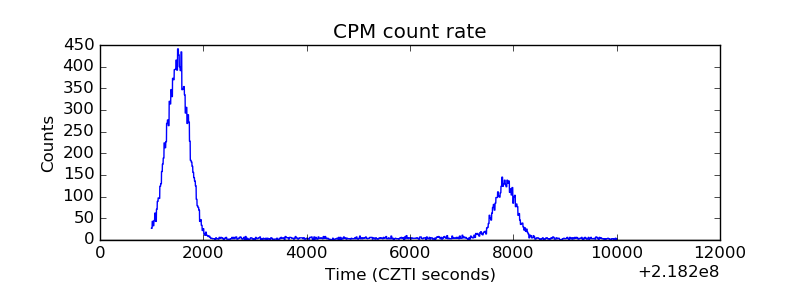 |
| CZT Counter | 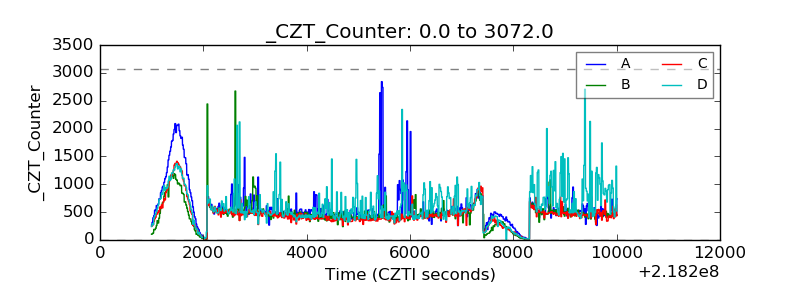 |
| +2.5 Volts monitor |  |
| +5 Volts monitor |  |
| _ROLL_ROT | 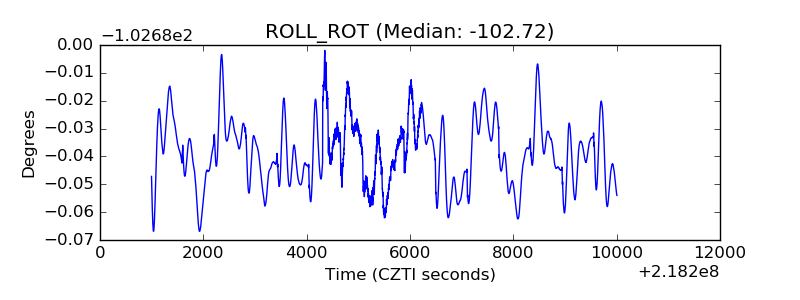 |
| _Roll_DEC | 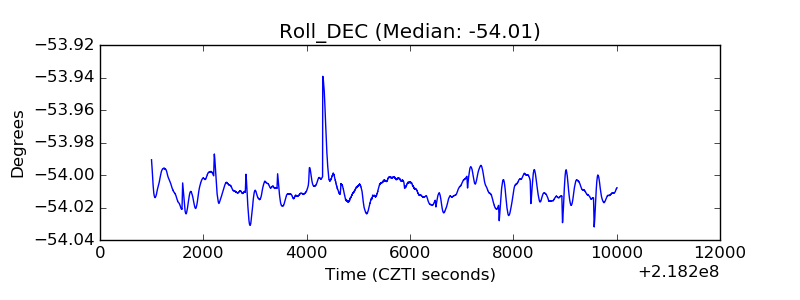 |
| _Roll_RA | 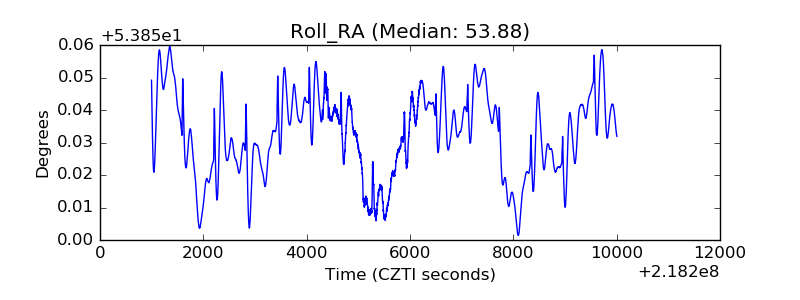 |
| Veto Counter | 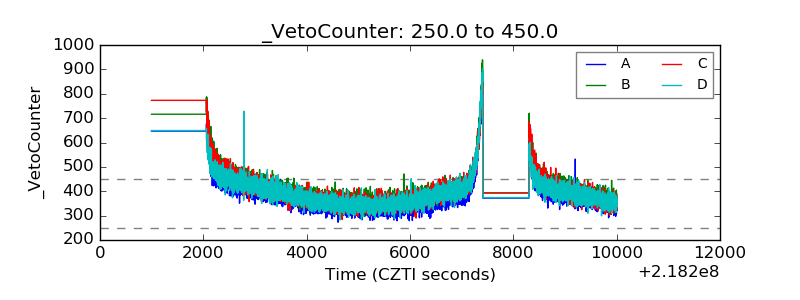 |