| Param | Original file | Final file |
|---|---|---|
| Filename | modeM0/AS1A02_124T01_9000000842_06359cztM0_level2.evt | modeM0/AS1A02_124T01_9000000842_06359cztM0_level2_quad_clean.evt |
| Size (bytes) | 491,169,600 | 99,478,080 |
| Size | 468.4 MB | 94.9 MB |
| Events in quadrant A | 3,582,800 | 632,301 |
| Events in quadrant B | 3,528,978 | 636,794 |
| Events in quadrant C | 3,309,332 | 626,172 |
| Events in quadrant D | 3,953,290 | 604,442 |
| Mode M9 | |||
|---|---|---|---|
| Quadrant | BADHDUFLAG | Total packets | Discarded packets |
| A | 0 | 3 | 0 |
| B | 0 | 3 | 0 |
| C | 0 | 3 | 0 |
| D | 0 | 3 | 0 |
| Mode M0 | |||
|---|---|---|---|
| Quadrant | BADHDUFLAG | Total packets | Discarded packets |
| A | 0 | 15514 | 2 |
| B | 0 | 15551 | 1 |
| C | 0 | 15044 | 1 |
| D | 0 | 16715 | 1 |
| Mode SS | |||
|---|---|---|---|
| Quadrant | BADHDUFLAG | Total packets | Discarded packets |
| A | 0 | 152 | 0 |
| B | 0 | 152 | 0 |
| C | 0 | 152 | 0 |
| D | 0 | 152 | 0 |
| Quadrant | Total seconds | Saturated seconds | Saturation percentage |
|---|---|---|---|
| A | 7368 | 33 | 0.447883% |
| B | 7368 | 58 | 0.787188% |
| C | 7368 | 17 | 0.230727% |
| D | 7368 | 82 | 1.112921% |
Noise dominated data is calculated using 1-second bins in cleaned event files. If a bin has >2000 counts, and if more than 50% of those come from <1% of pixels, then it is considered to be noise-dominated and hence unusable.
| Quadrant | # 1 sec bins | Bins with >0 counts | Bins with >2000 counts | High rate bins dominated by noise | Noise dominated (total time) | Noise dominated (detector-on time) | Marked lightcurve |
|---|---|---|---|---|---|---|---|
| A | 7648 | 7370 | 3 | 3 | 0.04% | 0.04% | 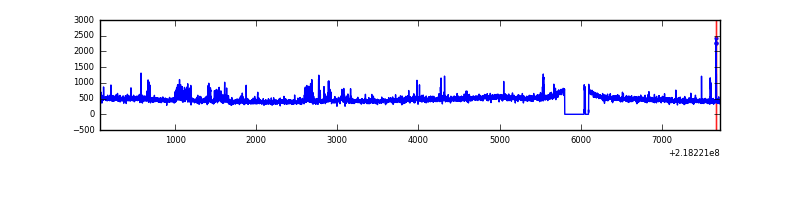 |
| B | 7648 | 7370 | 11 | 11 | 0.14% | 0.15% | 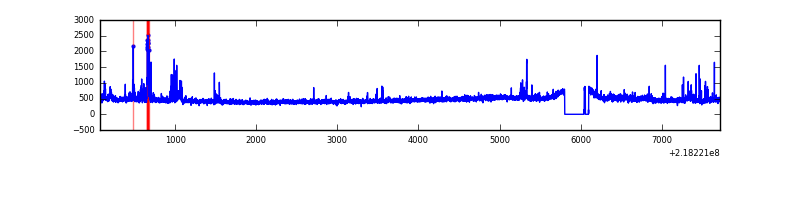 |
| C | 7648 | 7370 | 0 | 0 | 0.00% | 0.00% | 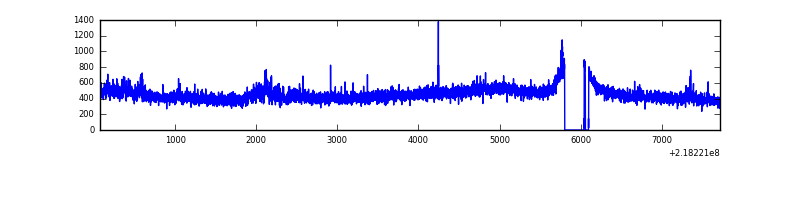 |
| D | 7648 | 7370 | 57 | 57 | 0.75% | 0.77% | 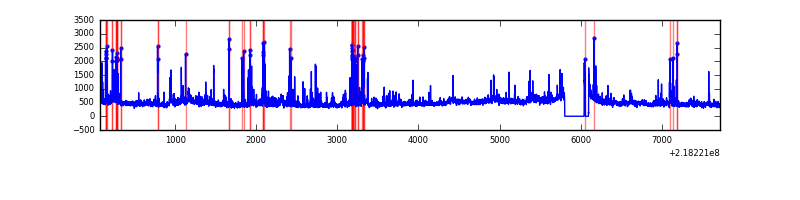 |
Top three noisy pixels from each quadrant. If the there are fewer than three noisy pixels in the level2.evt file, extra rows are filled as -1
| Pixel properties | Quadrant properties | ||||||
|---|---|---|---|---|---|---|---|
| Quadrant | DetID | PixID | Counts | Sigma | Mean | Median | Sigma |
| A | 15 | 236 | 268629 | 1561.68 | 836 | 818 | 171.5 |
| A | 13 | 251 | 34631 | 197.17 | 836 | 818 | 171.5 |
| A | 15 | 174 | 27447 | 155.28 | 836 | 818 | 171.5 |
| B | 10 | 246 | 67798 | 412.59 | 843 | 823 | 162.3 |
| B | 0 | 214 | 60402 | 367.03 | 843 | 823 | 162.3 |
| B | 15 | 204 | 37794 | 227.76 | 843 | 823 | 162.3 |
| C | 4 | 254 | 113031 | 597.51 | 808 | 810 | 187.8 |
| C | 1 | 241 | 25813 | 133.13 | 808 | 810 | 187.8 |
| C | 13 | 61 | 6287 | 29.16 | 808 | 810 | 187.8 |
| D | 11 | 241 | 264534 | 1339.41 | 805 | 779 | 196.9 |
| D | 2 | 152 | 165050 | 834.21 | 805 | 779 | 196.9 |
| D | 4 | 95 | 136554 | 689.5 | 805 | 779 | 196.9 |
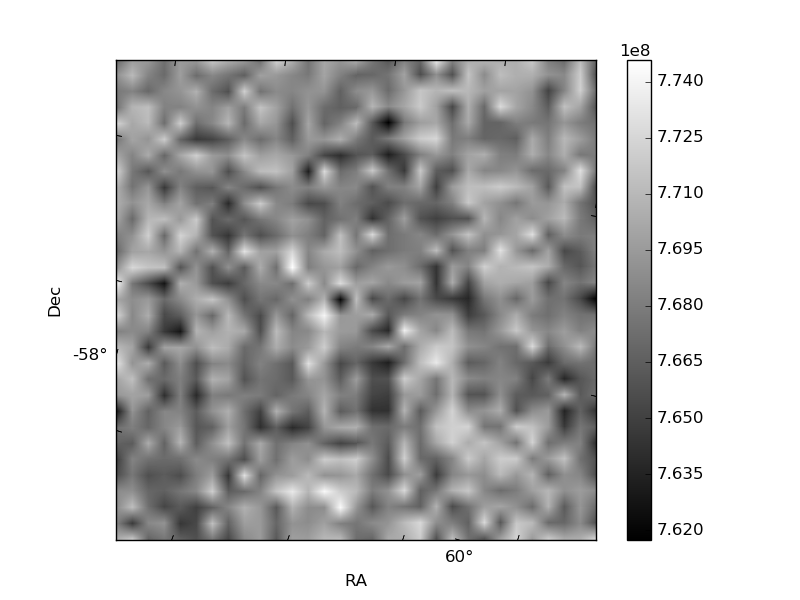
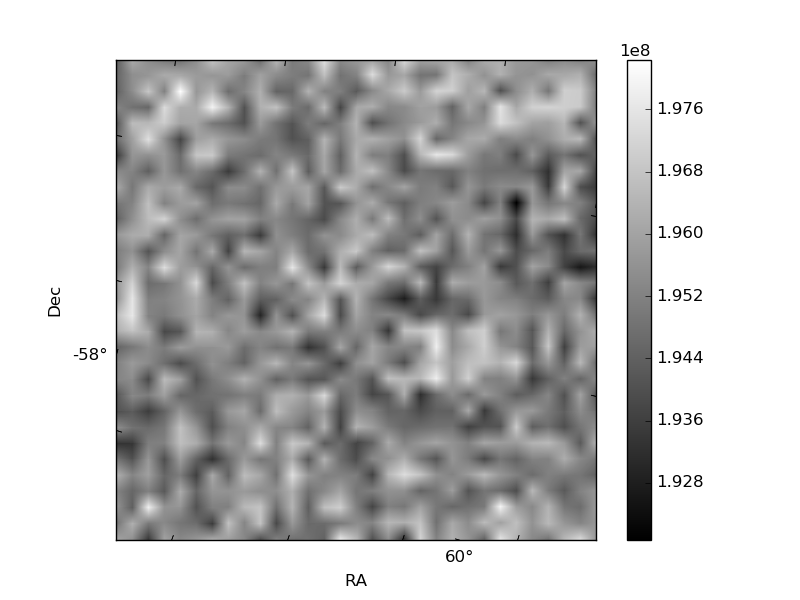
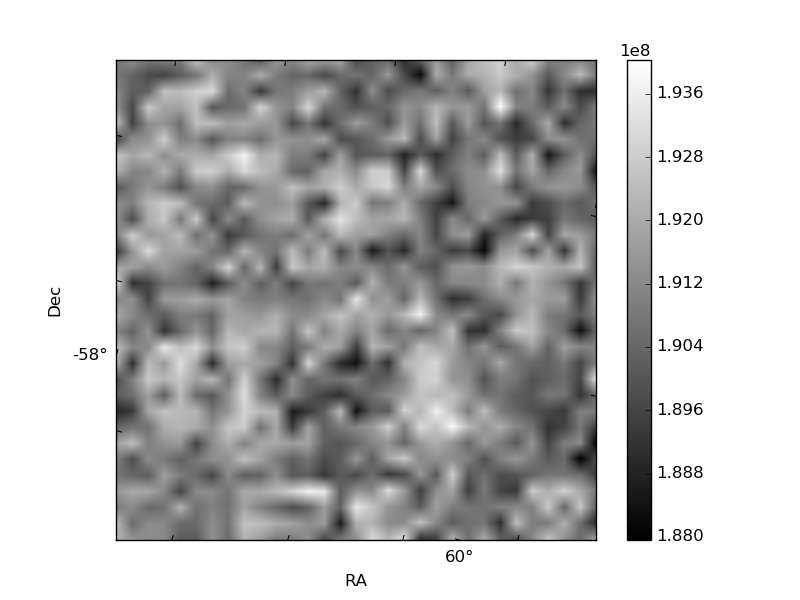
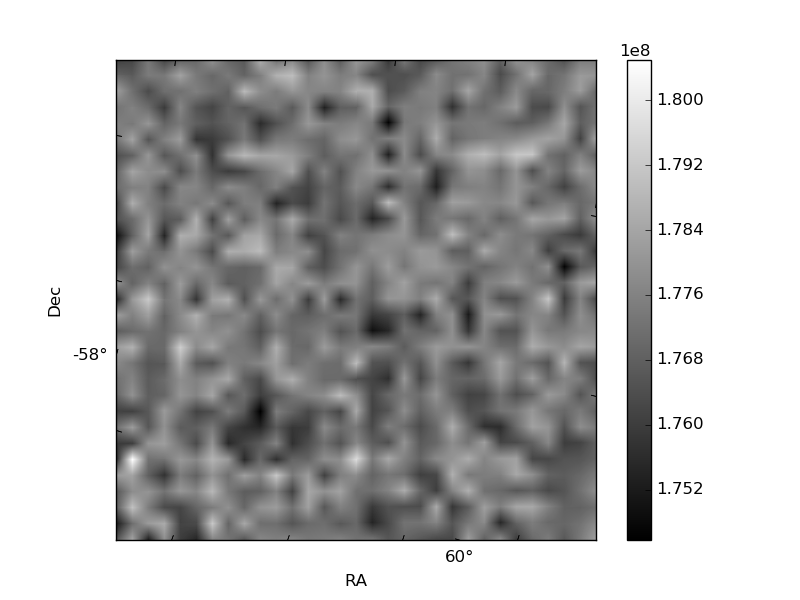
Histogram calculated using DETX and DETY for each event in the final _common_clean file
| Quadrant A | 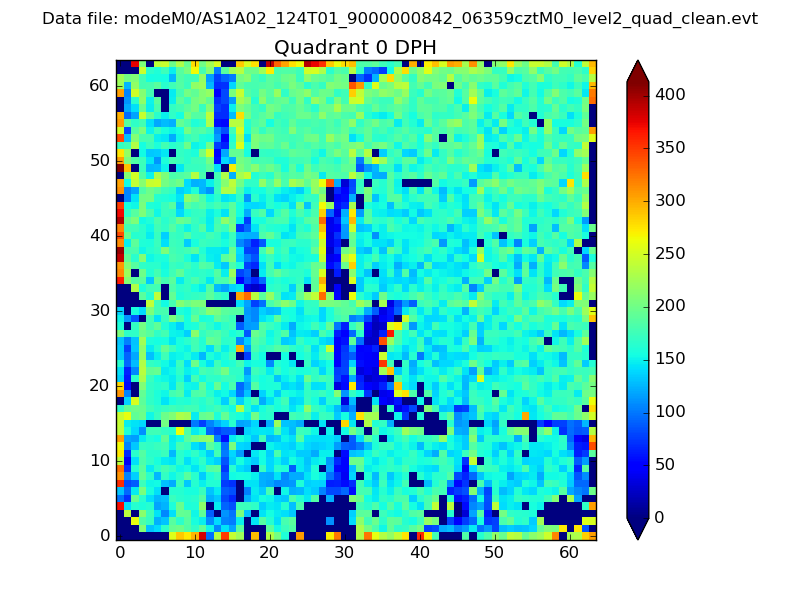 |
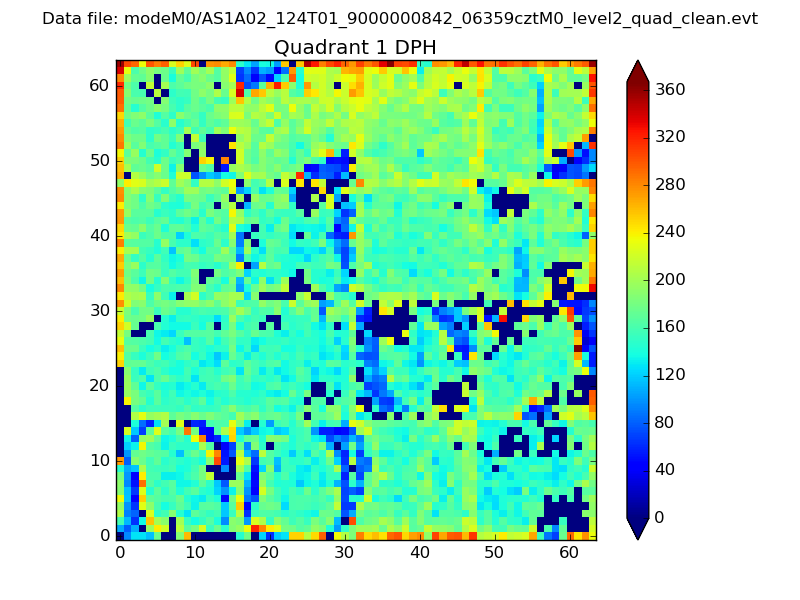 |
Quadrant B |
|---|---|---|---|
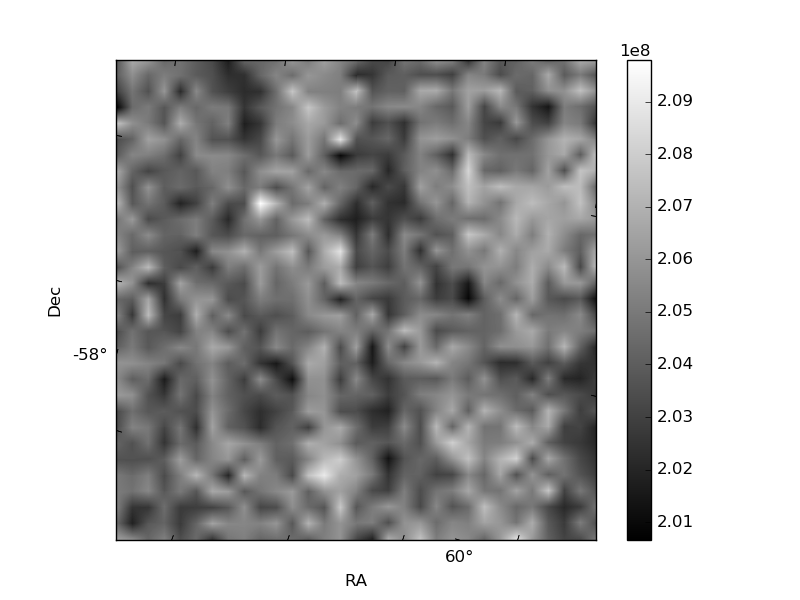
| Quadrant D | 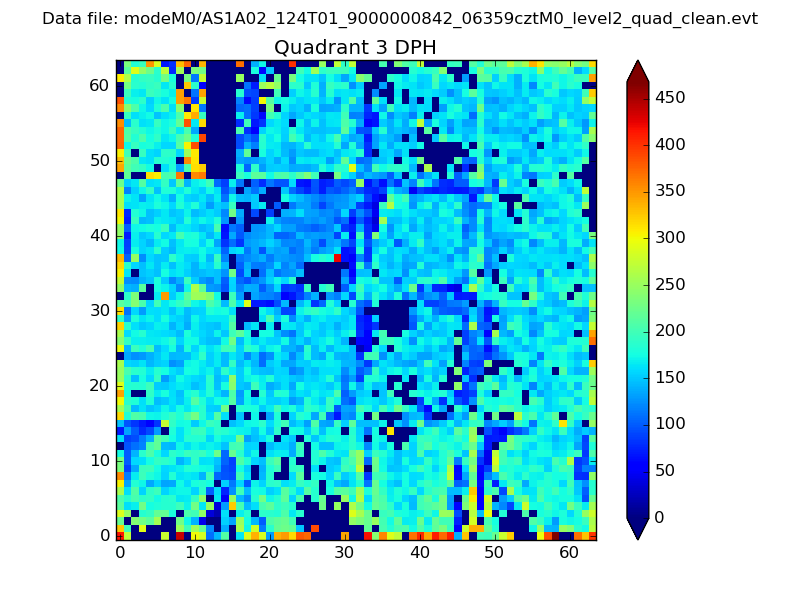 |
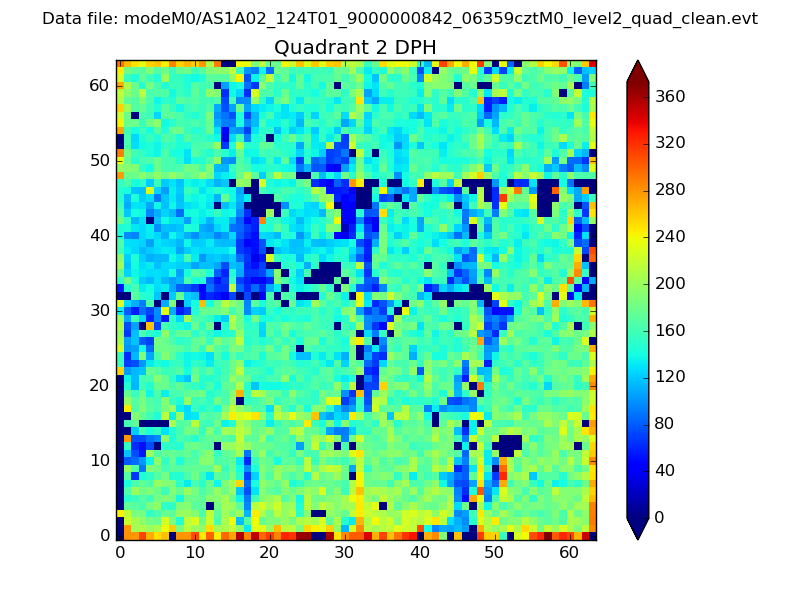 |
Quadrant C |
| Plot type | Count rate plots | Images |
|---|---|---|
| Comparison with Poisson distribution Blue bars denote a histogram of data divided into 1 sec bins. Red curve is a Poisson curve with rate = median count rate of data. |
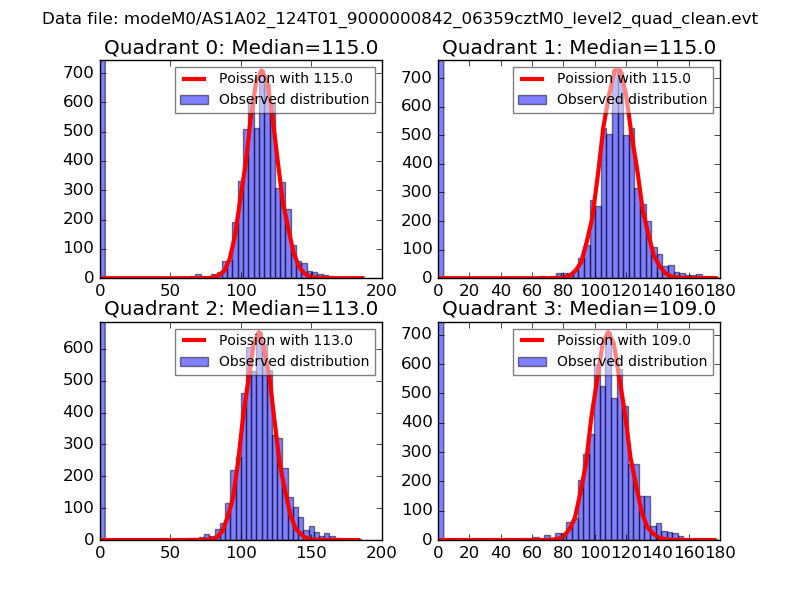 |
 |
| Quadrant-wise count rates Data is divided into 100 sec bins |
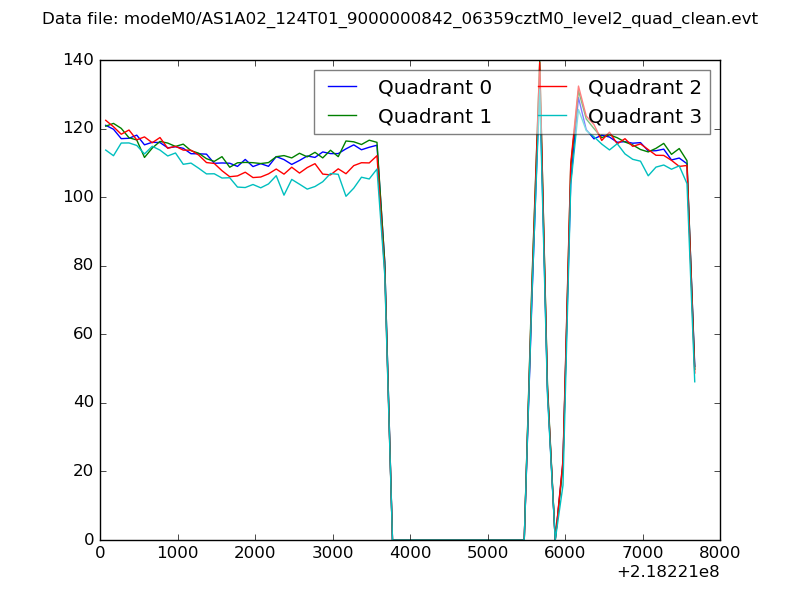 |
|
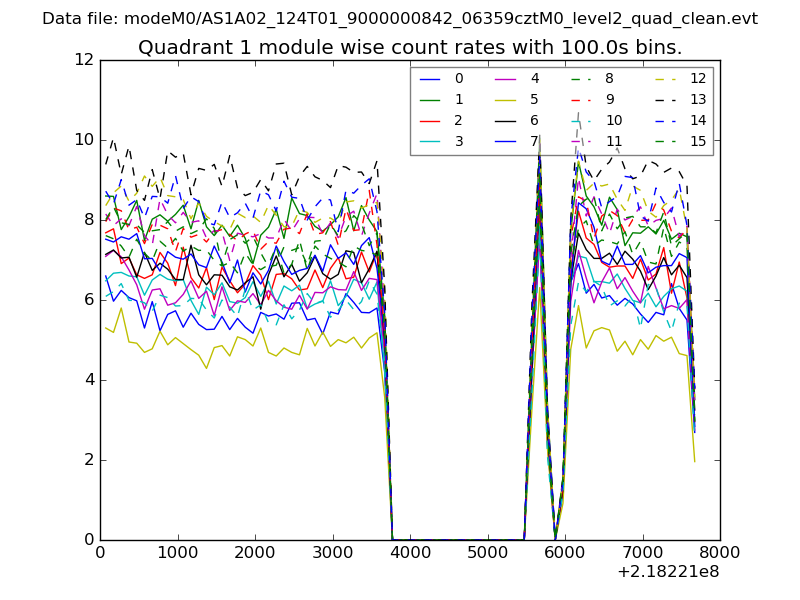
| Module-wise count rates for Quadrant A Data is divided into 100 sec bins |
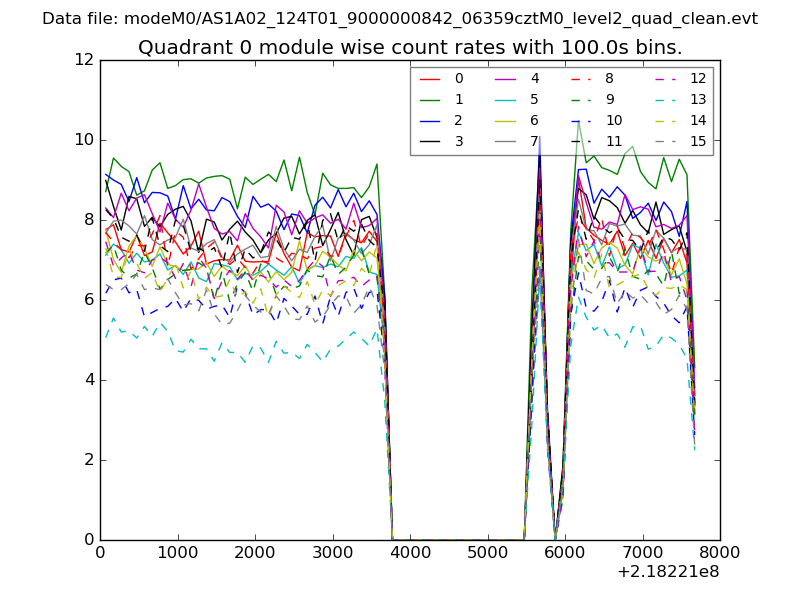 |
 |
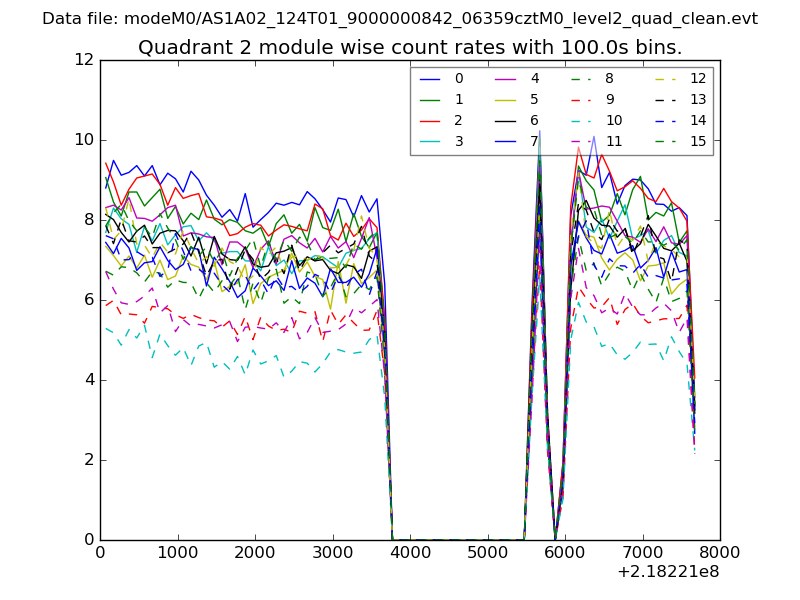
| Module-wise count rates for Quadrant B Data is divided into 100 sec bins |
 |
 |
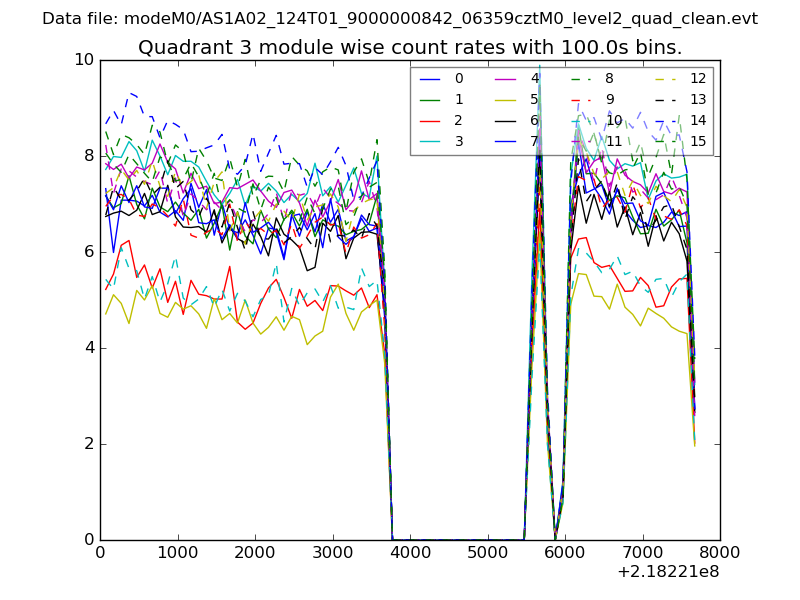
| Module-wise count rates for Quadrant C Data is divided into 100 sec bins |
 |
 |
| Module-wise count rates for Quadrant D Data is divided into 100 sec bins |
 |
 |
| Parameter | Plot |
|---|---|
| CZT HV Monitor | 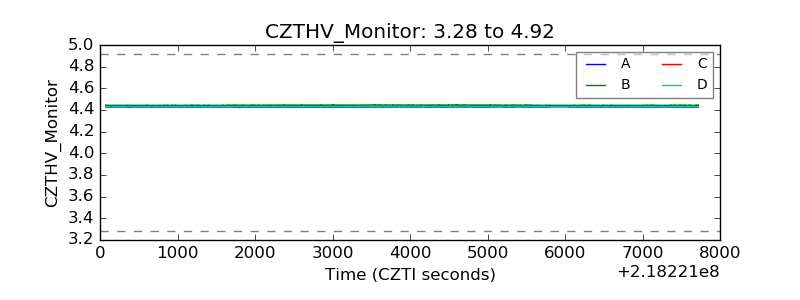 |
| D_VDD | 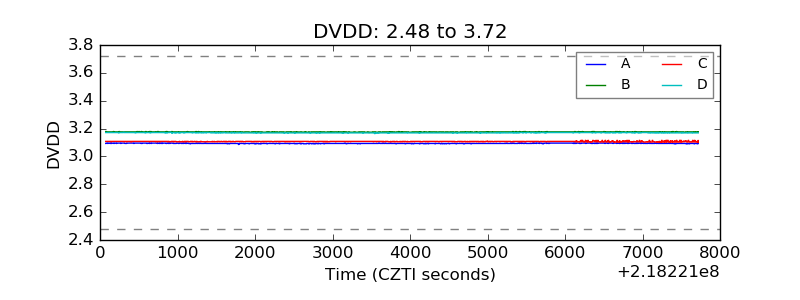 |
| Temperature 1 | 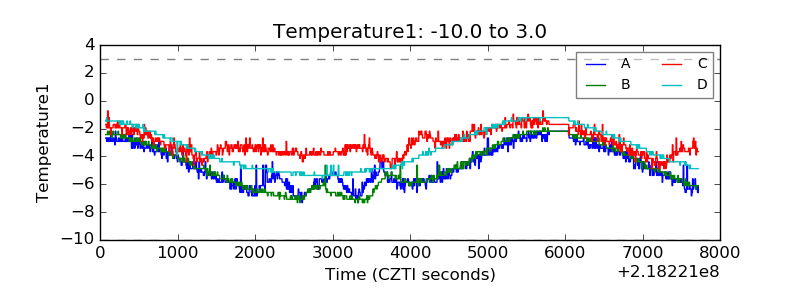 |
| Veto HV Monitor | 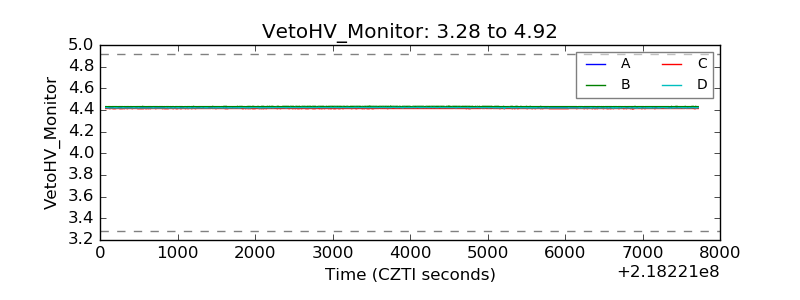 |
| Veto LLD | 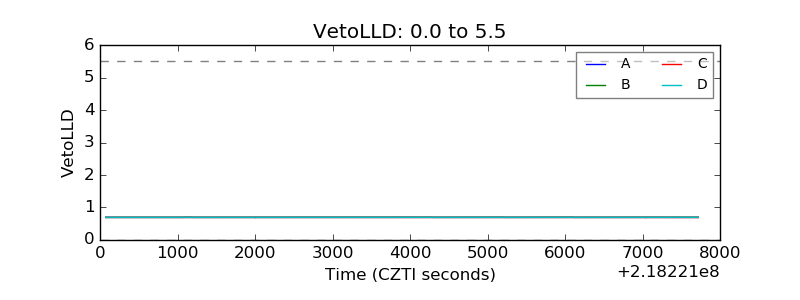 |
| Alpha Counter | 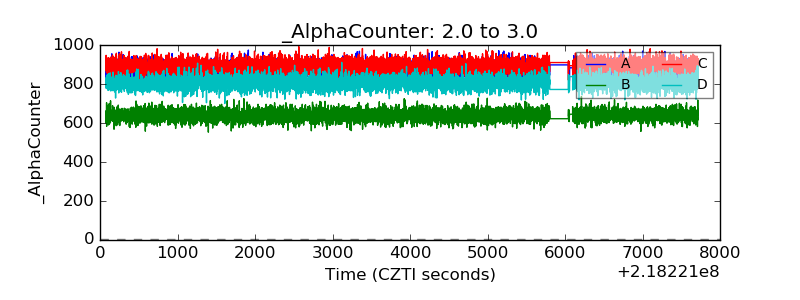 |
| _CPM_Rate | 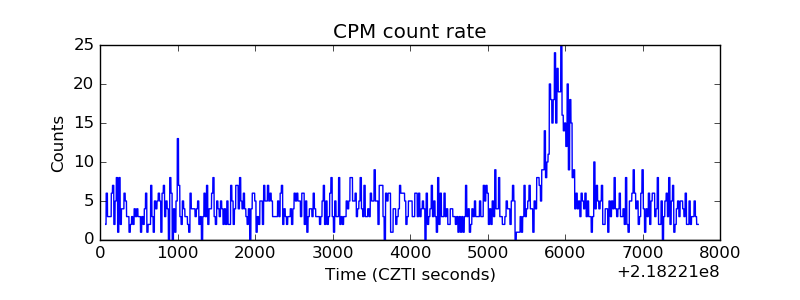 |
| CZT Counter | 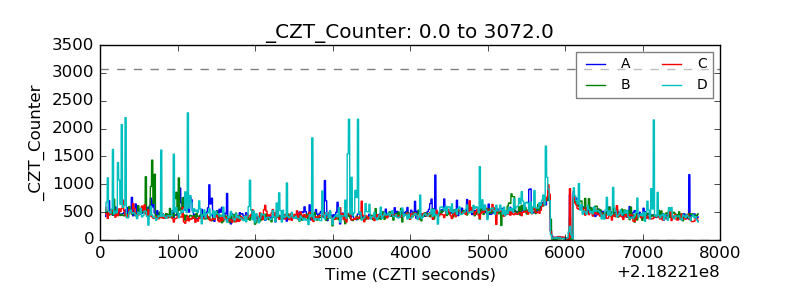 |
| +2.5 Volts monitor |  |
| +5 Volts monitor |  |
| _ROLL_ROT | 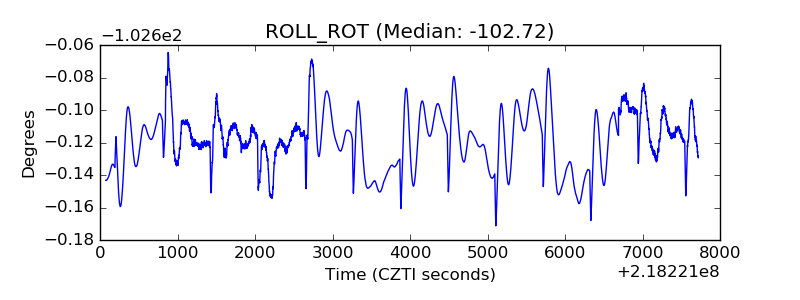 |
| _Roll_DEC | 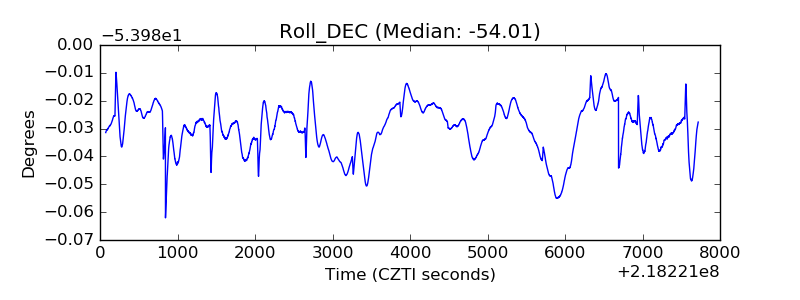 |
| _Roll_RA | 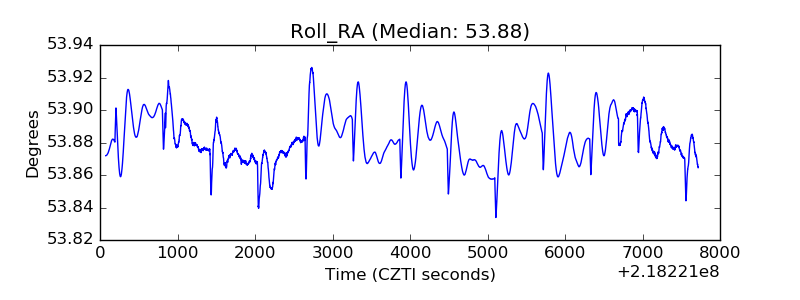 |
| Veto Counter | 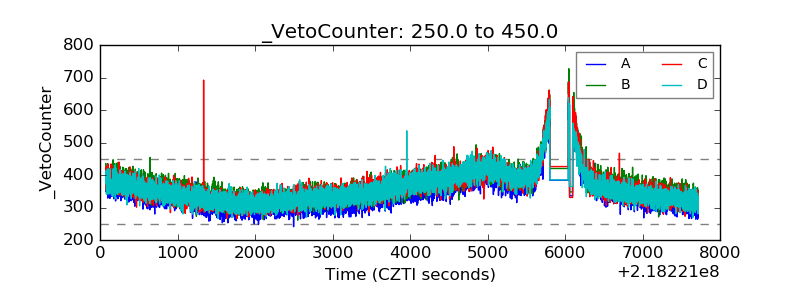 |